Applied Mathematics
Vol.4 No.6(2013), Article ID:32428,6 pages DOI:10.4236/am.2013.46120
The q-Exponential Probability Discounting of Gain and Loss
1Department of Behavioral Science, Center for Experimental Research in Social Science, Faculty of Letters, Hokkaido University, Sapporo, Japan
2Department of Forensic Psychiatry, National Institute of Mental Health National Center of Neurology and Psychiatry, Tokyo, Japan
Email: taikitakahashi@gmail.com
Copyright © 2013 Taiki Takahashi et al. This is an open access article distributed under the Creative Commons Attribution License, which permits unrestricted use, distribution, and reproduction in any medium, provided the original work is properly cited.
Received April 3, 2013; revised April 17, 2013; accepted April 25, 2013
Keywords: Probability Discounting; Neuroeconomics; Econophysics; Tsallis’ Statistics
ABSTRACT
Probability discounting is defined as the devaluation of outcomes as the probability of receiving or paying those decreases. A q-exponential probability discounting model based on Tsallis’ statistics has been proposed in econophysics (Takahashi, 2007, Physica A). We examined (a) fitness of the models to behavioral data of probability discounting of both gain and loss; and (b) relationships between parameters in the q-exponential probability discounting model across gain and loss. Our results demonstrated that, for both gain and loss, the q-exponential model better fits the behavioral data than exponential and hyperbolic functions, and there is the sign effect in q-exponential probability discounting. Relationships between Kahneman-Tversky’s prospect theory in behavioral economics and the q-exponential probability discounting are high-lightened.
1. Introduction
Decision under uncertainty has been of great interest in economics [1], behavioral economics [2,3], neuroeconomics [4-7], econophysics [8-11] and behavioral psychology [12]. Probability discounting is defined as the devaluetion of outcomes as the probability of receiving it decreases [12]. There have been several approaches for modeling human decision under risk and uncertainty. In behavioral economics, Kahneman-Tversky’s prospect theory [2,3], which is a generalization of von Neumann and Morgenstern’s expected utility theory, is the most prevalent. In contrast, “probability discounting” models explained later have widely been utilized in econophysics and behavioral psychology. Notably, the q-exponential probability model based on deformed algebra developed in Tsallis thermostatistics [13] has been proposed in econophysics [9]. Although [11] mathematically unified the approaches above based on psychophysical foundations, no experimental study to date examined the proposed unification of the choice models under uncertainty.
1.1. Intertemporal and Probabilistic Choices
The behavioral psychologist Rachlin and his colleagues
(1991) suggested that probability discounting shares the same underlying mechanism as self-control in intertermporal choice (delay discounting). Hence probability discounting can be described with the same mathematical model as delay discounting by replacing time delay (D) with odds against , where p is the probability of obtaining the outcome. Here it is to be noted that “odds against” is proportional to delay until winning in repeated gambles (because the average number of repeated trials for obtaining a uncertain reward is 1/p and waiting time is less than this by one, i.e.,
 ). The study in neuroeconomics reported intertemporal choice and probabilistic choice involve several common brain regions of executive function [5,14]. It is therefore reasonable to start from the introduction of intertemporal choice models.
In neoclassical economics where rationality in human decision making and preference is assumed, an exponential model of intertemporal choice was proposed [15]:
 (1)
(1)
where  is a subjective value of monetary outcome subject receives or pays at delay D and impulsivity parameter
  is an exponential temporal discount rate, with larger discount rate indicating more impulsive (impatient) intertemporal choice. Impulsivity (impatience) in intertemporal choice indicates the inability to wait larger later rewards at the cost of smaller sooner rewards. In behavioral economics and neuroeconomics, in contrast, a hyperbolic temporal discounting model was introduced [16]:
 (2)
(2)
where  is a subjective value of a reward which subject received with delay D and impulsivity parameter
  is a hyperbolic temporal discount rate. Again, hyperbolic temporal discount rate is a measure of impulsivity in intertemporal choice.
Finally, in econophysics, a q-exponential model based on deformed algebra investigated in Tsallis’ thermostatistics has been utilized [17-19]:
 (3)
(3)
where  is a subjective value of a reward which subject received with delay D and impulsivity parameter
  is a hyperbolic temporal discount rate at delay D = 0. Parameter q generalizes an exponential function. Equation (3) is equivalent to an exponential model (Equation (1)) when q is 1 and equivalent to a hyperbolic model (Equation (2)) when q is 0.
1.2. Mathematical Model of Probability Discounting
In order to mathematically model human probability discounting behavior, several models were proposed: exponential discounting; hyperbolic discounting [12], and qexponential discounting [9]. Because, as stated earlier, delay and probability discounting shares common neuropsychological information processing, we can adopt mathematical functions similar to those in intertemporal choice (temporal discounting), considering the mathematical equivalence of delay to “odds against”. We therefore introduce the three types of mathematical models for probability discounting in terms of, not probability per se, but “odds against” = 1/probability − 1.
The exponential probability discounting model [12] is:
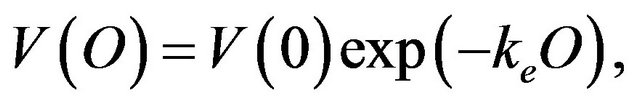 (4)
(4)
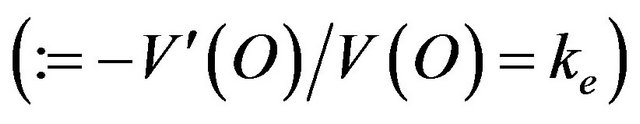
where  is a subjective value of monetary outcome subject receives or pay with “odds-against”, O = (1 − probability)/probability and risk aversion parameter
  is an exponential probability discount rate
 at all
 . The exponential probability discount rate is constant over certain odds against. It is now to be recalled that odds against corresponds to delay until winning in repeated gambles in which the reward can be obtained at the probability p. The probability discount rate indicates “impulsivity (impatience)” in repeated gambles in that subjects with greater degree of delay aversion may be unable to wait, for a long time, obtaining uncertain rewards until winning (note that for small probability gambling, we should make many trials in the repeated gambles, resulting in long waiting time for obtaining the reward).
The hyperbolic probability discounting model [12] is:
 (5)
(5)
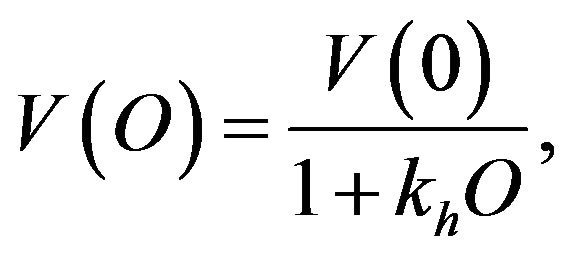
where  is a subjective value of a reward which subject received with odds against = 1/probability − 1, and risk aversion parameter
  is a hyperbolic probability discount rate
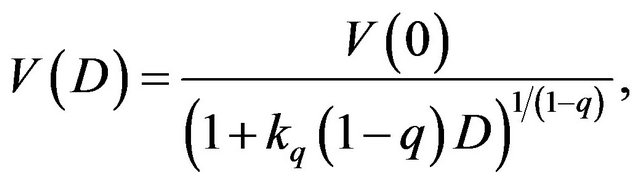
  at odds against = 0. The hyperbolic probability discount rate is a decreasing function of odds against O. Rachlin et al. (1991) reported that subjects discounted monetary gain hyperbolically, rather than exponentially, indicating that the probabilistic money amount does not steeply discount at the small odds against. In order to generalize and unify these probability discounting models, one of the authors has proposed the q-exponential probability discounting model [9] based on deformed algebra developed in Tsallis’ non-extensive thermostatistics [13]. The q-exponential probability discounting model [9] is:
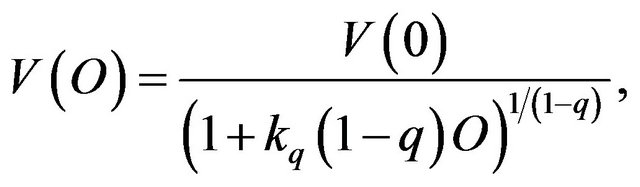 (6)
(6)
where  is a subjective value of a reward which subject receives rewards at certain odds against = 1/ probability − 1, risk aversion parameter
  is a q-exponential probability discount rate
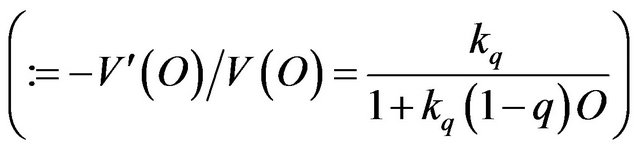 at odds against
 , and 1 − q indicates the degree of the deviation of subject’s probability discounting behavior from exponential discounting. Namely, when
 , Equation (6) is equivalent to Equation (5), and when
 , Equation (6) is equivalent to Equation (4). Note that larger probability discount rates indicate stronger risk aversion (i.e., stronger “impulsivity” in waiting for hitting the uncertain reward in repeated gambles).
Although it is important to know mathematical characteristics of the q-exponential and other modes in human decision under uncertainty, no study to date experimentally determined parameters in the q-exponential probability discounting model (Equation (6)), which is one of the objectives of the present study.
We now make short mentions on mathematical models for decision under uncertainty in behavioral economics. In behavioral economics, in order to explain anomalies (i.e., deviations from von Neumann and Morgenstern’s expected utility theory, [1]) in human decision under uncertainty, Kahneman and Tversky proposed the prospect theory [2]. In Kahneman and Tversky’s prospect theory (1979), the probability weighting function presented as a non-linear inverted S-shape curve, where people tend to overestimate (overweigh) small probability while underestimate (underweigh) large probability. This psychological tendency is mathematically captured with the inverted S-shaped probability weighting function. In terms of the valuation of outcomes, the prospect theory assumes that loss has larger impact on human valuation than gain, which indicates loss aversion in the value function. Additionally, concavities in value function differ across gain and loss. In other words, people have riskaversive attitude for again while risk-prone attitude for loss.
In neuropsychopharmacology, Ohmura et al. (2005) have revealed that gain is more strongly probability-discounted than loss which is referred to as the “sign effect” in probability discounting. However, to date, no study compared probability discounting of and gain loss using the q-exponential model. Our present study is the first to attempt to experimentally examine parameters in the qexponential probability discounting model (as well as exponential and hyperbolic probability discounting models) for gain and loss in human subjects.
The objectives of the present study is 1) to examine the relationships between parameters of q-exponential probability discounting models across gain and loss; and 2) to examine the relationship between the q-exponential probability discounting model and the probability weighting model in behavioral economics (i.e., KahnemanTversky’s prospect theory). These examinations may help future investigations in mathematical physics, econophysics and neuroeconomics.
2. Method
2.1. Participants
Forty-one (22 males and 19 females) students were recruited from Chuo University in Japan to take part in the experiment. The mean age was 23.31 years old (standard deviation = 3.20). In our experiment, participants were isolated and did not interact with each other.
2.2. Procedure
The participants were asked to perform probability discounting tasks of gain and loss. They were seated individually in a quiet room, facing the experimenter across a table. Then they received a simple instruction that they were asked to choose from a series of alternatives of monetary amounts either gain or loss with certain probabilities and imagine them, though hypothetical, as real money in this experiment.
We utilized a probability discounting task exactly as Takahashi et al. [6,7]. The hypothetical monetary amounts of gain (or pay) and the probabilities were printed on each A4 size page. Each page included each probability (in the order of 95%, 90%, 70%, 50%, 30%, 10%, 5%) of uncertain gain (or loss) that the participants would hypothetically receive (or pay). Two columns of hypothetical money amounts were listed. The right column (standard amount) presented 40 rows of a fixed magnitude of monetary amount (=10,000 yen); the left column (adjusted amount) presented 40 rows of ascending or descending magnitudes of monetary amounts in 2.5% increments ( yen) of the alternative in the right column. The participants were asked to choose between the two alternatives (i.e. either standard amount on the right or adjusted amount on the left) in each row of the questionnaire.
2.3. Data Analysis
Switching points of the probability tasks were defined as the means of the largest adjusting amount in which the standard alternative choice and the smallest adjusting amount in which the adjusting alternative choice. Indifference points of individuals were calculated by averaging the switching point in the ascending and descending adjusting conditions. The indifference points of the group data were obtained by calculating the medians of individuals’ indifference points in order to compare the goodness-of-fit among the exponential, the hyperbolic and the q-exponential models at the group level.
We employed discounting and psychophysical parameters introduced in the discounting model (see Equations (1)-(3)). For estimating the parameters (i.e. ke in the exponential discounting, kq and q in the q-exponential discounting, kh in the hyperbolic discounting), we fitted the three types of the discount model equations (i.e. Equations (1)-(3)) to group’s behavioral data of indifference points with the Gauss-Newton algorithm (using R statistical language, non-linear modeling package). The fitness of each equation was estimated with AIC (Akaike Information Criterion) values, which is the most standard criterion for the fitness of mathematical model to observed data. It should be noted that the comparison between the R-square values of equations with different numbers of free parameters are statistically irrelevant (note that an increase in the numbers of free parameters in a fitting equation always yield a larger R-square value). Note that the AIC = 2k − 2ln (L), where k is the number of parameters in the statistical model and L is the maximized value of the likelihood function for the estimated model. Given a set of candidate models for the data, the preferred model is the one with the smallest AIC value. AIC includes a penalty that is an increasing function of the number of estimated parameters. This penalty discourages overfitting (with R-square, we can not say a priori that the q-exponential model should best fit in terms of AIC). Therefore, better fitting in terms of smaller AIC indicates a better trade-off between over fitting and poor fitting.
3. Result
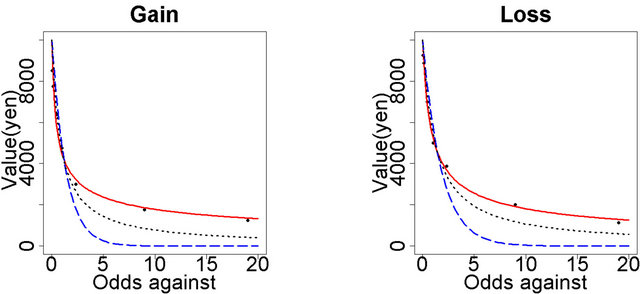
First, we estimated the parameters of three types of probability discounting models (i.e., exponential, hyperbolic, and q-exponential models) in terms of odds against = 1/ probability − 1 (proportional to waiting time in repeated gambles) by fitting the three types of equations to group median data of the indifference points at the seven probabilities (see Figures 1(a) and (b) for gain and loss). After fitting each model to the group median data, we calculated AIC with best-fit parameters as an index of fitness (see Table 1 for gain and for loss for estimated parameters and AICs of the group data). The orders of the AICs for group median data were [q-exponential discounting function < Simple hyperbolic discounting function < Exponential discounting function]. We can see that the q-exponential discount model best fitted the behavioral data (i.e. smallest AIC for the q-exponential function) (see Figure 1(a) for gain and Figure 1(b) for loss). Since the inequalities on AIC are not due to differences in the number of free parameters in the probability discounting models (see Section 2.3), the result also indicates that the exponential discounting function more poorly fitted the behavioral data than simple hyperbolic discounting. Note also here that because the horizontal axis is the odds against (Figure 1), rather than probability per se, a log-log plot which is widely-utilized in econophysics does not make much sense here. Further, the result also showed that gain k is larger than loss k in all three models (see Table 1), which suggests the existence of “sign effect” in probability discounting.
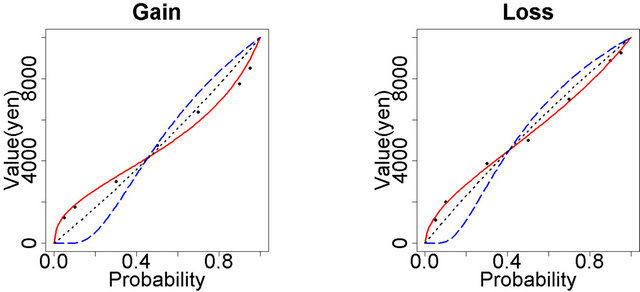
In order to compare the probability discounting models and the probability weighting functions in KahnemanTversky’s prospect theory for decision under uncertainty, we plotted the probability-discounted values for the seven probabilities (Figures 2(a) and (b) for gain and loss). We can see that, among the three mathematical models, the q-exponential probability discount model alone was capable of capturing the feature of the inverted S-shaped probability weighting function in the prospect theory for both gain (Figure 2(a)) and loss (Figure 2(b)), indicating that the utilization of neither exponential nor hyperbolic model can correctly predict human decision under uncertainty in behavioral economics. It is finally to be noticed that q-exponential models in terms of odds against seems to better describe human decision under uncertainty than those in terms of probability, especially at large probabilities in gain (see Figures 1 and 2).
4. Discussion
To our knowledge, this study is the first to experimentally examine the mathematical characteristics of probability discounting models for gain and loss, by utilizing the q-exponential discounting model based on deformed
 (a) (b)
Figure 1. Probability discount functions in terms of odds against = 1/probability − 1 which is proportional to delay until winning in repeated gambles. The vertical axis is the subjective value of uncertain monetary outcome (10,000 yen). The horizontal axis is the odds against = (1/probability) − 1. The curves indicate probability discounting for gain (a) and loss (b). The red solid curve is the q-exponential function (the best-fitting model); the blue dashed curve is the exponential function; the black dotted curve is the simple hyperbolic function.
 (a) (b)
Figure 2. Probability discounting functions in terms of probability. The vertical axis is the subjective value of uncertain monetary gain (a) or loss (b) (10,000 yen) which one can (a) receive or (b) loose at the probability of p. The horizontal axis is probability p. The red solid curve is the q-exponential function (the best-fitting model) in terms of probability. The blue dashed curve is the exponential function. The black dotted curve is the simple hyperbolic function. Neither exponential nor simple hyperbolic model can capture the inverted S shaped characteristics of the probability weighting function in Kahneman-Tversky’s prospect theory.
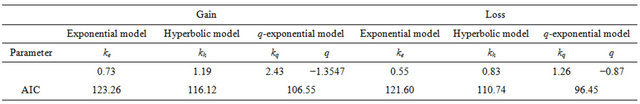
Table 1. Parameters and AICs for the three probability discounting models of gain and loss.
algebra developed in Tsallis’ thermostatistics. Our results demonstrated that the q-exponential model best fitted human probability discounting behavior for both gain and loss. Regarding the comparison between exponential and hyperbolic discounting models, the results were consistent with previous studies [12] that hyperbolic discounting model was better fitted than exponential model. It is to be noted that in our experiment, each subject independently conducted the probability discounting task, similar to previous studies (e.g., [6,7,12]). Therefore, the deviation from the exponential probability discounting is not due to social interactions between the subjects during conducting the probability discounting task, consistent with previous experimental results [6,7,12,20]. The estimated q value in the q-exponential discounting was smaller than 0, which means more waiting time-inconsistent probability discounting in human decision under risk, in comparison to hyperbolic probability discounting (note that smaller q < 1 indicates more time-inconsistent discounting behavior, i.e., more deviation from exponential discounting).
Regarding the neuropsychological causes of the deviation from exponential probability discounting in human decision under uncertainty, it can be speculated that nonlinear (e.g., logarithmic) perception of waiting time during repeated gambles may account for the q-exponential probability discounting with q < 0, as was the case with the q-exponential (non-exponential) temporal discounting in intertemporal choice [18,21,22]. In other words, if people are less sensitive to changes in waiting time at longer waiting time (i.e., smaller probabilities), the resulting probability discounting behavior may be more hyperbolic rather than exponential. This possibility should be investigated in future mathematical psychophysical studies on human decision under risk.
The sign effect in probability discounting that indicates gain is more greatly probability-discounted than loss (i.e., larger k values for gain than loss), was observed (see Table 1). The sign effect in probability discounting behavior was found in all the mathematical models (exponential, hyperbolic and q-exponential models) in the current study. This suggests that the degree of impulsivity which indicated by k, is significantly different between gain and loss in probability discounting as well as delay discounting as previously reported (e.g., [20]). This suggests that the impulsivity in the q-exponential model may share similar mechanism.
The prospect theory contends that probability weighting function presented in the non-linear manner that people tend to overestimate the small probability while underestimating large probability. For probability discounting, when we plotted discount function in terms of probability p rather than odds against  (see Figure 2(a) for gain and Figure 2(b) for loss), the shape of theoretical curve was similar to the probability weighting function in the prospect theory, only for the q-exponential probability discount function. Therefore, we should employ the q-exponential model to capture the characteristics of the probability weighting function. In addition, loss was less probability-discounted than gain (see Figure 1(a) for gain and Figure 1(b) for loss) thus it can be said that, in terms of probability discounting, people are more risk aversive (i.e., greater temporal discounting in waiting for hitting the uncertain outcomes) in loss than gain. Future studies in econophysics and neuroeconomics should consider this finding.
5. Acknowledgements
The research reported in this paper was supported by a grant from the Grant-in-Aid for Scientific Research (Global COE and on Innovative Areas, 23118001; Adolescent Mind & Self-Regulation) from the Ministry of Education, Culture, Sports, Science and Technology of Japan.
REFERENCES
- J. von Neumann and O. Morgenstern, “Theory of Games and Economic Behavior,” 2nd Edition, Princeton University Press, Princeton, 1947.
- D. Kahneman and A. Tversky, “Prospect Theory: An Analysis of Decisions under Risk,” Econometrica, Vol. 47, No. 2, 1979, pp. 263-291. doi:10.2307/1914185
- A. Tversky and D. Kahneman, “Advances in Prospect theory: Cumulative Representation of Uncertainty,” Journal of Risk and Uncertainty, Vol. 5, No. 4, 1992, pp. 297-323. doi:10.1007/BF00122574
- M. P. Paulus and L. R. Frank, “Anterior Cingulate Activity Modulates Nonlinear Decision Weight Function of Uncertain Prospects,” Neuroimage, Vol. 30, No. 2, 2006, pp. 668-677. doi:10.1016/j.neuroimage.2005.09.061
- J. Peters and C. Büchel, “Overlapping and Distinct Neural Systems Code for Subjective Value during Intertemporal and Risky Decision Making,” The Journal of Neuroscience, Vol. 29, No. 50, 2009, pp. 15727-15734. doi:10.1523/JNEUROSCI.3489-09.2009
- T. Takahashi, H. Oono and M. H. B. Radford, “Comparison of Probabilistic Choice Models in Humans,” Behavioral and Brain Functions, Vol. 3, No. 20, 2007.
- T. Takahashi, K. Ikeda and T. Hasegawa, “A Hyperbolic Decay of Subjective Probability of Obtaining Delayed Rewards,” Behavioral and Brain Functions, Vol. 3, No. 52, 2007.
- C. Anteneodo, C. Tsallis and A. S. Martinez, “Risk Aversion in Economic Transactions,” Europhysics Letters, Vol. 59, No. 5, 2002, pp. 635-641. doi:10.1209/epl/i2002-00172-5
- T. Takahashi, “A Probabilistic Choice Model Based on Tsallis’ Statistics,” Physica A: Statistical Mechanics and its Applications, Vol. 386, No. 1, 2007, pp. 335-338.
- T. Takahashi, “Tsallis’ Non-Extensive Free Energy as a Subjective Value of an Uncertain Reward,” Physica A: Statistical Mechanics and Its Applications, Vol. 388, No. 5, 2009, pp. 715-719.
- T. Takahashi, “Psychophysics of the Probability Weighting Function,” Physica A: Statistical Mechanics and Its Applications, Vol. 390, No. 5, 2011, pp. 902-905.
- H. Rachlin, A. Raineri and D. Cross, “Subjective Probability and Delay,” Journal of Experimental. Analysis of Behavior, Vol. 55, No. 2, 1991, pp. 233-244. doi:10.1901/jeab.1991.55-233
- C. Tsallis, C. Anteneodo, L. Borland and R. Osorio, “NonExtensive Statistical Mechanics and Economics,” Physica A: Statistical Mechanics and Its Applications, Vol. 324, No. 1-2, 2003, pp. 89-100.
- B. J. Weber and S. A. Huettel, “The Neural Substrates of Probabilistic and Intertemporal Decision Making,” Brain Research, Vol. 1234, 2008, pp. 104-115. doi:10.1016/j.brainres.2008.07.105
- P. Samuelson, “A Note on Measurement of Utility,” The Review of Economic Studies,” Vol. 4, No. 2, 1937, pp. 155-161. doi:10.2307/2967612
- J. E. Mazur, “An Adjustment Procedure for Studying Delayed Reinforcement,” In: J. E. Mazur, J. A. Nevin and H. Rachlin, Eds., The Effect of Delay and Intervening Events on Reinforcement Value, Michael L. Commons, Hillsdale, 1987.
- D. O. Cajueiro, “A Note on the Relevance of the q-Exponential Function in the Context of Intertemporal Choices,” Physica A: Statistical Mechanics and Its Applications, Vol. 364, 2006, pp. 385-388.
- T. Takahashi, H. Oono and M. H. B. Radford, “Psychophysics of Time Perception and Intertemporal Choice Models,” Physica A: Statistical Mechanics and Its Applications, Vol. 387, No. 8-9, 2008, pp. 2066-2074.
- T. Takahashi, “Theoretical Frameworks for Neuro-Economics of Intertemporal Choice,” Journal of Neuroscience, Psychology, and Economics, Vol. 2, No. 2, 2009, pp. 75-90. doi:10.1037/a0015463
- Y. Ohmura, T. Takahashi and N. Kitamura, “Discounting Delayed and Probabilistic Monetary Gains and Losses by Smokers of Cigarettes,” Psychopharmacology (Berlin), Vol. 182, No. 4, 2005, pp. 508-515.
- T. Takahashi, “Loss of Self-Control in Intertemporal Choice May Be Attributable to Logarithmic Time-Perception,” Medical Hypotheses, Vol. 65, 2005, pp. 691-693. doi:10.1016/j.mehy.2005.04.040
- R. Han and T. Takahashi, “Psychophysics of Valuation and Time Perception in Temporal Discounting of Gain and Loss,” Physica A: Statistical Mechanics and Its Applications, Vol. 391, No. 24, 2012, pp. 6568-6576.