Modern Economy
Vol.4 No.3A(2013), Article ID:29143,12 pages DOI:10.4236/me.2013.43A024
Has the 2009 Mexican Economic Crisis Been the Worst Ever?
Center of Modeling and Economic Forecasting, School of Economics, National Autonomous University of Mexico, Mexico City, Mexico
Email: eduardol@unam.mx
Received December 22, 2012; revised January 25, 2013; accepted February 18, 2013
Keywords: Economic Crises; Macroeconomic Indicators; Economic Growth; Misery Index
ABSTRACT
It has been widely accepted that in Mexico, the 2009 crisis has been the worst ever since The Great Depression (in the 1930’s) with the only argument being the abrupt fall in GDP. Our main conclusion is that the 1995 crisis was more severe due to its further negative effects in all the other economic and social variables. In order to prove this hypothesis, a comparative analysis (using macroeconomic and social variables) with the 1983 and 1995 crises is made.
1. Introduction
Let’s not pretend that things will change if we keep doing the same things.
A crisis can be a real blessing to any person, to any nation.
For all crises bring progress.
Creativity is born from anguish (...)
It’s in crisis that inventive is born, as well as discoveries, and big strategies.
Who overcomes crisis, overcomes himself, without getting overcome.
Who blames his failure to a crisis neglects his own talent, and is more respectful to problems than to solutions. Incompetence is the true crisis.
Albert Einstein [1].
During the last three decades, the Mexican economy could be characterized by its tendency to struggle with macroeconomic crises within a long phase of slow growth, which began in 1982.
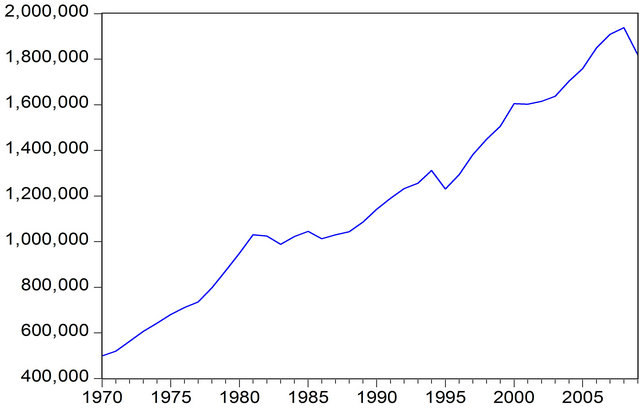
If we consider the time span 1970-2010, we observe that several recession and depression periods have occurred during this pace of stagnation. We will define here a recession as the consecutive years in which the GDP has no growth; and a depression by strong downfalls in output for specific years. In those terms, it can be stated that there have been two recessions: 1982-1988 and 2001- 2003; and four clear depressions: 1983 (−3.5%), 1986 (−3.1%), 1995 (−6.2) and 2009 (−6.1).
If we now analyze the GDP in per capita terms, the results are that the first recession turns into a long depression, which with its ups and downs, finally ends in 1997. No differences are observed for the second recession between the GDP and per capita GDP, See Figure 1.
Each of these recessions and depressions has had different causes and impacts. Due to the magnitude of the
 (a)
(a)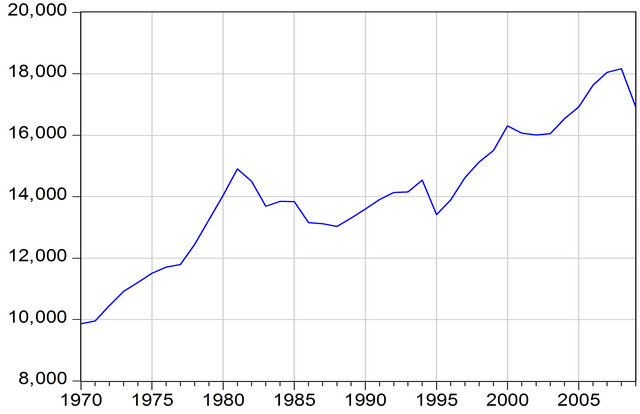 (b)
(b)
Figure 1. (a) GDP, (b) PER CAPITA GDP. Source: INEGI and Banco de México, several years.
two most recent depressions, it is our purpose here to make an analytic comparison in strict macroeconomic terms1 of the 1995 and 2009 crises, although we will also refer sometimes to the crisis of 1983 as a benchmark.
Without a rigorous analysis, the crisis of 2009 has been usually considered the most significant since the 1930s simply because of the decline in the GDP compared to that of the 1995 crisis which was slightly greater (−6.5 vs −6.2). Some other important have not been considered. It is worth mentioning that those figures prevailed for some time, and suddenly and discretely without any technical note or official broadcast they were changed reducing the 2009 slowdown figure to −6.1, and very recently (about 2012.II) to −5.99, INEGI [2]. Due to this fact and in the same terms of the general statements, it would result that the 2009 crisis was milder. Nevertheless, it is necessary to go into a deeper analysis of both crises in order to have a proper dimension of each one, and probably a different understanding.
By doing so, our main hypothesis is that the 1995 crisis was much more severe due to its negative impacts in more variables besides the GDP.
We have left out any theoretic approach regarding economic and financial crises, and the analysis of the origins of the financial collapse in the United States as well. We only focus on measuring and contrasting a set of macroeconomic and social variables for the years 1995 and 2009, and considering the people’s perception in explaining the magnitude of economic crises.
Next section presents some general features of economic crisis and a similarity between earthquakes and economic crises. This analysis allows us to consider measurement scales and sensations for traumatic events, and therefore helps us to have a different approach to the intensity of economic slumps. Section three presents a literature review of what has been said about the 2009 Mexican crisis. Section four, which is the essential part of the paper, analyzes crucial indicators that support our hypothesis. The last section presents the main conclusions and some prospective outlines.
2. Some (Heterodox) Considerations on Economic Crises
Economic crises are commonly or solely measured from the falls in GDP (usually in absolute and not in per capita terms) and exclude other variables (psychological) which are equally important or that can offset or amplify the measure the contractions in output. For that reason, in this section we present other macroeconomic variables which together with the evolution of the Mexican GDP, allows us to obtain a better picture of both the 1995 and 2009 crises.
2.1. The Origin of the Crisis
In order to suggest a measure that evaluates an economic crisis, it is convenient to differentiate its main origin. In simpler words, it can be said that there are some crisis which are basically but not solely, originated from internal disequilibrium and others by external shocks2.
In this sense, it is plausible to admit that the 1995 crisis was basically domestically originated since there were atypical monetary expansions and huge imbalances in the current account. It all indicates that as the M2 and M4 monetary aggregates grew noticeably since 1988 as a proportion of the GDP3. The current account deficit grew in the same manner and reached 7% of the GDP in 1994, see Figure 2. This then caused a macroeconomic crisis which started as a balance of payment crisis which was transmitted to the financial variables and consequently, to the real variables through huge devaluations, the rise in interest rates, inflation and unemployment.
The opposite occurred during 2008 in which both aggregates grew a little less than 10% despite the huge capital inflows. In 2009, notwithstanding speculation against the peso and the sharp reduction in the economic activity, the same variables grew in around 9%. It is worth mentioning that even though the international trade spectacularly declined, the current account balance in proportion to the GDP was in check: −0.82%.
In addition to the 1994 current account deficit mentioned above, several chaotic political events occurred in the domestic sphere as well as the rise in interest rates in the United States4. All this caused huge capital outflows that were transmitted to other macroeconomic and social variables. On the other hand, this crisis had international effects unknown until then, specifically by the fact that a small country like Mexico transmitted its crisis to the rest of the world; this was known as the “tequila effect”5.
Conversely, the 2009 crisis had an external origin which was due to the global financial crisis that rapidly was transmitted to domestic real variables6.
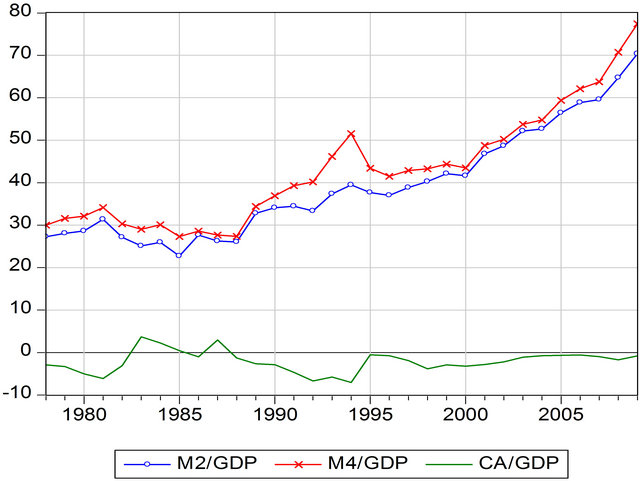
Figure 2. Mexico: Monetary aggregates and current account balance to GDP, 1978-2009.
2.2. Two Measurements of One Same Phenomenon
It is interesting to compare two events that are seemingly unrelated but nevertheless highly traumatizing in the life of human beings: economic crises and earthquakes. In order to evaluate them in the most objective way, both phenomena are measured and compared in conventionally (commonly accepted) units.
As mentioned before, the impact or magnitude of an economic crisis is usually defined by the severity in output reduction, and in some cases also by the rise in unemployment and price increase or decrease; while earthquakes are measured through two standardized scales which admit important degrees of variability.
To be able to make a plausible comparison, let’s begin by measuring earthquakes. There are two scales: Richter and Mercalli. The first one defines the magnitude of a local earthquake as the base 10 logarithm of maximum amplitude of the seismic wave. On the other hand, the Mercalli scale considers people’s sensation and the evident observable damage in buildings.
In any case, both scales try to quantify the same phenomenon that by its nature is absolutely traumatic. Yet the results may vary upon evaluating the same event, especially when comparing different earthquakes. For example, we take two tragic earthquakes in 2010 (Figure 3): In Haiti on January 12 and in Chile on February 27. Upon applying the two scales to both earthquakes, the results obtained are the opposite.
In effect, while the earthquake in Haiti was of a lower intensity in the “most objective measure” (Richter), it was higher in the “subjective” one (Mercalli). This divergence may be explained by the greater fragility of its buildings and all the development variables which lie behind.
The same can occur in economic crises. On the one hand, the official economic indicators (“actual ‘official’
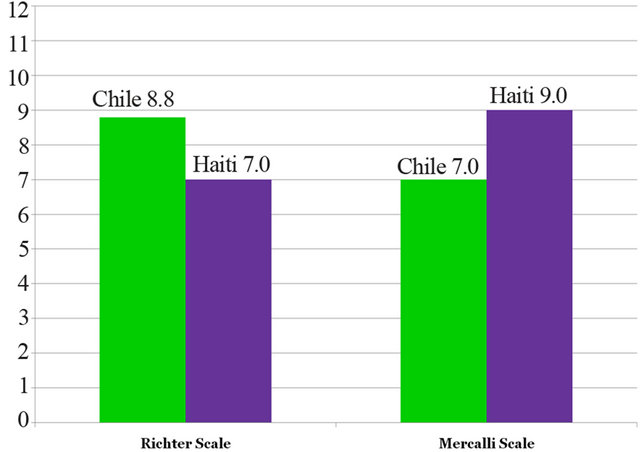
Figure 3. Two earthquakes in seismological terms. Source: Own elaboration based on data from El Universal [6,7].
figures”) try to measure them in an objective way, while the perception of economic agents may provide different and even contradictory dimensions, such as the case above. This seems to have happened in the 2009 Mexican crisis, which has been considered the worst since the 1930’s. Some factors that may support this hypothesis include: 1) the fact that it is recent and we have lost a bit of historic memory; 2) that only the GDP drop in absolute terms is considered (not per capita terms); this last crisis combined with other disastrous factors such as epidemics (influenza AH1N1) and relevant events in organized crime. All these facts combined created a highly pessimistic perception in the Mexican population.
In that sense, in addition to the actual affectation of macroeconomic variables, and in contrast with 1995, in the 2009 crisis there was a kind of undesirable combination of expectation (fear and uncertainty factor) as well as of tiredness crisis which resulted from the social disintegration and from the long pace in slow growth in the GDP and its multiple consequences in employment, wages and well being.
In spite of this important factor—which could be called “subjective data” and several of its implications, not very often considered—in the behavior of economic agents, our evaluation of the macroeconomic crisis in 1995 and 2009 shall be only based on actual (official) figures from the Mexican accounting statistical systems (INEGI and Banxico) and with own calculations derived from them.
3. Literature Review
It is interesting to find out that despite the huge impact of the 2009 Mexican economic crisis, no ex post academic literature is available that rigorously evaluates the macroeconomic and social impacts which scientifically proves it has been the worst crisis in recent history. The most we were able to find were several articles written in 2008 and 2009, presenting relevant data warning that a global crisis could have catastrophic consequences on the Mexican economy7. Several of these articles even positioned the GDP decline at (−)7.3%, greater than what it actually turned out to be at (−6.1% or even −5% - 99%). In all the articles examined, we found ample explanations of the origins that caused the mortgage crisis in the United States and then presented the transmitting mechanisms on the Mexican economy, which are not going to be treated here. A few of these emphasize on a certain specific sector, such as migration, remittances and in some cases, due to possible regional effects. The most relevant works are those of Cordera et al. [8], Alarcón et al. [9], Machinea [10], Pérez [11], Villlagómez [12], Esquivel [13], Núñez and de la Cruz [14], Reyes and Moslares [15], Rodríguez and Zurita [16], Zurita et al. [17], and Erquizio [18].
The work by Villagómez [12] includes a detailed and integral survey of the origins of the mortgage crisis in the United States and analyzes the timely transmitted mechanisms on the Mexican economy. Perhaps since it is the most recent, he was able to formulate a detailed chronological development of the crisis in Mexico as of 2008 and the economic policies applied, particularly in the different fiscal programs and monetary policies. However, we did not find one article that evaluates and compares the real impacts of the 2009 crises.
4. Actual Figures of Recent Crises
4.1. GDP, Private Consumption and Investment
As mentioned before, for some time INEGI made us believe that the contraction in the GDP was (–)6.5%, which was higher than that of 1995 (–6.2). Later on—there is no record of when it exactly happened—the same official source corrected the GDP figure to –6.1 and finally to –5.99, by which these two crises had had fairly the same intensity, regardless of other economic and social indicators.
In order for this to be carried out, let us begin by analyzing the evolution of the GDP, private consumption and investment in per capita terms between 1970 and 20098. It is worth mentioning that upon considering demographic growth, by measuring the crisis this way, the first indicator results to be lower than that of 1995 in almost 1 percentage point, See Figure 4.
Private consumption (Figure 5) and investment (Figure 6) per capita indicators are even more eloquent in the same sense.

Figure 4. Per capita GDP, 1970-2009. Source: Author’s elaboration with data from INEGI [2] and CONAPO [19].
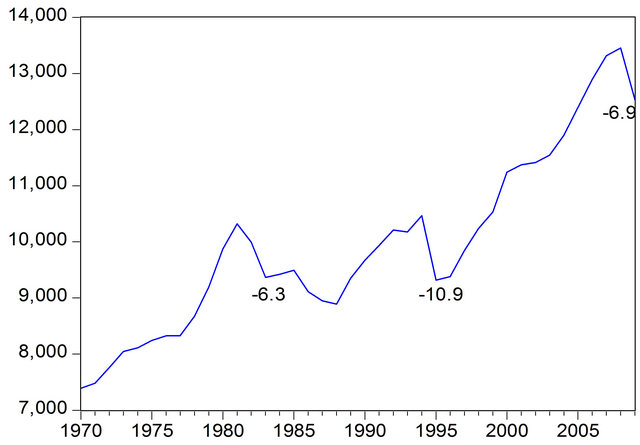
Figure 5. Per capita private consumption. Source: idem.
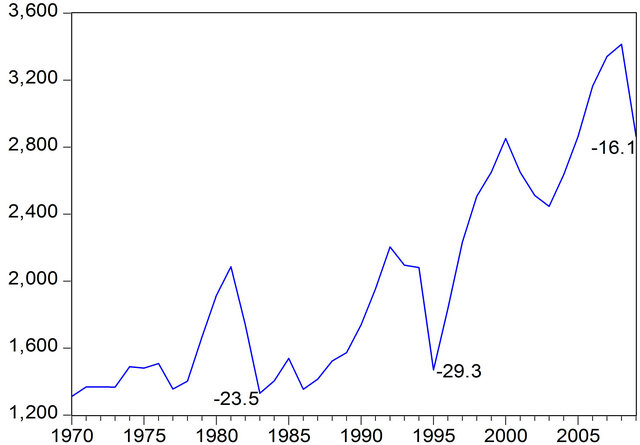
Figure 6. Per capita private investment. Source: idem.
4.2. External Sector
While the 1995 crisis in Mexico had primarily internal origins in an expansive international environment, the 2009 crisis was initially external, of a financial nature, that was rapidly transmitted globally to the real and trade variables in a generalized depression environment.
Figure 7 clearly shows the magnitude of the external shocks on the balance of payments in Mexico in 1995 and 2009. It is worth noting that in 2009 all components suffered a huge and generalized drop while in 1995 two indicators improved. In effect, while in 1995 oil exports income climbed 1.0183 billion dollars (bd) with respect to 1994, in 2009 they fell 19.7524 bd (–39.0%) regarding the previous year; and while in 1995 remittances rose 198 bd (5.7%), in 2009 they fell 3.9562 bd, that is –15.7%.
Summing up, external factors altogether indicate that in 2009 the fall in external income was 37.4752 bd compared to 415 million dollars in 1995, which represented 4.3% in terms of the GDP in 2009 compared to 0.14% in 1995, a 30 times difference in terms of the GDP.
Therefore, the larger proportion of the GDP drop in 2009 was caused by external shocks (4.3%), which suggests against what many analysts have stated that the domestic demand did not multiply the impact of the imported crisis. Thus, it is plausible to argue that the traumatic internal events already referred to as the influenza AH1N1 epidemic9 (April-May 2009 that paralyzed the economic activity for almost two weeks) and flourishing crime in the country, contributed to the economic agents magnifying their sensitivity on this crisis in relation to the prior ones.
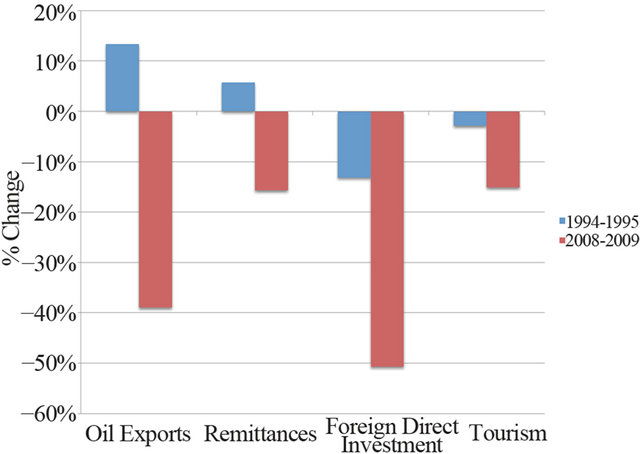
Figure 7. The external shocks. Source: Banco de México [20].
4.3. The Labor Market
It cannot be disregarded that during 2009, as well as in the aftermath the Mexican labor market was rapidly affected, which may also contributed to this perception. In this sense, the population who earn up to three minimum wages almost increased in two million between 2008.III and 2009.III, see Table 1.
Since there is no available data for other important variables previous to 2005 of the National Survey of Occupation and Employment (ENOE), it is impossible to make further comparisons between 1995 and 2009. Nevertheless, we can present the evolution of three crucial variables of the Mexican labor market by age groups in favor of our main hypothesis.
Before 1995 and between 2003.I and 2008.IV, total unemployment rate averaged 3.7%. As a consequence of the great recession (2009) it notably increased and since then it averaged 5.4%, gaining its highest level in 2009.III at 6.27%. In contrast to the rapid reduction after 1996, it maintains a high level after 2009, see Figure 8.
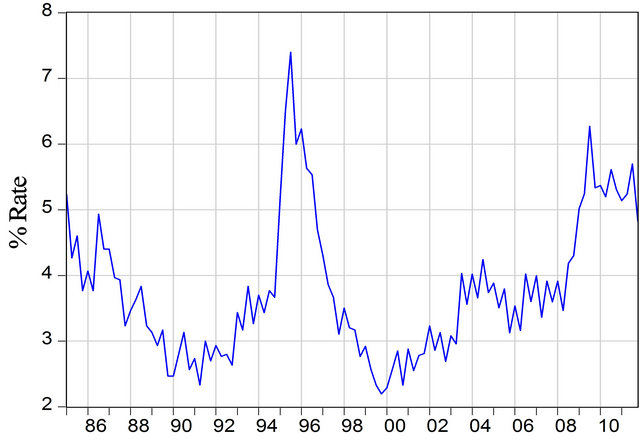
Figure 8. Mexico: total unemployment rate 1985.I-2011.IV.
Table 1. Precarious income (less than 3 minimum wages).

Source: ENOE [21].
Now, if we separate this gross rate into age groups (see Figure 9), we can observe that youth unemployment (14 - 24 years old) has been always and higher volatility as well.
In Figure 9, it is easy to see several important stylized facts. Firstly, the three kind of unemployment have risen in time. Secondly, the traditional gap between youth and the rest has not been reduced. Thirdly, the great recession has had a raising effect on the three types of unemployment.
Figures 10 and 11 show crucial facts that suggest that structural changes have taken place in the labor market after 2009, such as the positive trend in informality and discouraged workers after 2008.III when the great recession hit the Mexican economy.
In sum, all the precedent data regarding labor markets
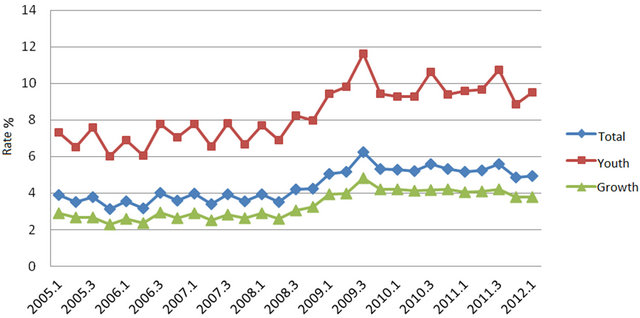
Figure 9. Mexico: Rate of unemployment. Quarterly data. Source: own calculations based on ENOE [21].
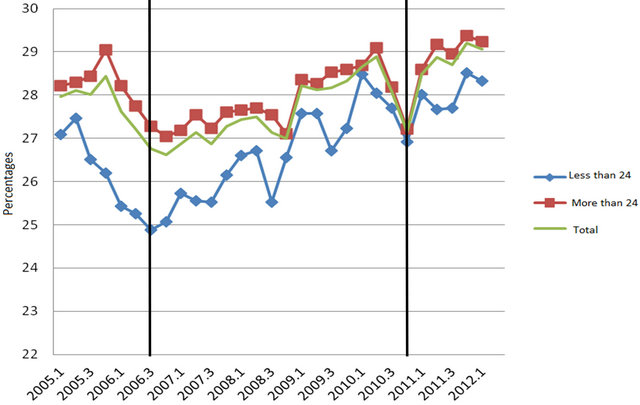
Figure 10. Informal employment by age group. Source: ibid.
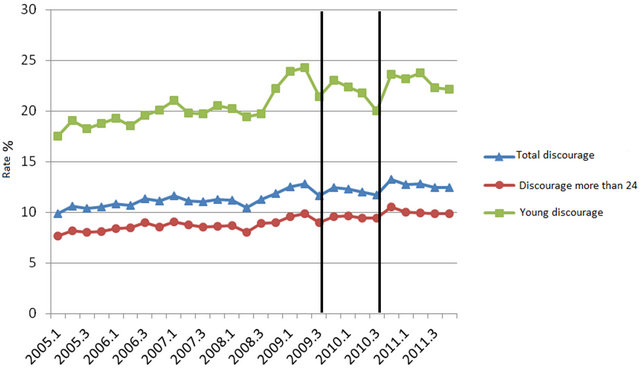
Figure 11. Discouraged by age group. Source: ibid.
demonstrate that the labor market has deteriorated seriously after 2009; which probably has to do with the perception that this last crisis had stronger damages on the society.
4.4. Financial Aspects
A key factor in the origin and repercussions in a crisis has to do with the financial sector and its impact on individual’s patrimony.
Leverage (Figure 12) is an important indicator which can represent the difference between these two crises, and therefore, the loss of real (patrimony) and financial wealth from companies and individuals.
This index in 1994-1995 practically doubled, while in 2008-2009 the increase was marginal, thus the patrimonial effects were substantially lower.
We shall argue that after 1995 private credit had a systematical decrease which caused a reduction in the probability of incurring in bankruptcy afterwards. Accordingly, in 1995, the proportion of bank financing the GDP (Figure 13) was 55.5%, and 21% in 2008. In order to evaluate the efficiency of private credit we should refer these figures to the GDP growth. Thus, in 1994 the economy grew by 4.5% with that private financing, while in 2008 only by 1.5%10.
Total public expenditure had different evolutions in both crises. While in 1995 it had an abrupt fall, in 2008 and 2009 it had a significant growth, in spite of the criticism by many analysts that the government applied a pro-cyclical fiscal policy11. In effect, current (consumption) and capital public expenditure decreased during 1995 by 21.7% and 29.2% respectively, while for 2009
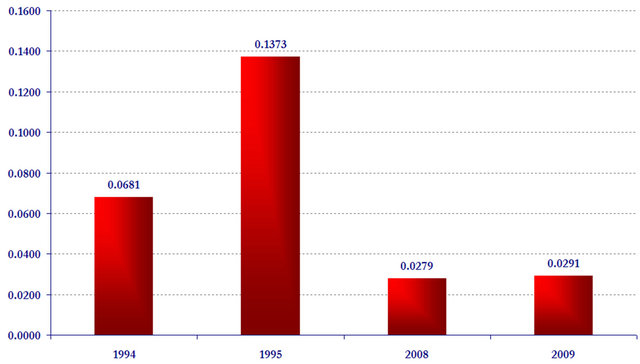
Figure 12. Leverage index. Source: Own calculations based on SHCP [22].
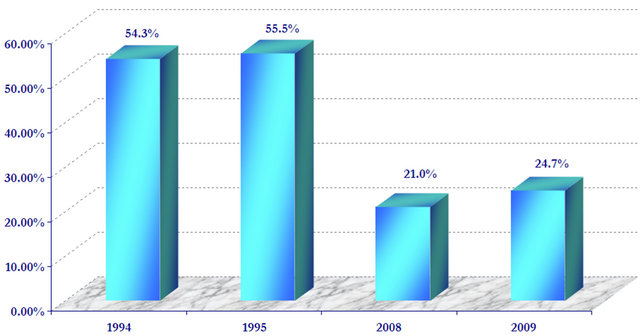
Figure 13. Private banking financing. Source: ibid.
its variation was positive by 5.2% and 10.5%, respectively12. In this respect Villagómez and Navarro [23] claimed that the Mexican government implemented a counter-cyclical fiscal policy since the beginning of 2008. Through the use of a VAR model they estimated the positive impact of the expansionary fiscal policy on employment.
|
12Own calculation based on SHCP [22]. |

Another interesting feature to be highlighted is the impact of the crisis in fiscal income, which in 1995 fell 16.1%, while in 2009 rose in 5.9%, despite the fiscal revenue reduction due to the decrease in oil exports (See Figure 14).
Another fiscal aspect worth mentioning is that, although foreign debt increased due to the surge of emerging debt lines to the IMF to stabilize the exchange ratevolatility during the second half of 2009, total public debt or the extended debt remained at historical levels and never compromised the payment structure in the short run (see Figure 15). The ex post analysis lead us to acknowledge that the fiscal rule has been instrumental in achieving balanced federal budgets and reducing public indebtedness. Villagómez [12] describes that in 2009 the Congress relaxed the fiscal rule of cero deficit and accepted a fiscal deficit of 1.8% of GDP.
4.5. Social Indicators
Economic crises have huge and permanent effects in the quality of life for its inhabitants that go beyond monetary, economic and fiscal indicators.
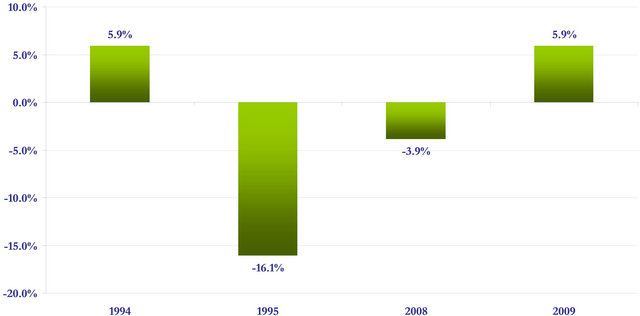
Figure 14. Fiscal revenue, 1990-2009 (% Change). Source: ibid.
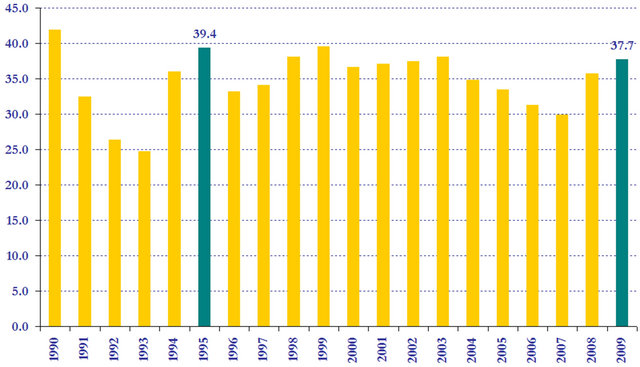
Figure 15. Total public debt, percentage of GDP, 1990-2009. Source: ibid.
In the following, we present the variables which allow measuring the social effects that are derived from both crises directly or indirectly.
4.5.1. Human Development Index
The Human Development Index (HDI) built here (Figure 16) follows the UNDP methodology, and is composed by three sub-indexes: 1) the Health Index, mainly determined by life expectancy; 2) The Education Index refers to literacy and enrollment in the national education system, and 3) Per capita income index.
The HDI, being a long term variable, does not allow capturing accurately the variations from one year to the next, with the exception of the third indicator which is the one that varies the most in 1995 and 2009. In terms of this sub-index, the variations were less in 2009 compared to 1995: −0.4 and −2.9, respectively. Either way, we have to insist that it is still too soon to consider the HDI as an accurate indicator of the social effects in most recent crisis, since there are important lagged effects.
4.5.2. Growth and Unemployment
Revealing figures come into view upon comparing the GDP and unemployment from three different crises. For example, while in the 1983 crisis the GDP decreased (−)3.5%, unemployment reached its maximum historical level (6.8%)13. This results in an elasticity of −17.76, against −10.97 and −6.31 for the crisis of 1983, 1995 and 2009, respectively, see Table 2. This outcome suggests that pass through effects from the economic crises to unemployment has reduced noticeably.
4.5.3. Inflation and Real Wages
While in 1995 inflation (CPI) rose to 52%, it was only 3.6% in 2009 (Figure 17). This outcome has to do with the smaller exchange rate depreciation (21% vs 92%) and with the inflation-targeting framework that has been successful in anchoring price expectations. Therefore, the fall in real middle wages was the lowest (−9%) compared to 1983 (−23%) and 1995 (−25%), INEGI (several years).
Another important composite indicator is the Misery Index (Figure 18), which shows that the figure of 2009 has nothing to do with prior crises.
5. Conclusion and Further Comments
This analytical essay compares two crises14 in recent Mexican history which has allowed dimensioning its effects on major macroeconomic and social variables. We are still far from having a clear comprehension of the long run effects on other variables such as poverty, crime and human behavior, or of possible connections these variables may have had in relation to each other.
Since this is not a theoretical article, it was not of the
Table 2. GDP, unemployment and elasticities.
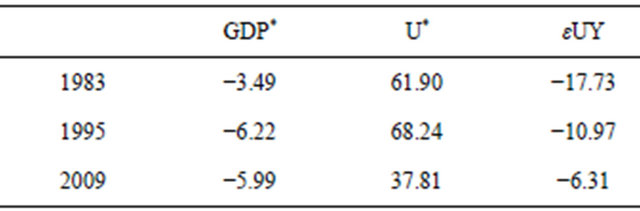
Note: *Annual growth rate.
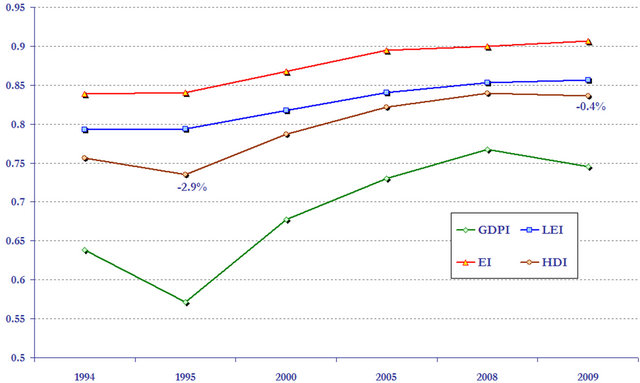
Figure 16. Human development index (HDI). Source: Own construction and calculation based on the UNDP methodology, and with data from: INEGI [24] and Calderón [25].
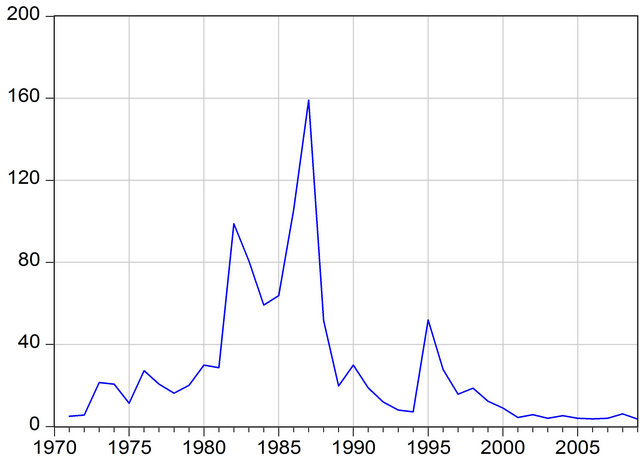
Figure 17. Inflation (CPI annual growth). Source: INEGI [24] and Banco de México [20].
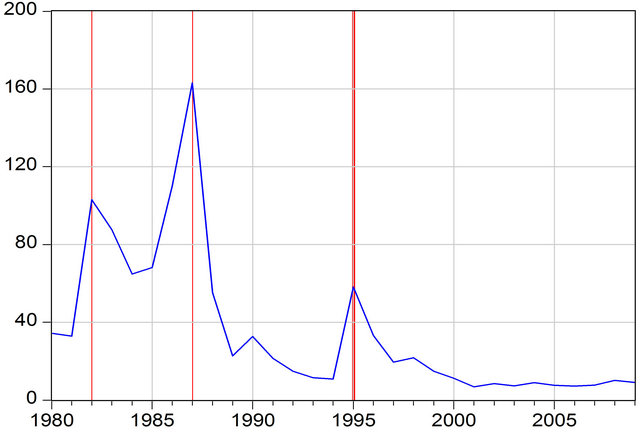
Figure 18. Misery index (inflation + unemployment). Source: Own construction and calculation based on: INEGI [24].
interest to contrast a theoretical framework about financial or economic crises. We have not analyzed growth models nor examined the crises of 1983, 1986 and 1995 to scrutinize if they were connected or had something to do with that of 2009. Although it would be necessary, it completely surpasses the purpose of this work. We only tried to measure the combined effects of two main economic crises: 1995 and 2009 in Mexico, regarding macroeconomic variables and stressing that the perception of the people has to do in the evaluation of the outcome.
It has been proven that the crisis of 2009 has not been the most severe in recent Mexican history (1970-2009) according to a series of macroeconomic and social variables here analyzed.
In effect, we analyzed several macroeconomic and social indicators (in absolute and in per capita terms) and these all show lower affectations compared with prior crises in 1983 and 1995.
We found that the increase in unemployment was minor compared to previous crises as well as the Misery Index. The Human Development Index, which is another composite and world-wide accepted index, shows a lower affectation as well.
Nevertheless, the fact that unemployment is not higher than before and that the per capita income fell less than in 1995, has to be carefully considered since it appears that there have been important changes in the labor markets which have seriously affected quality and remunerations of workers with lower incomes, especially concerning women in the informal market where there was a significant increase.
Therefore, although the indicators we analyzed cannot acknowledge the crisis of 2009 as being the most severe in recent history, we cannot deny that in previous years the increase in precarious labor and the vast emigration registered by the country can account for the reduction in the elasticity of unemployment to output. The above can be proven with the following figures. According to the INEGI [27], there are more than 12.8 million in the informal labor force, if we also add the workers who do not have access to health services, this figure then reaches 30 million (Flores [28] and Robles [29]), which is around 60% of the Economic Active Population.
Unfortunately, on this issue we cannot make a comparison of these figures with those of previous crises since only official figures are available as of 2000 or 2005. Nonetheless, official figures of that decade, as well as what can be perceived from the common citizen, is a rapid growth in informality, discourage and in underemployment in the Mexican labor markets, which contributes to the impression that the 2009 crises has been the worst ever.
Although crises are caused by several factors, it can be fairly argued that the crisis of 1995 was originated domestically, which among many factors were the result of: 1) excessive growth of monetary aggregates that generated huge imbalances in the current account; 2) huge disturbances in the social and political context, and 3) the change of president and the economic cabinet. All these factors resulted in a crisis of unknown proportions until then.
On the other hand, the 2009 crisis essentially had external origins, and we cannot argue that in general terms the fiscal policy was in effect pro-cyclical. Only value added and income tax was of an internal derivation in this case, and both the fiscal deficit as well as the public debt did not increase as it occurred in the developed world. Likewise, public expenditure was not affected in 2009, unlike that of 1995.
The magnitude of the external shock in 2009 (of −4.3% in terms of GDP) was around 30 times higher than that of 1995 (−0.14%) which is an important element to be considered but is usually ignored. In this respect, the damage to macroeconomic and patrimonial variables was much lower this time than in 1995.
We have to acknowledge that the low current account deficit15 lowered foreign financial need, the built-up of foreign reserves and the swap with the US government and the IMF’s Flexible Credit Line, provided cushion to external shocks. All this made possible that the exchange rate depreciation were lower than 1995 and so were the impacts to interest rates and prices.
It is worth mentioning that although we have shown with “actual figures” that the crises that occurred before 2009 were more intense, it seems that the general consensus is the opposite. In order to make comparisons, we used two different earthquake measurement scales: the Mercalli and Richter. Both measure the same phenomenon but may generate different results. In this way, we tried to analyze the population’s sensitivity to the 2009 crisis (Mercalli scale) and here is where it seems more devastating than that of 1995. As a hypothesis, this may be explained since it is more recent and generally, historic memory has been somewhat lost. Another factor that possibly influenced—maybe even more—in this direction has to do with the context of increased social unrest caused by: fatigue along with pessimism derived from a prolonged phase of slow growth and an increase in job precariousness, diminished expectations, and rise in crime. All these factors combined have caused confusion and fear in the population.
The NAFTA operation and the soaring phase of worldwide growth during the 1990s allowed an impressive recovery from the 1995 crisis until the year 2000, and then in 2001-2003 the Mexican economy went through a productive stagnation.
The current international context is especially different due to huge real and financial weakness in the United States, and therefore a high probability that the developed world will go through a long phase of slow growth along with high volatility in exchange rates, and this could severely affect world trade. Therefore, it is highly possible that the Mexican recovery for the following years will be a slow and erratic one, and will heavily depend on the capacity of the United States’ economic recovery. Nevertheless, we have proven that the domestic demand reacted positively in 2009, showing that it is an important growth factor that cannot be disregarded.
There is still much to learn from economic crises and their aftermath.
6. Acknowledgements
This article is part of the research project Recession and the labor market in Mexico: A structural analysis 1985- 2020 (IN3052011), DGAPA, UNAM.
REFERENCES
- A. Einstein, “Ideas and Opinions, Based on Mein Weltbild,” Carl Seelig, Bonzana Books, New York, 1954.
- INEGI, 2012. http://www.inegi.org.mx/sistemas/bie/cuadrosestadisticos/GeneraCuadro.aspx?s=est&nc=782&esq=BIEPUB&c=24400
- N. Lustig, “Mexico: The Remaking of an Economy,” 2nd Edition, Brookings Institution, Washington DC, 1998.
- Banco de México, “The Mexican Economy. Economic and Financial Development in 1994. Policies for 1995,” Banco de Mexico, 1995.
- S. Edwards, “Crises and Growth. A Latin American Perspective,” NBER, Working Paper 13019, Cambridge Ma, 2007.
- AP, “Terremoto en Chile: Sismo de 8.8 Grados Sacude Chile,” El Universal, México, 2010.
- AP and NTX, “Sismo de 7.0 Sacude Costas de Haití,” El Universal, México, 2010.
- R. Cordera, C. Heredia and J. Navarrete, “México Frente a la Crisis: Hacia un Nuevo Curso de Desarrollo,” Economía UNAM, Vol. 6, No. 8, 2009.
- R. Alarcón, R. Cruz, A. Díaz-Bautista, G. González-Kö- nig, A. Izquierdo, G. Yrizar and R. Zenteno, “Una Nota Crítica, Colegio de la Frontera Norte,” 2008.
- J. L. Machinea, “La Crisis Financiera Internacional: Su Naturaleza y Los Desafíos de Política Económica,” Revista de la CEPAL, # 97, abril, 2009.
- P. Pérez, “Efectos Esperados de la Crisis Económica Actual en Las Remesas en México,” Revista Perspectivas Sociales, Vol. 12, No. 1, 2010.
- A. Villagómez, “La Primera Gran Crisis Mundial del Siglo XXI,” Tusquets Editores, México, 2011.
- G. Esquivel, “Mexico: Large, Immediate Negative Impact and Weak Medium Term Growth Prospects,” In: M. Nabli, Ed., The Great Recession and Developing Countries: Economic Impact and Growth Prospects, The World Bank, 2010.
- J. Núñez and J. L. de la Cruz, “Crisis Hipotecaria: Posibles Causas y Consecuencias,” In: Reyes and Morales, Eds., 2011.
- G. Reyes and C. Moslares, “México en Recesión,” In: Reyes P. and M. Morales, Eds., 2011.
- J. Rodríguez and J. Zurita, “A un año de la Profundización de la Crisis Financiera Internacional, Impacto, Respuestas y Expectativas,” Análisis Económico, Vol. XXIV, No. 57, 2009.
- J. Zurita, F. Rodríguez and J. Martínez, “La Crisis Financiera y Económica del 2008. Origen y Consecuencias en los Estados Unidos y México,” El Cotidiano, Vol. 24, No. 157, 2009.
- A. Erquizio, “La Gran Recesión de EUA y de México 2008-2009 y sus Efectos Regionales,” In: P. Mejía and M. Morales, Eds., 2011.
- CONAPO, 2012. http://www.conapo.gob.mx/00cifras/00indicadores/00.xls
- Banco de México, “Financiamiento e Información Financiera de Intermediarios Financieros.” http://www.banxico.org.mx/sistema-financiero/estadisticas/intermediacion-financiera/financiamiento-informacion-fi.html
- Encuesta Nacional de Ocupación y Empleo, ENOE, “Estadísticas del Mercado Laboral-Encuestas-Encuesta Nacional de Ocupación y Empleo (ENOE), Indicadores Trimestrales,” 2010. http://www.empleo.gob.mx/wb/BANEM/BANE_enoe_trim
- SHCP, “Secretaría de Hacienda y Crédito Público, Informe Trimestral Sobre la Situación Económica, las Finanzas Públicas y la Deuda Pública,” 2010. http://www.shcp.gob.mx/POLITICAFINANCIERA/FINANZASPUBLICAS/ITSSEFPDP/Paginas/2010.aspx
- A. Villagómez and L. Navarro, “Política Fiscal Contracíclica en México Durante la Crisis Reciente: Un Análisis Preliminar,” Documento de Trabajo 475, CIDE. México, 2010.
- INEGI, “Sistema de Cuentas Nacionales de México,” 2012. http://www.inegi.org.mx/inegi/default.aspx?s=est&c=125
- F. Calderón, “Tercer Informe de Gobierno,” 2009. http://www.informe.gob.mx/informe/ 2009
- INEGI Estadísticas Históricas de México, Tomo I, 2009, p. 314.
- INEGI, 2012. http://www.inegi.org.mx/sistemas/tabuladosbasicos/tabtema.aspx?s=est&c=28822
- Z. Flores, “Es la Variable Más Inquieta; Persiste Precarización de Empleo,” El Financiero, México, 2010.
- A. Robles, “Empleo Informal en su Máximo Nivel,” El Financiero, México, 2010.
NOTES
1This means that regional and sectoral aspects will be left out of the analysis.
2Traditionally, until the 2009 crisis, it had been hard to attribute the origin of a macroeconomic crisis to only one factor, whether internal or external. In any case, it used to be more adequate to assign triggering factors that together with existing imbalances ultimately precipitated a crisis. But the 2009 crisis changed the way of understanding the origins of an economic crisis since it affected negatively all countries regardless of keeping in line macroeconomic fundamentals. This was the case of Mexico.
3It can be stated that as of 1988, when remonetization of the economy started just after the long stagflation of the eighties it was natural that both monetary aggregates once again began to increase. Nevertheless, it is worth noting that the growth of those monetary coefficients was spectacular: in real terms between 1993 and 1994, M2/GDP grew almost 20% while M4/GDP did it in almost 30%.
4For further details see Lustig [3] and Banco de Mexico [4].
5Edwards [5] claims that “The Mexican crisis generated a wave of ‘contagion’ through the region (…) Capital flows into Latin America declined, and the cost of borrowing internationally (…) increased significantly. Argentina (…) was particularly affected by what came to be known as the ‘tequila effect’.”
6We show the magnitude of foreign shocks in Section 4.2.
7Possibly the only exception is the most recent analysis by Villagómez [12].
8Upon normalizing the macroeconomic variables by population (which gives per capita magnitudes), it is implicitly assumed that the impacts distribute homogeneously, when it is mostly probably not. Nevertheless, we consider here that it is a more precise measure of an economic crisis.

9According to Villagómez [12] its economic impact was about 0.334% of the 2009 GDP value.

10The reasons for this difference in credit efficiency surpass the objective of the present work.
11This argument is based on the fact that in 2009 the Secretaría de Hacienda (The Department of the Treasury) increased value added tax from 15% to 16% as well as the income tax from 28% to 30%, mainly justified by the hypothesis that the price decrease in oil income was permanent.

13Official quarterly unemployment series (INEGI) begin in 1985. Nevertheless, we found an annual historical time series in INEGI [26] starting in 1980.
14Although sometimes we also compared the 1983 crisis as a benchmark.
15The current account deficits to GDP were of 1.72% and 0.82% for 2008 and 2009, respectively.