Journal of Biophysical Chemistry
Vol.3 No.3(2012), Article ID:21940,6 pages DOI:10.4236/jbpc.2012.33026
The low frequency electromagnetic field on the rat EEG
![]()
Physics Department, Faculty of Science, Benha University, Benha, Egypt; drsmsallam@yahoo.com
Received 2 August 2011; revised 20 February 2012; accepted 22 March 2012
Keywords: Component; Formatting; Style; Styling
ABSTRACT
The aim of the present study was to find out the effects of low frequency electromagnetic field (EMF) 50 Hz - 10 mT on the rat electroencephalogram (EEG) recorded from the rat brain cortex and from the skull surface. The rats were, whole body, exposed to this EMF intensity one hour daily for 7 days. Recovery study was done after one week from stopping the EMF exposure. The effects of the filed were estimated by compression of the averaged EEG frequency spectra in the range of frequencies between 0.2 - 0.7 Hz and by comparison of amplitude of EEG waves in control, exposed to EMF and recovery animals. Statistically significant effects of EMF were observed both in EEG amplitude and power reduction at most EEG frequencies. Also, noticeable variations were observed in normal values of maximum amplitude and number of successive EEG epochs recorded from brain and skull surfaces after exposure to ELF magnetic fields. These results show that a weak low EMF can influence the spontaneous electrical rat brain activity in the animals subjected to the EMF.
1. INTRODUCTION
(Extremely) The low frequency electromagnetic field (EMF) covers the frequency range of 3 Hz to 3 KHz, but the most intensely studied frequency is the power frequency of  Hz because electric appliances and power liens emit
  Hz EMF [1].
In modern society humans are commonly exposed to (EMF) including extremely low frequency magnetic field (ELF-MF), which is produced by power lines and many kinds of electric appliances [2]. One of the mostly discussed contemporary problems is if ELF-MF can affect biological systems, because the cell membrane contains many mechanisms and any change of one will refer to variation of cell function [3].
By affecting the cell membrane, ELF-MF can induce biochemical changes, which are the result of altered membrane potential, and consequently perturbed function of the trans-membrane ionic transfer with modified cell activities [4].
Electroencephalogram (EEG), which is brain function, represents the electric activity of brain cells. Its recordings have helped clinician for decades to diagnose specific diseases of the central nervous system. Recently, a technique was used by Mehrdad Fatourechi et al. 2007 [5] to determine the variation in EEG activity produced by MF using brain-computer interface, which can be obtained by extracting information about user’s from signals originating in the central nervous system.
The development of recording and analysis techniques has substantially increased the quality of the EEG recording, such as an advanced technique, named highresolution EEG (HREEG) [6-8]. The aim of HREEG is to provide standard and tested algorithms that help the experimenter to infer the nature of cerebral activity from the measured scalp potentials, which is introduced when ionic currents cross low conductivity structures (i.e., the skull).
Small changes in membrane potential induced by ELFMF can be of special interest in the signaling processes in brain [9]. Experimental and theoretical data obtained by Lednev et al. 1996 [10], indicated that weak magnetic fields influence biosystems via interaction with the Ca2+- signaling system in the cells.
In these studies, the effects of extremely low frequency magnetic field and tuned to the resonance conditions for Ca2+-ions, on the electroencephalogram (EEG) was carried out on the normal (non-treated), treated and recovery after 7 days from stopping exposure by 10 mT magnetic field. Lednev et al. 1996 [11], found that the ELF-MF significantly affects the EEG amplitude and frequency spectrum for brain and skull of rats.
In the present study we examined the effects of 50 Hz- 10 mT electromagnetic filed (EMF) on the electroencephalogram (EEG) activity in rats.
2. MATERIALS AND METHODS
2.1. Animals
The experiments were carried out on a total of 18 adult albino rats weighing 120 g on average that were divided into 3 groups (control group was not exposed and the other two groups were exposed to the MF, one of them used immediately after exposure and the other group used one week later for recovery study).
The rats were purchased from the holding company for biological products and vaccine, Cairo, Egypt and complied with legal requirements and institutional guidelines. The rats were housed individually in plastic boxes kept in a shielded chamber to reduce the normal ambient environmental electric field under similar conditions of temperature, illumination, acoustic noise and ventilation and received the same diet during the course of experiments.
2.2. Magnetic Field Exposure
An electromagnet (EM) constructed in the Department of Physics; Faculty of Science, Benha University was used as the MF generator. The method used for exposure was followed as that adopted by Watanabe et al. 1997 [12]. The cylinder bore of the electromagnet (EM) was 200 mm in diameter. A uniform magnetic field was produced over a 200 mm diameter area around the center of the bore. Three animal cages (groups), each one contained six rats were prepared. First group was placed in the center of the bore of the EM and exposed to 10 mT intensity MF for one hour daily over one week, thereafter used for measurements. The same procedures of exposure were carried out on a second group which is used for recovery study one week later after exposure. The temperature inside the irradiation chamber was periodically measured through the use of a thermocouple thermometer, which can give readings for the temperature variations within ±0.3˚C. The third group was placed in another cylinder placed in the same temperature-controlled room for use as a control free of magnetic effects.
2.3. EEG Measurements
The rats were anesthetized by subcutaneous injection with pentobarbital 40 mg/kg and the vital condition of the anesthetized rats was monitored by its normal breathing. Under anesthesia, the skin of the head was cut and the skull was cleaned from the connective tissues, and then washed with Ringer solution. Non-polarizable wick Ag-AgCl electrodes were used (see Figure 1(a)). For skull experiments, one electrode (active electrode) was placed on the skull at frontal right hemisphere and another electrode (reference electrode) on occipital of left hemisphere. The two electrodes were isolated electrically from each other. For cortical surface experiments, two trephine openings (3 mm in diameter) were made in the skull to expose the cortical surface (see Figure 1(b)) with great care during removing the butted pieces of bone. The trephine opening on the right hemisphere was used for EEG recording (rec) and that on the left hemisphere for the reference electrode (ref) as shown in Figure 1(b).
The electrodes were gently introduced inside the openings to avoid any mechanical stress or damage to the cortical surface and Ringer saline solution at room temperature of 22˚C was used for washing the cortical surface from time to time to protect it from drying.
The EEG recordings in experimental session began after 5 - 10 min period of adaptation and EEG recording lasted five min. The frequency spectra of 10 s successive EEG epochs in the range of 0.2 - 0.7 Hz, were analyzed “on-line” on an compatible personal computer. Each epoch was digitized with a multichannel with PASO series 6500 interface system converter using a sampling rate of 64 Hz and therefore resulting in 2400 sampling points. The modified version of period-amplitude analysis described by Stigsby et al. 1973 [13] was used.
Both the integrated power in nine selected frequency bands with center frequencies; 0.25, 0.27, 0.29, 0.32, 0.38, 0.42, 0.47, 0.53, 0.61 Hz, and the ratio of power in each band to the sum power of all bands were calculated. Also the mean maximum amplitude of each band was calculated during interval time from 10 - 300 sec. The raw 10 s EEG power spectra (for skull and brain) were averaged for every successive 300 sec periods for control, exposure, and recovery conditions.
3. RESULTS
The ratio of power in each band to the sum power of all bands of EEG (∆N%) and the mean maximum amplitude of each band were calculated from our data (in control, exposed and recovery animals) according to method adopted by Mehrdad Fatourechi et al. 2007 [5].
 (a) (b)
Figure 1. Schematic drawings for (a) construction of non polarizable wick Ag-AgCl electrodes and (b) the trephine openings on the rat skull.
3.1. Power Bands of EEG
3.1.1. Skull EEG Spectra
Figure 2 shows the variation of the EEG frequency band power (∆N%) with the mean center frequency (cf) recorded from the rat skull surface.
In EEG spectra of control rat skull, a significant increase of power was observed in bands with central frequencies 0.32 and 0.47 Hz (Figure 2(a)).
In EEG spectra of rats exposed to the EMF the increase in power was observed at bands with center frequencies 0.25 and 0.32 Hz (Figure 2(b)). In recovery experiments, after one week from stopping the field exposure, the EEG spectra showed an increase in power at center frequencies 0.38, 0.42 and 0.44 Hz (Figure 2(c)) and the lower level of the power is approximately the same as that of control value.
3.1.2. Cortical EEG Spectra
The power(∆N%) of EEGs bands of control, exposure and recovery of rats brain were calculated and represented with center frequency as shown in Figure 3.
The control power of the EEG spectra showed significant increase at bands with center frequencies 0.32 and 0.36 Hz and lower power at 0.17 and 0.33 Hz (Figure 3(a)). The EEG spectra of rats exposed to EMF showed a significant increase in power at bands with center frequencies 0.36, 0.42 and 0.44 Hz and its lower power at 0.41, 0.43, 0.44 and 0.46 Hz (Figure 3(b)). The results of recovery experiments indicated an increase of power in
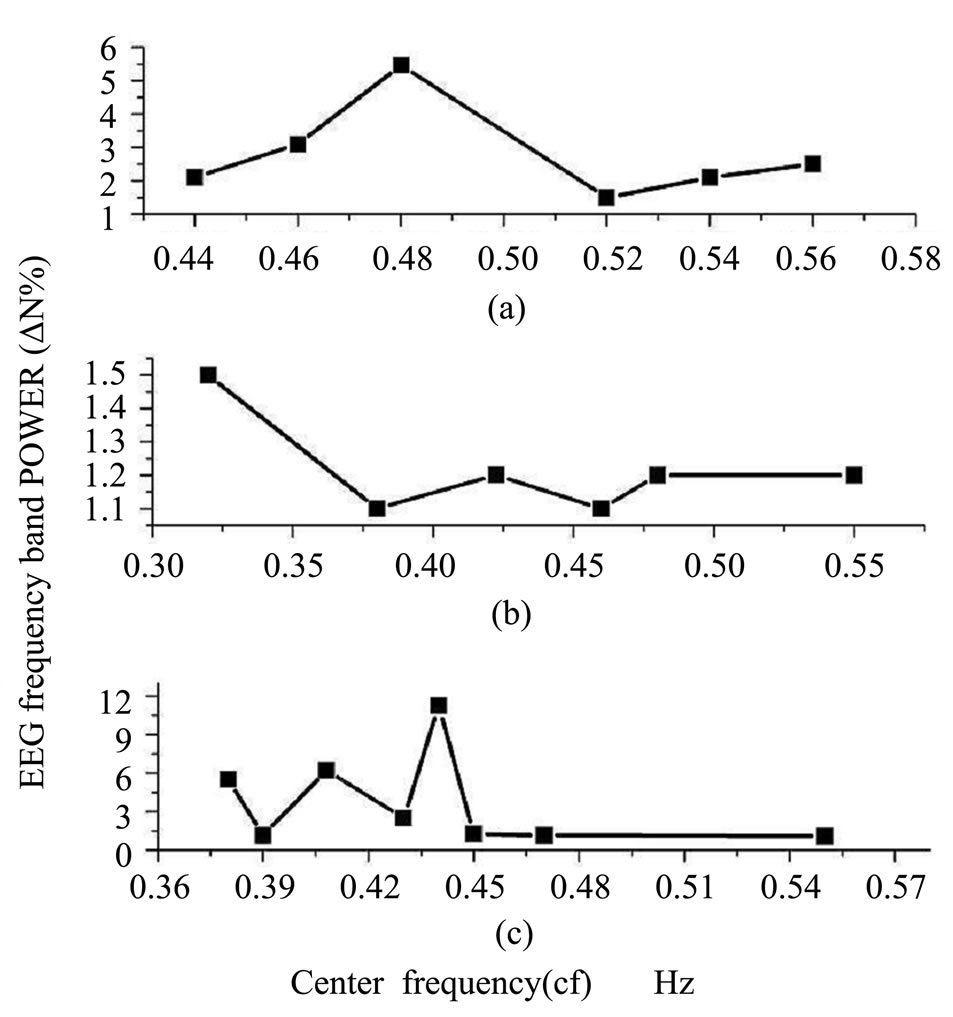
Figure 2. Rat skull: Variation of EEG power frequency band ∆N% with center frequency (cf), (a) control; (b) exposed to 10 mT, EMF; and (c) after one week from stopping exposure.
bands at center frequencies 0.37, 0.42 and 0.52 Hz and its lower power at 0.39 and 0.49 Hz (Figure 3(c)).
3.2. EEG Amplitude
3.2.1. Signals Recorded from the Skull Surface
Figure 4 show the variation of mean amplitude for all EEG epochs recorded during 300 sec from the skull surface. In control experiments, the mean amplitude for all responses varied from 70 - 150 mV (Figure 4(a)). In comparison with the control amplitude, it was observed a significant decrease in magnitude and reversing polarity of amplitudes (−75 to −30 mV) recorded from animals exposed to EMF (Figure 4(b)).
The values of amplitudes recovered their control values approximately after 7 days from stopping the field exposure (Figure 4(c)).
3.2.2. Signals Recorded from the Brain Surface
Typical compound amplitude variations with time for signals recorded from the brain cortex are shown in Figure 5. The mean maximum amplitude for all responses varied from –75 mV to –57 mV for control (Figure 5(a)), from 50 mV to 150 mV for exposed brain (Figure 5(b)) and from –7.5 mV to –2 mV for recovered brain (Figure 5(c)).
The results summarized in Figure 5 demonstrate significant increase in the maximum amplitude after brain exposure to EMF, while a decrease in the amplitude was observed in recovery responses, after one week from
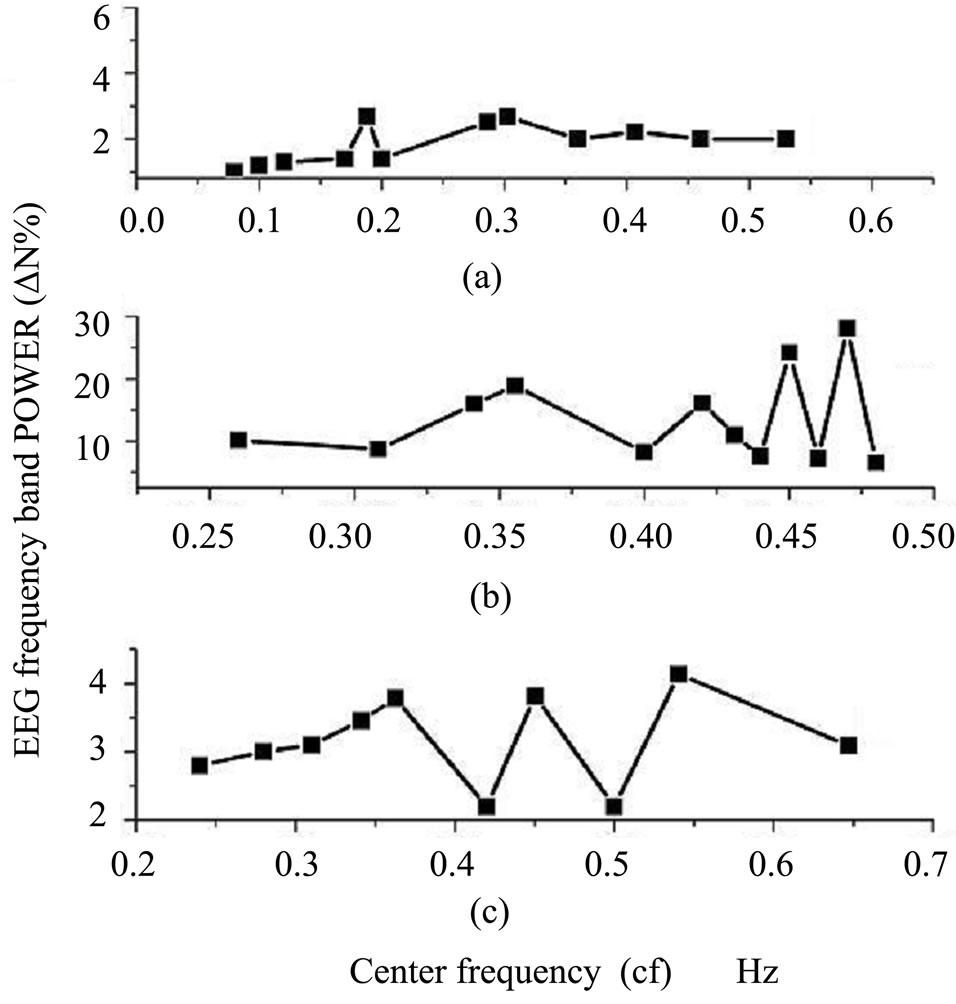
Figure 3. Cortical rat brain surface: Variation of EEG power frequency band ∆N% with center frequency, (a) control; (b) exposed to 10 mT, EMF; and (c) after one week from stopping exposure.
stopping the field exposure, but it has the same polarity of control.
4. DISCUSSION
The results of the present study have demonstrated, that ELF-EMF (50 Hz, 10 mT) affect the EEG activity recorded from the surface of both the skull (Figures 2 and 4) and brain cortex (Figures 3 and 5) of rats. The effort was directed towards estimation of the possible variations in the power bands of EEG spectra with the center frequencies and subsequently in the EEG amplitude recorded in vivo rats subjected to EMF.
The changes of the power spectrum, observed for the 5 min after the accommodation period were pronounced in exposed rats to EMF. Inhibition of rhythms has been noticed at 90% of frequencies of the EEG spectrum (0.1 - 0.7 Hz), averaged over 300-sec time interval for control, exposed to the field and recovery rats. It was shown that EMF (50 Hz, 10 mT) cause a few predominant peaks in the 0.3 to 0.5 Hz band. For example, 0.32, 0.42 and 0.44 Hz, in the skull EEG spectra while 0.32, 0.36 and 0.42 Hz, in the cortical EEG spectra. These results agree and support a previous study of Vorobyov et al. 1998 [14].
The authors had been demonstrated that weak constant magnetic filed affect significantly the brain electrical activity by inhibition of EEG rhythms. In the skull experiments, the observed changes (a decrease from the control values) in the power (∆N%) of EEGs bands for the 300 sec of EMF—exposure differ from the changes observed (an increase from the control value) in case of brain experiments (compare Figures 2(b) and 3(b)). The changes in power EEG bands of control, for both skull and brain, were approximately similar with changes in power spectrum of recovery (compare Figures 2(a), (c) and Figures 3(a), (c)). Thus, the present EEG power spectrum findings are much consistence with previous studies [1,3, 14-17] which had been reported that ELF-MF affect significantly the brain electrical activity. They indicated that constant magnetic filed affects primarily Ca2+ or, alternatively, K+-dependant biochemical reactions known to play key functions in regulation of the cellular activity; in particular, morphine-induced changes in cell functions. The increase in the power of cortical EEG spectra of exposed rats (Figure 3(b)) is quite consistent and support a pervious study by Natalie et al. 2009 [18], which attributed this due to, that magnetic, filed could be targeted specific nuclei anywhere within the brain by matching intrinsic activity.
It was found that the EMF exposure has the effect of changing the magnitude and reversing the polarity of control amplitude in both cases of skull EEG and cortical EEG (Figures 4(a), (b) and 5(a), (b)), while the magnitude and polarity had been recovered after approximately 7 days from stopping the filed exposure. This perhaps
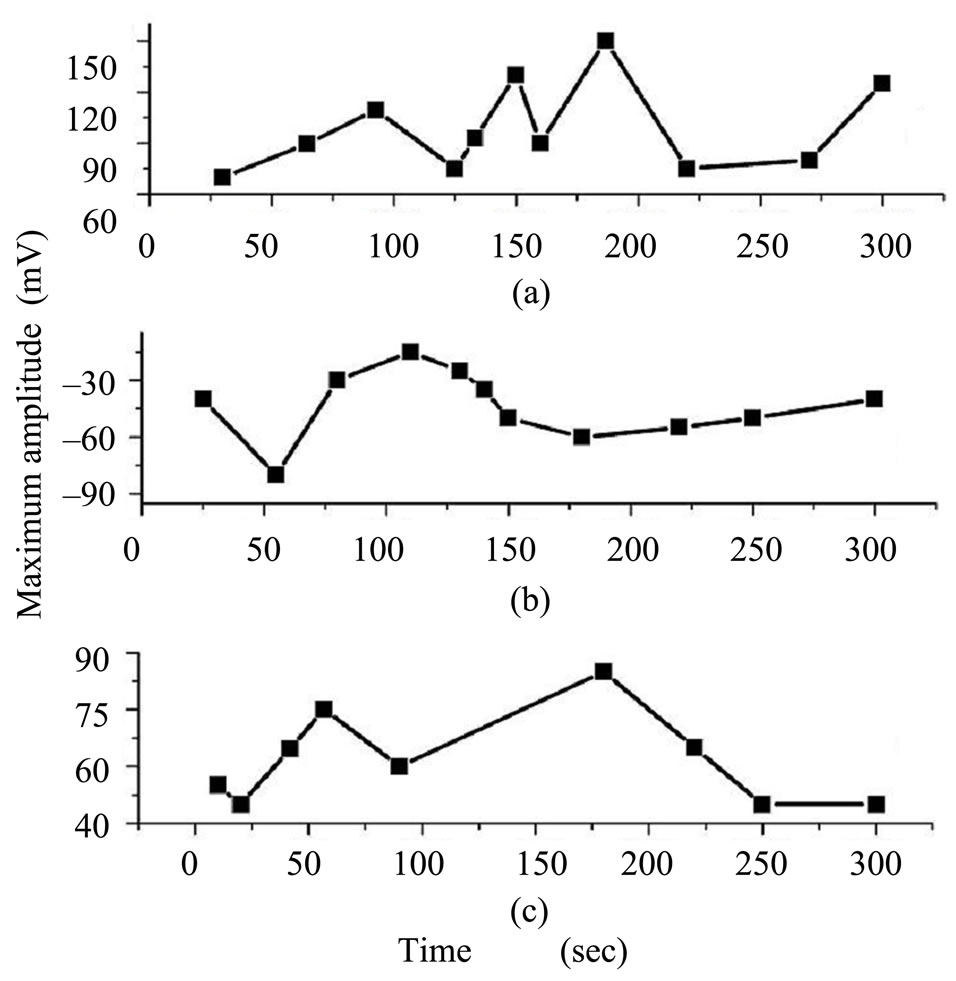
Figure 4. Variation of EEG amplitude recorded from skull surface with time for (a) control; (b) EMF exposure by 10 mT; and (c) after one week from stopping exposure.
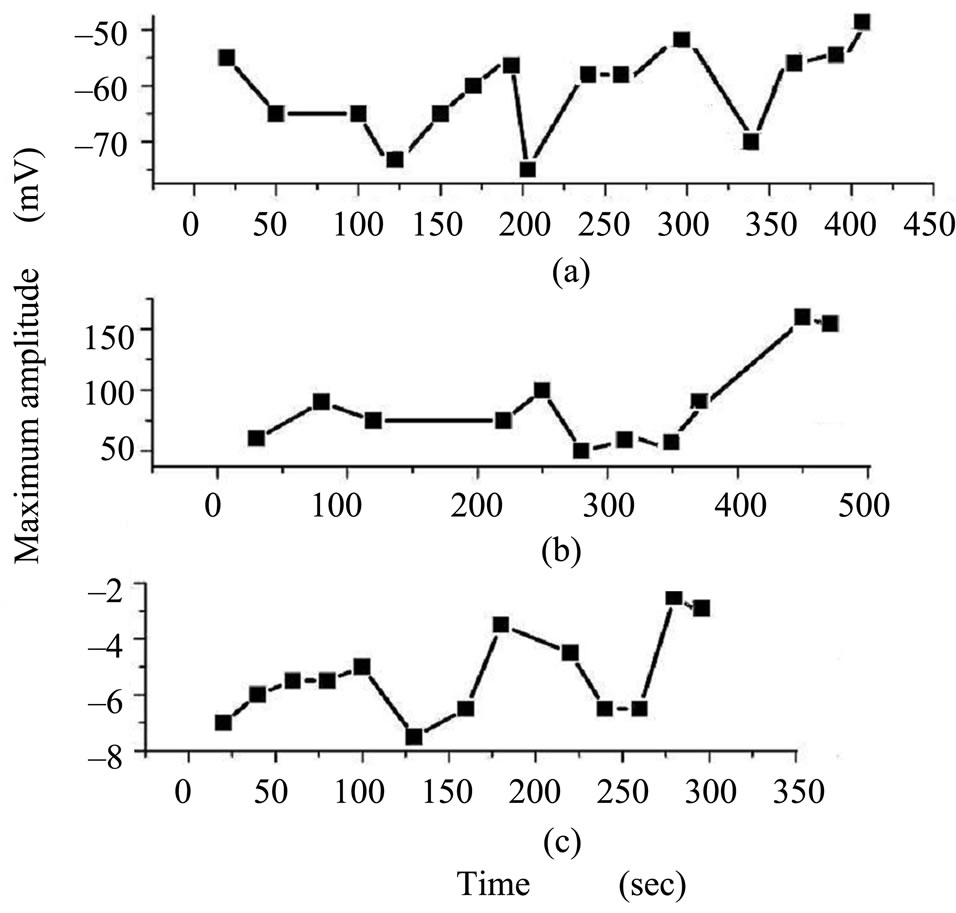
Figure 5. Variation of EEG amplitude recorded from brain surface with time for (a) control; (b) EMF exposure by 10 mT; and (c) after one week from stopping exposure.
due to the stimulation effect of EMF to the cell membrane which cause depolarization and consequently changes in the membrane permeability for some ions. This view is in accordance with many previous studies. These studies revealed that static magnetic filed induce changes on the behavior [19], amplitude [20], properties of ion channels [21] and synaptic transmission [22]. Mehrdad Fatourechi et al. 2007 [5] has reported that, after a voluntary movement, the power in the brain rhythms as well as the amplitude of gamma rhythms increase. The increase in amplitude of cortical EEG (Figure 5(b)) may be due to the neural excitability due to the effect of EMF according to the explanation of Seungyeon et al. 2010 [23], which reported that static magnetic filed may modulate membrane potential or thresholds for action potentials and thus increase neural excitability, which requires regional cerebral blood flow with oxygen. Also, the change in EEG amplitude due to the magnetic filed exposure may be due to the net effects of and increase in the K+ current or decrease in some inward current caring Ca+ of the membrane potential [24].
In conclusion, it must be pointed out that the data obtained in the present study are consistent with the findings of other authors demonstrating that weak ELF-EMF and MFs significantly affect the brain electrical activity in rats. After the text edit has been completed, the paper is ready for the template. Duplicate the template file by using the save as command, and use the naming convention prescribed by your journal for the name of your paper. In this newly created file, highlight all of the contents and import your prepared text file. You are now ready to style your paper.
REFERENCES
- Hartwig, V., Giovannetti, G., Vanello, N., et al. (2009) Public Health. International Journal of Environmental Research, 6, 1778.
- Zare, S., Alivandi, S. and Ebodi, A.G. (2007) Histological studies of the low frequency electromagnetic fields effect on liver, testes and kidney in Guinea pig. World Applied Sciences Journal, 2, 509-511.
- Strasak, L. and Smarad, J. (2002) Effects of low-frequency magnetic fields on bacteria Escherichia coli. Bioelectrochemistry, 55, 161-164. doi:10.1016/S1567-5394(01)00152-9
- Berg, H. (1993) Electrostimulation of cell metabolism by low frequency electric and electromagnetic fields. Bioelectrochemistry and Bioenergetics, 31, 1-25. doi:10.1016/0302-4598(93)86102-7
- Fatourechi, M., Bashashati, A., Ward, R.K. and Birch, G.E. (2007) EMG and EOG artifacts in brain computer interface system. Clinical Neurophysiology, 118, 480-494. doi:10.1016/j.clinph.2006.10.019
- Babiloni, C., Babiloni, F., Carducci, F., Cappa, S.F., Cincotti, F., Del Percio, C., et al. (2004) Human cortical responses during one-bit short-term memory. A high-resolution EEG study on delayed choic reaction time tasks. Clinical Neurophysiology, 115, 161-170. doi:10.1016/S1388-2457(03)00286-4
- Babiloni, C., Miniussi, C., Babiloni, F., Carducci, F., Cincotti, F. and Del Percio, C. (2004) Sub-second “temporal attention” modulates alpha rhythms. A high-resolution EEG study. Cognitive Brain Research, 19, 259-268. doi:10.1016/j.cogbrainres.2003.12.010
- He, B., Hori, J. and Babiloni, F. (2006) EEG inverse problems, in Encyclopedia in biomedical engineering. John Wiley & Sons, Inc., Hoboken, 1355-1363. doi:10.1002/9780471740360.ebs0655
- Mathie, A., Kennard, L.E. and Veale, E.L. (2003) Neuronal ion channels and their sensitivity to extremely low frequency weak electric field. Radiation Protection Dosimetry, 106, 311-316. doi:10.1093/oxfordjournals.rpd.a006365
- Lednev, V.V., Srebnitskaya, I.K., Hyasov, E.N., Rogdestven-Skaya, Z.E., Klimov, A.A., Belova, N.A. and Tiras, K.P. (1996) Magnetic parametric resonance in biosystems: experimental verification of the theoretical predictions with the use of regenerating planarians as a test-system. Biofizika, 41, 815-825.
- Lednev, V.V., Srebnitskaya, I.K., Hyasov, E.N., Rogdestven-Skaya, Z.E., Klimov, A.A. and Tiras, K.P. (1998) Magnetic parametric resonance in biosystems: Experimental verification of the theoretical predictions with the use of regenerating planarians as a test-system. Brain Research, 781, 182-187.
- Watanabe, Y., Nakagwa, M. and Miyakoshi, Y. (1997) Enhancement of lipid peroxidation in the liver of mice exposed to magnetic fields. Industrial Health, 35, 285-290. doi:10.2486/indhealth.35.285
- Stigsby, B., Obrist, W.D. and Sulg, I.A. (1973) Automatic data acquisition and period-amplitude analysis of the electrencephalogramm. Computer Programs in Biomedicine, 3, 93-104. doi:10.1016/0010-468X(73)90025-1
- Vorobyov, V.V., Sosunov, E.A., Kukushkin, N.H. and Lednev, V.V. (1998) Weak combined magnetic field affects basic morphine-induced rat’s EEG. Brain Research, 781, 182-187. doi:10.1016/S0006-8993(97)01228-6
- Shuvalova, L.A., Ostrovskya, M.V., Sosunov, E.A. and Lednev, V.V. (1991) Weak magnetic fields tuned to the parametric resonance for Ca2+ changes the rate of calmodulin dependent myosin phosphorylation. Doklady Akademii Nauk SSSR, 317, 227-230.
- Markow, M.S., Wang, S. and Pilla, A.A. (1993) Effects of weak low frequency sinusoidal and DC magnetic fields on myosin phosphorylation in cell-free preparation. Bioelectrochemistry and Bioenergetics, 30, 119-125. doi:10.1016/0302-4598(93)80069-7
- Prato, F.S., Carson, J.J.L., Ossenkopp, K.P. and Kavaliers, M. (1995) Possible mechanisms by which extremely low frequency magnetic fields affect opioid function. FASEB Journal, 9, 807-814.
- Linda, S., Pierre, S.T. and Persinger, M.A. (2009) Attenuation of epilepsy-induced brain damage in the temporal cortices of rats by exposure to LTP-patterned magnetic fields. Neuroscience Letters, 450, 147-151. doi:10.1016/j.neulet.2008.11.019
- Prato, F.S., Kavaliers, M. and Carson, J.J.I. (1996) Behavioral responses to magnetic fields by lend snails are dependent on both magnetic field direction and light. Proceedings of the Royal Society B: Biological Sciences, 263, 1473-1442. doi:10.1098/rspb.1996.0209
- Ye, S.R., Yang, J.W. and Chen, C.M. (2004) Effect of static magnetic fields on the amplitude of action potential in the lateral giant neuron of crayfish. International Journal of Radiation Biology, 80, 699-708. doi:10.1080/09553000400017424
- Shen, J.-F., Chao, Y.-L. and Du, L. (2007) Effects of static magnetic fields on the voltage-gated potassium channel currents in trigeminal root ganglion neurons. Neuroscience Letters, 415, 164-168. doi:10.1016/j.neulet.2007.01.015
- Rosen, A.D. (1992) Magnetic field influence on acetylcholine release at the neuromuscular junction. American Journal of Physiology—Cell Physiology, 262, C1418- C1422.
- Kim, S., Chung, Y.-A., Lee, C.-U., Chae, J.-H., Juh, R. and Jeong, J. (2010) Target-Specific rCBF changes induced by 0.3-T static magnetic field exposure on the brain. Brain Research, 1317, 211-217. doi:10.1016/j.brainres.2009.10.057
- Nikolic, L., Kartelija, G. and Nedelikovis, M. (2008) Effect of static magnetic fields on bioelectric properties of the Br and Ni neurons of snail Helix pomatia. Comparative Biochemistry and Physiology, 151, 657-663.