Journal of Environmental Protection
Vol.5 No.3(2014), Article ID:43359,7 pages DOI:10.4236/jep.2014.53023
Analysis of Radium Isotopes in Surface Waters nearby a Phosphate Mining with NORM at Santa Quitéria, Brazil
1Multidisciplinary Group of Radioprotection (GMR), Serviço de Radioproteção, Unidade de Tratamento de Minério, Indústrias Nucleares do Brasil, Caldas, Brazil; 2Laboratory of Radiobiology and Radiometry Pedro Lopes dos Santos (LARARA-PLS), Group of Environmental Themes Assessment (GETA), Universidade Federal Fluminense (UFF), Niterói, Brazil; 3Interdisciplinary UnderGraduation in Science and Technology, Universidade Federal de Alfenas, Poços de Caldas, Brazil.
Email: pereiraws@gmail.com
Copyright © 2014 Wagner de S. Pereira et al. This is an open access article distributed under the Creative Commons Attribution License, which permits unrestricted use, distribution, and reproduction in any medium, provided the original work is properly cited. In accordance of the Creative Commons Attribution License all Copyrights © 2014 are reserved for SCIRP and the owner of the intellectual property Wagner de S. Pereira et al. All Copyright © 2014 are guarded by law and by SCIRP as a guardian.
Received November 30th, 2013; revised December 28th, 2013; accepted January 25th, 2014
Keywords: Radioecology; Environmental Radioprotection; NORM Mining; Radium Isotopes; PCA
ABSTRACT
The radium isotopes 226Ra and 228Ra were analyzed in surface water at six points in the neighborhood of a mine of phosphate, associated with uranium, in the region of Santa Quitéria, state of Ceará, Brazil. Water samples were collected during twenty months, filtered and the concentrations of activity determined in the soluble and particulate phases. The results were analyzed using the Principal Component Analysis (PCA) for ordination of environmental data, and also by ANOVA, Tukey and Z tests to compare sets of data considering the radionuclides, the two analyzed phases and the six collecting points. The PCA identified four groups that included all collecting points, using aggregation features such as radionuclide and analyzed phase. The first group is composed by the samples of 226Ra in the soluble phase; the second group by samples of 226Ra in the particulate phase; the third one by 228Ra in the soluble phase, and finally, the fourth group by 228Ra in the particulate phase. This last group has two discrepant points (01 and 06). Statistical analysis identified differences between the concentrations of activity of radionuclides (228Ra higher than 226Ra) and in analyzed phases (soluble phase higher than the particulate one) but showed no differences between sampled points.
1. Introduction
Phosphate mining and processing can cause significant radiological impacts due to the amount of radionuclides present in the ore [1]. Phosphogypsum e.g., a by-product of phosphate mining, is contaminated by heavy metals and radionuclides, especially 226Ra [2]. Mining of phosphate with associated Naturally Occurring Radioactive Materials must thus be considered as a NORM activity.
There has been an increased awareness of the radiological impacts of NORM non-nuclear mining pointing that this activity may cause radioactive contamination due to the by-products, wastes and to the installations themselves [3]. In this respect, the environmental impact was analyzed in three practices related to phosphate production: mines, phosphate fertilizers factory and phosphate export platforms. Air particulates, soil, water (lake, river and sea water), biota and plant samples were collected and analyzed. An increase of natural radionuclides in the surroundings of the three enterprises was observed, with fallout being the principal contamination way [4].
Accordingly, the phosphate industry has been recently included within the European regulatory scope. 226Ra was recognized as the major contaminant. It is found mainly in the processing waters, and the major releasing way is via the liquid effluents [5].
Located in the central-north region of the state of Ceará, Brazil, the “Santa Quitéria” Unit is a phosphate associated with uranium mining installation in predevelopment stage that belongs to the “Indústrias Nucleares do Brasil” (INB). The deposit has recoverable reserves of about nine million tons of P2O5 and 79,500 tons of U3O8 [6]. The unit is under the influence of the “Bsh” semiarid climate. The raining season extends from January to May, with sporadic precipitations in June and July. The annual rainfall varies from 550 mm to 960 mm [6]. The rainiest month is March, with rainfall indices varying from 115 mm to 230 mm [6]. Ecologically, the area is characterized as a tropical steppe known as caatinga (savanna) with tropical forests and human occupation areas.
According to Brazilian norms, the unit is classified as a NORM installation [7]. The development of a unit with this classification demands a radiological environmental monitoring program [7-10]. In this context, monitoring means a systematic and planning process of measuring radiation fields, radioactivity and other environmental parameters, including the interpretation of these measurements, in order to characterize, evaluate and control public exposure, especially the critical group, the most exposed to radiation resulting from practice [7-10].
In terms of radioecology, it is necessary to evaluate the behavior of the radionuclides and of their phases in the environment, and how this behavior is able to alter the concentrations of activity of these parameters.
In terms of environmental radiation protection, it is necessary to analyze the possible changes in behavior and in concentrations of activities along the ways of exposition of population and biota in order to evaluate the radiological environmental impact of the project.
A number of radionuclides must be analyzed aiming a comprehensive understanding of their behavior and dispersion in the region. A model for assessment of environmental radiological impact should also be proposed in order to estimate the exposition before the operation and to allow the licensing based in terms of increased dose caused by the practice, as determined by Brazilian laws [2-5].
In Spain, the radiological impact of phosphate mining with NORM decreased significantly with the regulation of the practice and with the separation of the regulation on radiological aspects and chemical aspects that coexist in this kind of practice [11]. The authors also point the extensive regulation of the European Union countries in both aspects of the impact of mining [11].
We here report on the concentrations of activity of the radium isotopes 226Ra and 228Ra in surface water measured at six monitoring points in the vicinity of the Santa Quitéria mine. The values were submitted to usual statistical treatment such as the ANalysis Of VAriance (ANOVA), and the Tukey and Z tests [12-15], but also to a data ordination technique used in multivariate statistics known as the Principal Component Analysis (PCA), as an auxiliary tool for the interpretation of measured data [16-18]. The use of univariate and multivariate analyses in the pre-operational environmental monitoring aimed the licensing of the phosphate mine with NORM characteristics, using radium isotopes as a case study.
2. Methodology
2.1. Sampling Area
The Santa Quitéria Unit is located in the municipality of Santa Quitéria, state of Ceará, 212 Km South from the state capital Fortaleza, in northeast of Brazil (Figure 1).
2.2. Sample Collection and Preparation
Environmental water samples (one liter each) were collected monthly during twenty months: in January 2006, and then continuously from June 2006 until December 2007, at six points around the unit, as shown in Table 1. All samples were sent to the Federal University of Ceará where they were filtered through a cellulose acetate filter of porosity 0.45 μm. The fraction that passes through the
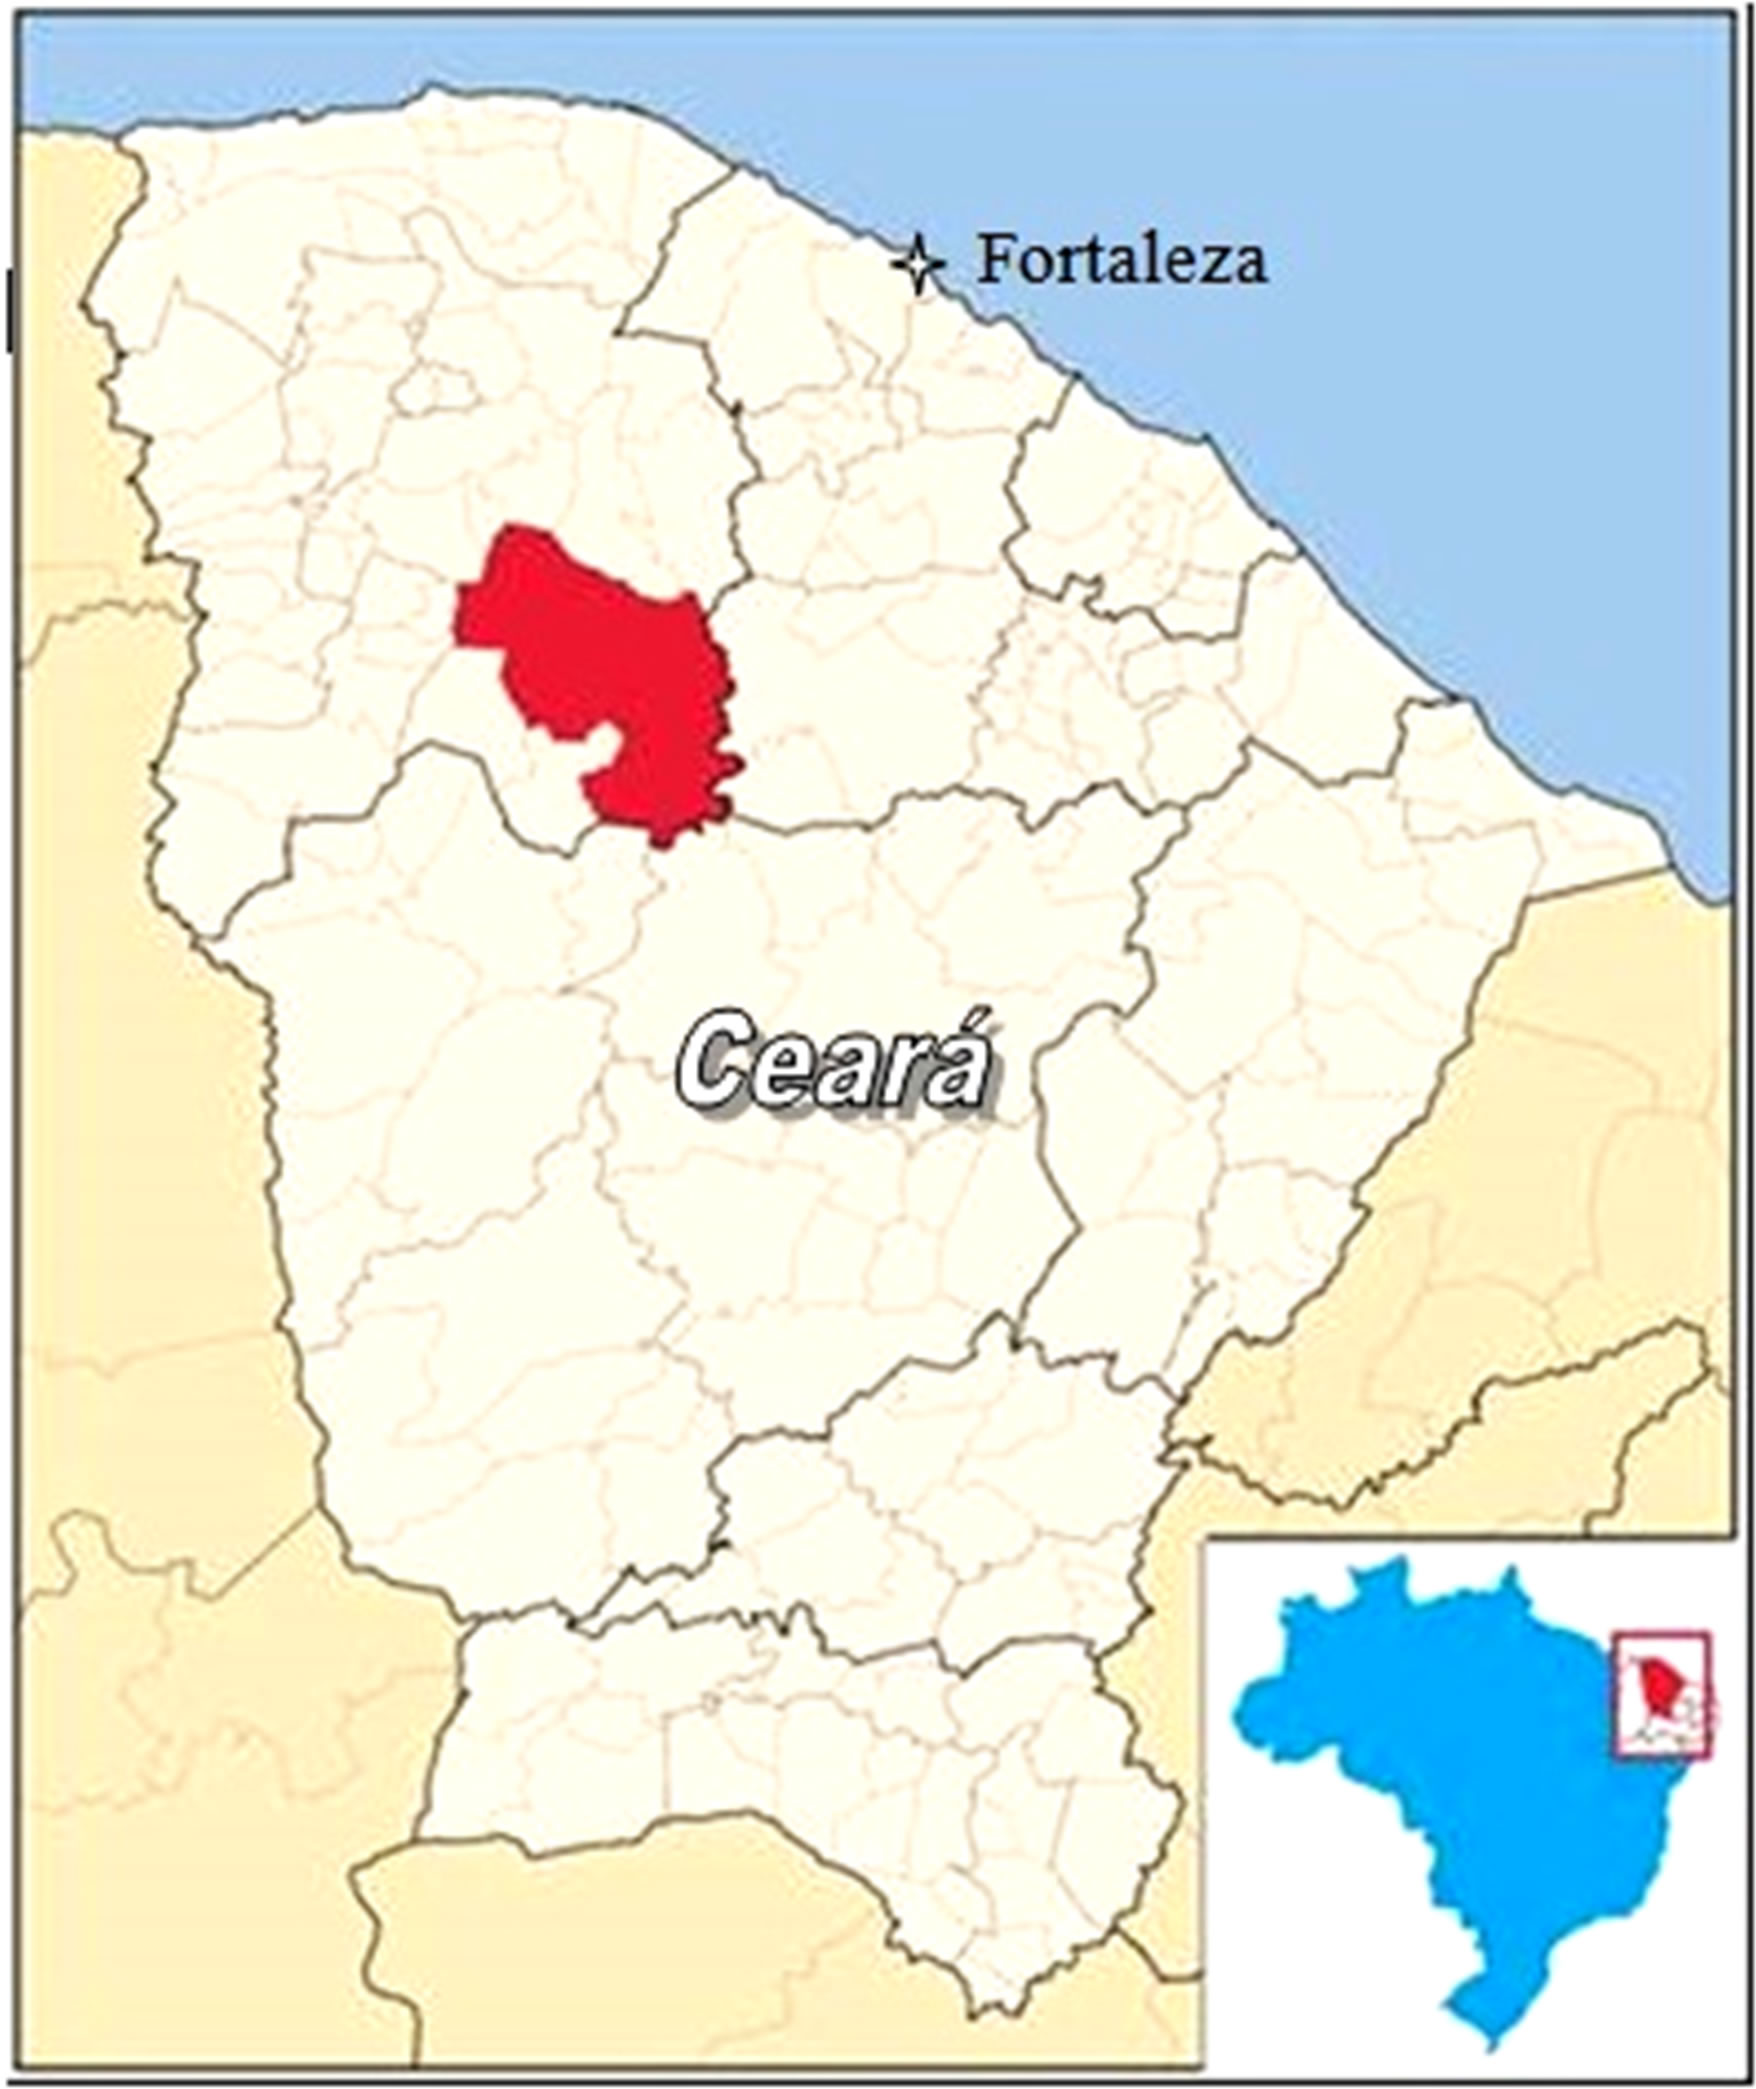
Figure 1. Location of Santa Quitéria municipality in the state of Ceará, Brazil (adapted from Wikipedia).
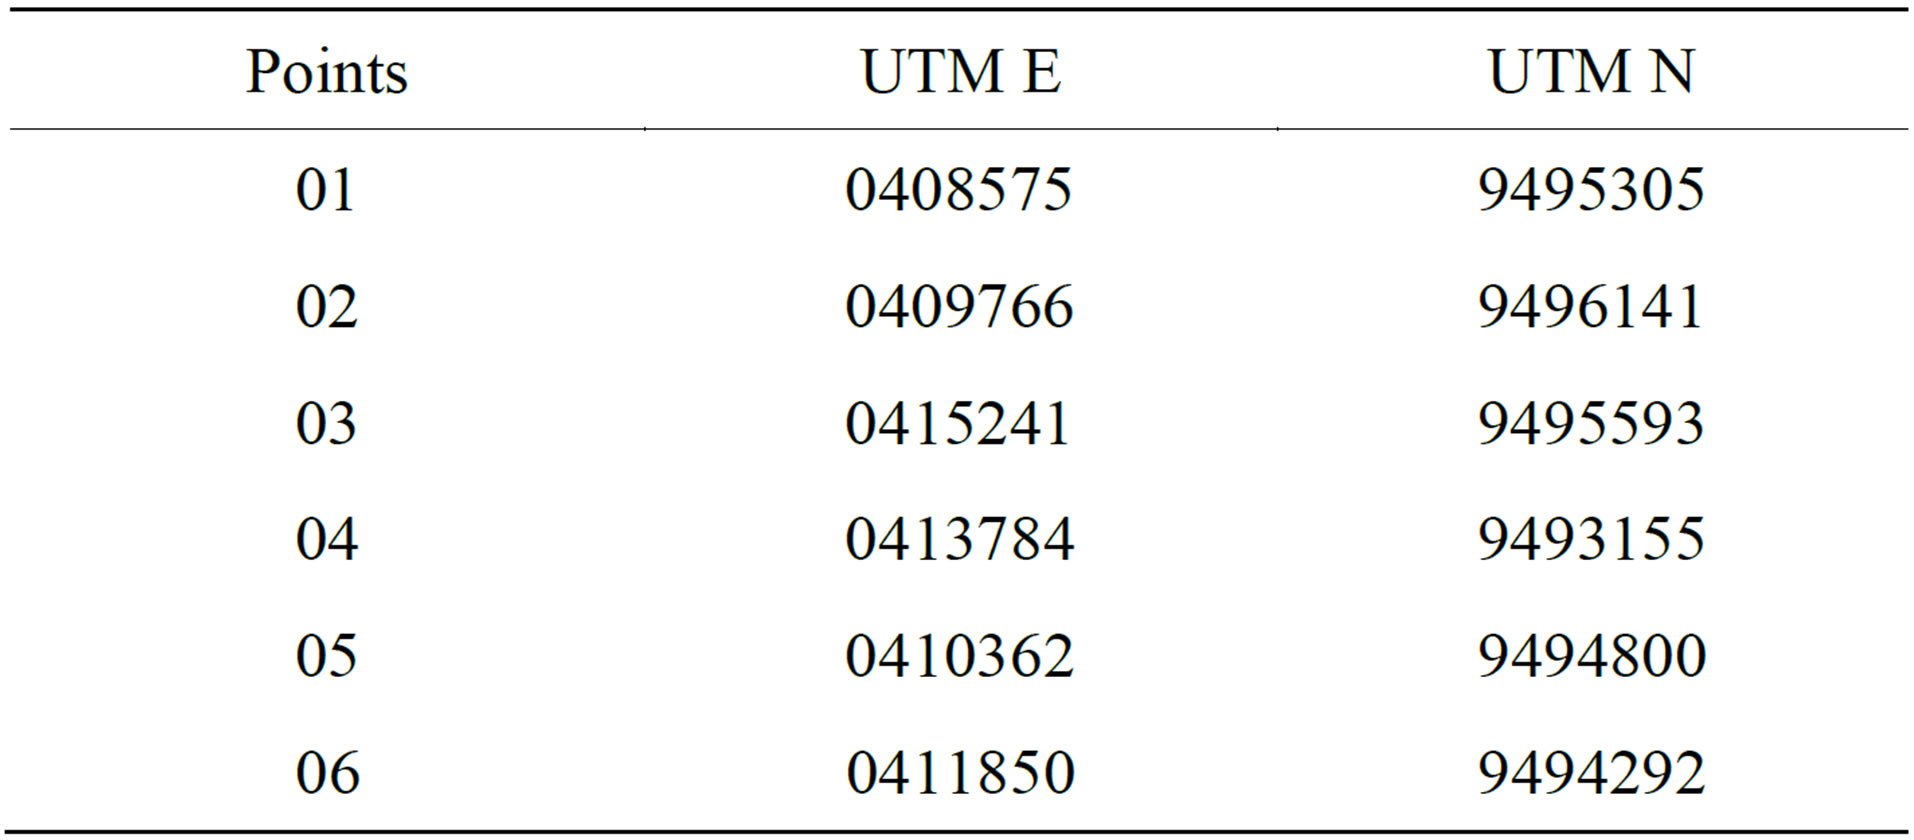
Table 1. Geographical locations of water collecting points in “UTM” coordinates.
filter was considered as the soluble phase and material retained on the filter was considered as the particulate phase. After filtration, samples were acidified with 1 ml conc. nitric acid per liter and finally sent to the laboratory of environmental analysis of the “Indústrias Nucleares do Brasil” (INB), at the Ore Treatment Unit (UTM) situated at Poços de Caldas, state of Minas Gerais, Brazil, for radionuclides determinations.
2.3. Radionuclides Determination
The determined radionuclides were 226Ra and 228Ra. Radium has been chemically separated by co-precipitation from the other radionuclides present in the samples. 226Ra has been determined by gross alpha counting and 228Ra has been determined by gross beta counting, as described elsewhere [19].
2.4. Sampling Design and Data Organization
Data were separated by month of collection, collecting point (numbered 01, 02, 03, 04, 05 and 06), radionuclide (226Ra or 228Ra), and sample phase (particulate or soluble phase). Data were organized in a matrix having 24 columns referring to the six collecting points split for each radionuclide and each sample phase, and 20 lines referring to the 20 months of collection. Collected data sum a total of 480 values to be analyzed. Then, the data were grouped in several ways: by radionuclides, regardless of the phase and collecting point, by phase regardless of the radionuclide and the collection point, and finally by collecting point regardless of phase and radionuclide. Thus three factors were analyzed: radionuclide, sample phase and collecting point.
2.5. One Variable Statistic Analysis
The statistical tests used in univariable statistics require adjustments to the Gaussian distribution [12-15]. For this, the adjusting Anderson-Darling test was performed, using the statistical package Minitab® version 16.
An ANOVA was performed to verify the existence of differences in radium concentrations of activity between points, radionuclides and their fractions. This analysis was carried out with the statistical package Excel® version 2010 for Windows® environment. Existing differences, the Tukey test was performed to “group” points, radionuclides and phases with the same concentration of activity. The statistical package Minitab® version 16 was used for this analysis. Tested hypotheses by ANOVA were:
• H0 there are no differences between analyzed means;
• H1 there is at least one different mean.
Another ANOVA was executed between points grouping all results of each point regardless the radionuclide or phase. This analysis was performed with the statistical package Excel® version 2010 for Windows® environment. Existing differences the Tukey test was applied to “group” the points with the same concentration of activity.
Four Z tests were made: one to compare the concentrations of activity in the phases (soluble and particulate) for 226Ra isotope and a second identical for isotope 228Ra. The third one was carried out between the phases, regardless the radionuclide (i.e. data for the soluble phases for 228Ra and 226Ra versus data for the particulate phases for both isotopes). Finally, the fourth Z test was performed with the radionuclides regardless of the phases (i.e. data on 226Ra in the soluble and particulate phases versus data on 228Ra in the same phases). These analyzes were done with the statistical package Excel® version 2010 for Windows® environment. Tested hypotheses were:
• H0 there are no differences between means;
• H1 there are differences between means.
2.6. Multi Variable Statistic Analysis
Principal Component Analysis
Principal Component Analysis (PCA) is a technique for modeling co-variances, which was introduced in 1901 by Pearson [16]. Although multivariate techniques for environmental data assessment are a need, since the world is composed by multi-factorial inter-related parameters, Valentin reported that the first application of PCA in ecology occurred only in 1954 [17].
Nowadays PCA is the most used ordination technique for ecological analysis. Environmental data are ordered in one or two axis. The parameters are established by a correlation similarity of variance-covariance matrix [17]. PCA uses this matrix to produce a set of orthogonal axes ordered from highest to lowest values of a parameter (factor) according to its contribution to the total variance of data. The result is a reduced system of coordinates in which both the position of data in relation to the axes and the relationship between data provide information on the similarities of environmental data [16-18].
3. Results
3.1. Frequency Distribution
Data were analyzed by the Anderson-Darling test for fitness to normal distribution. Concentrations of 226Ra in the particulate phase gave a test parameter of 15.027 and 226Ra in the soluble phase a value of 28.064. For 228Ra, the value in the particulate phase was 8.231 and in the soluble phase 30.422. For all these tests the critical value was less than 0.05. Thus, the four distributions were considered log-normal distributed and therefore a normalizing process was required in the form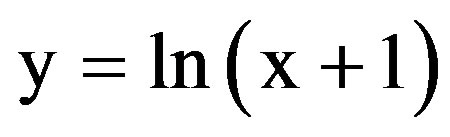 , as recommended by Ceteno [12].
3.2. Radium Activity Concentrations
Concentrations of activity of 226Ra and 228Ra in water samples, collected during twenty months, were obtained according to described methodology [19]. Table 2 shows the averages of the concentrations of activity and the number of data analyzed for both radionuclides, organized by collecting point and sample phase (before logarithmic transformation). These results can be seen in a graphical way in Figure 2.
3.3. One Variable Analysis
The ANOVA was realized between points, radionuclides and their phases after logarithmic normalizing transformation in the form [ ] of the values reported in Table 2. In this case, Fcal (value calculated by the test) is equal to 2.28 being higher than Fcri (value if accepted the H1 hypothesis) that is equal to 1.55, with an associated P (statistically significant result) lower than 0.001. This analysis showed differences in the concentrations of activity between the points, radionuclides and phases.
After performing the ANOVA on normalized data, a Tukey test was carried out to detect groups of data with similar average concentrations of activity. Three groups were observed (Table 3).
The first group with the highest mean concentrations of activity appears under lable “A” alone (Table 3). This group has only one representative, i.e. 228Ra in the soluble phase at point 06.
The second group with intermediate concentrations of activity is composed by the 11 factors labeled “A” and “B” simultaneously (Table 3). This group is formed by representatives of 226Ra and 228Ra in both soluble and particulate phases, that is 228Ra in the soluble phase at points 02, 03, 04 and 05; 228Ra in the particulate phase at points 02, 03, 05 and 06; 226Ra in the soluble phase at points 01 and 03, and 226Ra in the particulate phase at point 01.
Finally, the third group with the lowest concentrations of activity is composed by the 12 factors labeled “B” only (Table 3). This group, likewise the second one, is formed by representatives of 226Ra and 228Ra in both soluble and particulate phases. This group contains 228Ra in the soluble phase at point 01; 228Ra in the particulate phase at points 01 and 04; 226Ra in the soluble phase at points 02, 04, 05 and 06, and 226Ra in the particulate phase at points 02, 03, 04, 05 and 06.
Another ANOVA, on normalized data, was performed between collecting points regardless of the phases and radionuclides. This analysis showed the absence of statistical differences between collecting points as Fcal (0.96) was lower than Fcri (2.23), with P = 0.45. Thus, all collecting points are considered to have identical means of concentration of activity when the factors radionuclide
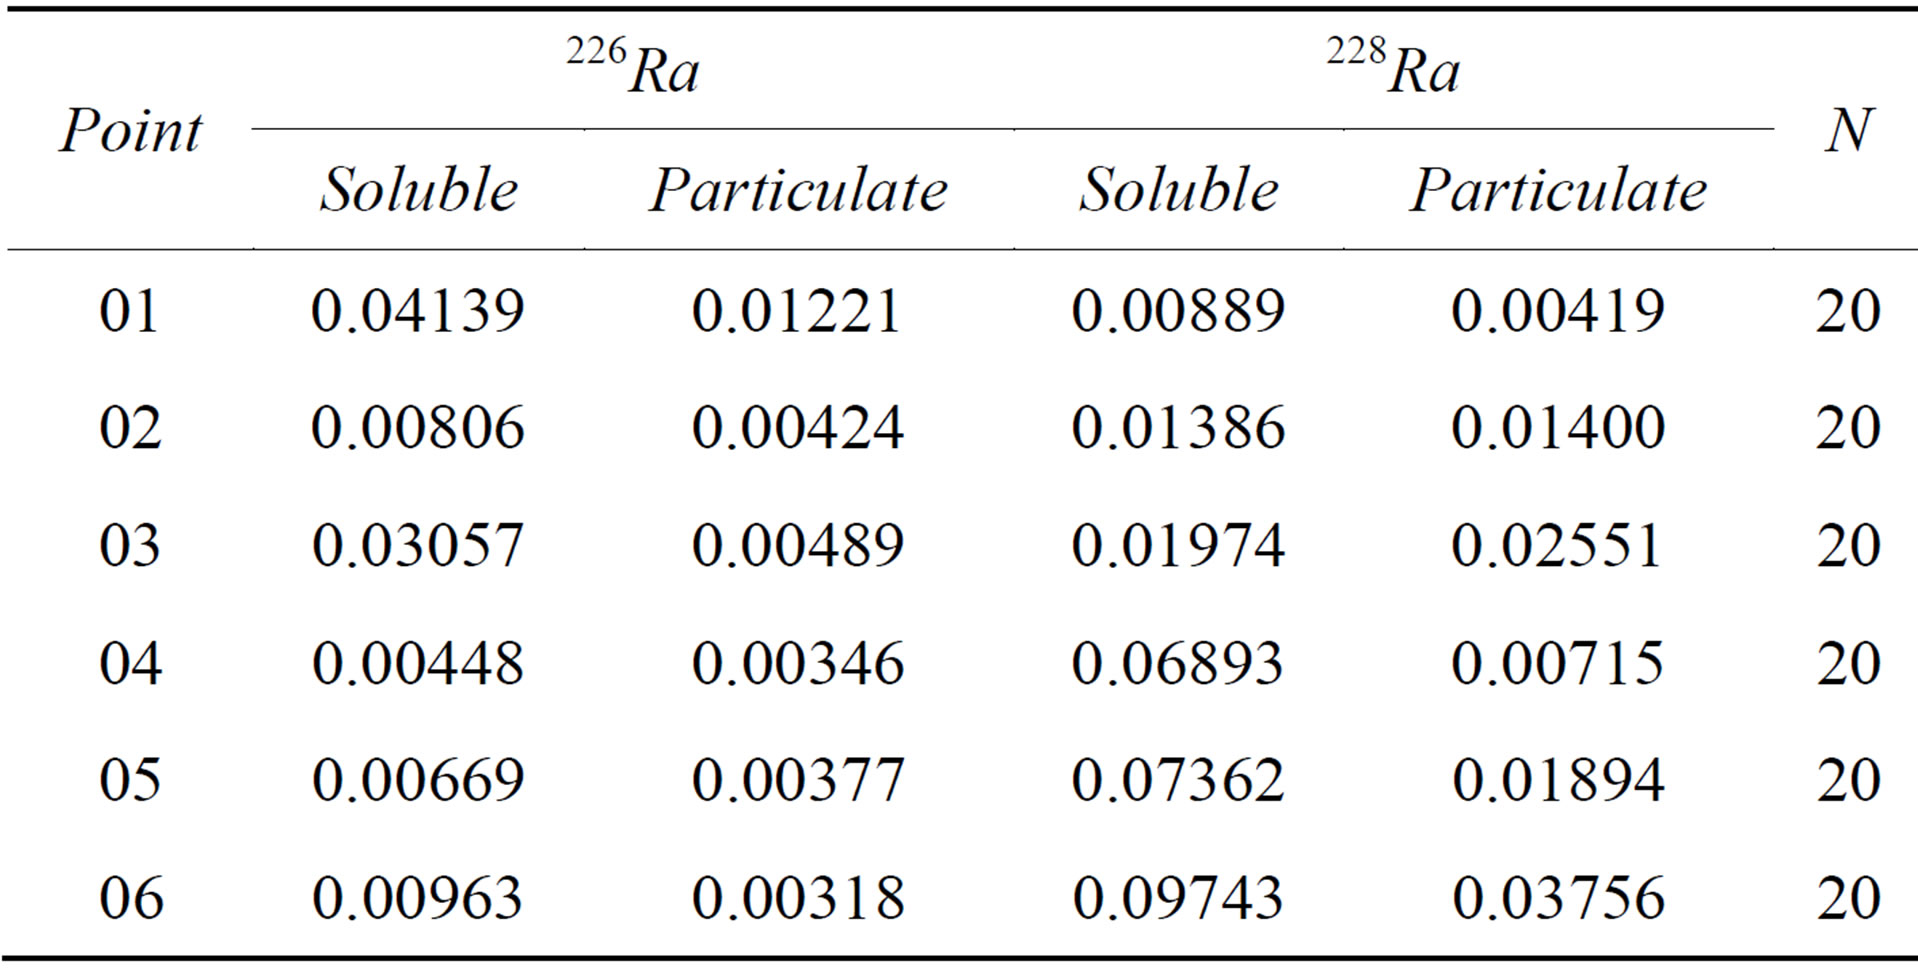
Table 2. Averages over 20 months of the concentrations of activity of 226Ra and 228Ra in the soluble and particulate phases at the 6 collecting points (Bq∙l−1).
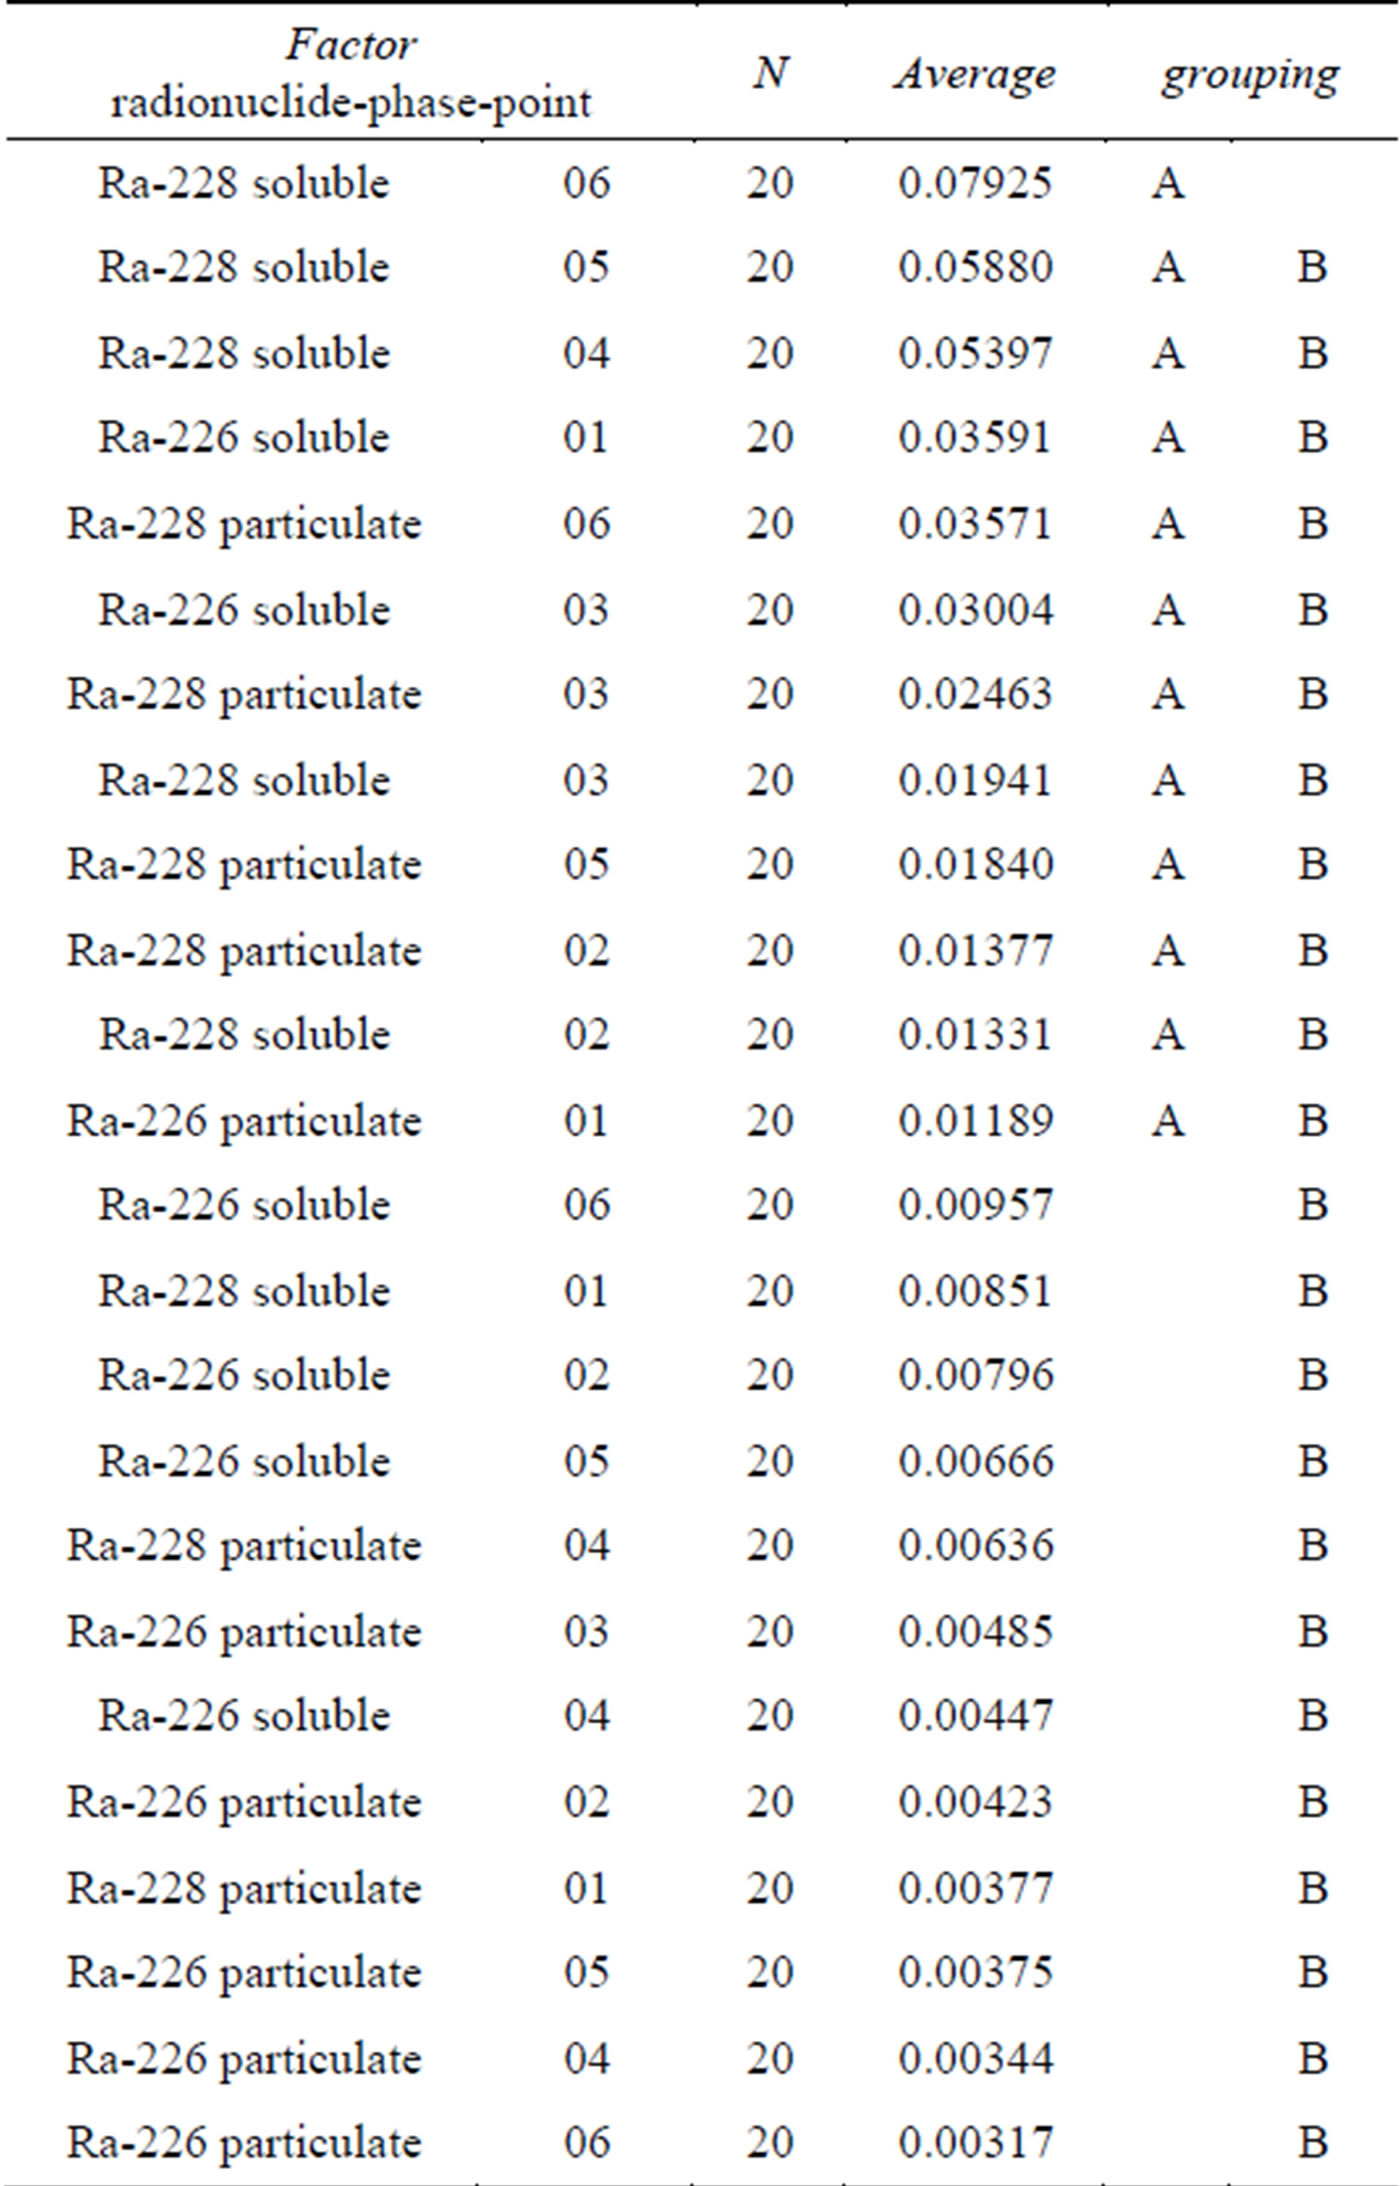
Table 3. Tukey test for grouping the averages.
and phase are not considered.
Comparing among themselves the values of the soluble and particulate phases for each isotope (226Ra or 228Ra), it appears that the mean concentrations of activity of 226Ra in the phases are considered statistically different (Zcal = 2.75 > Zcri = 1.64, with P < 0.01), with the values in the soluble phase higher than in the particulate one. The same behavior was observed for 228Ra with
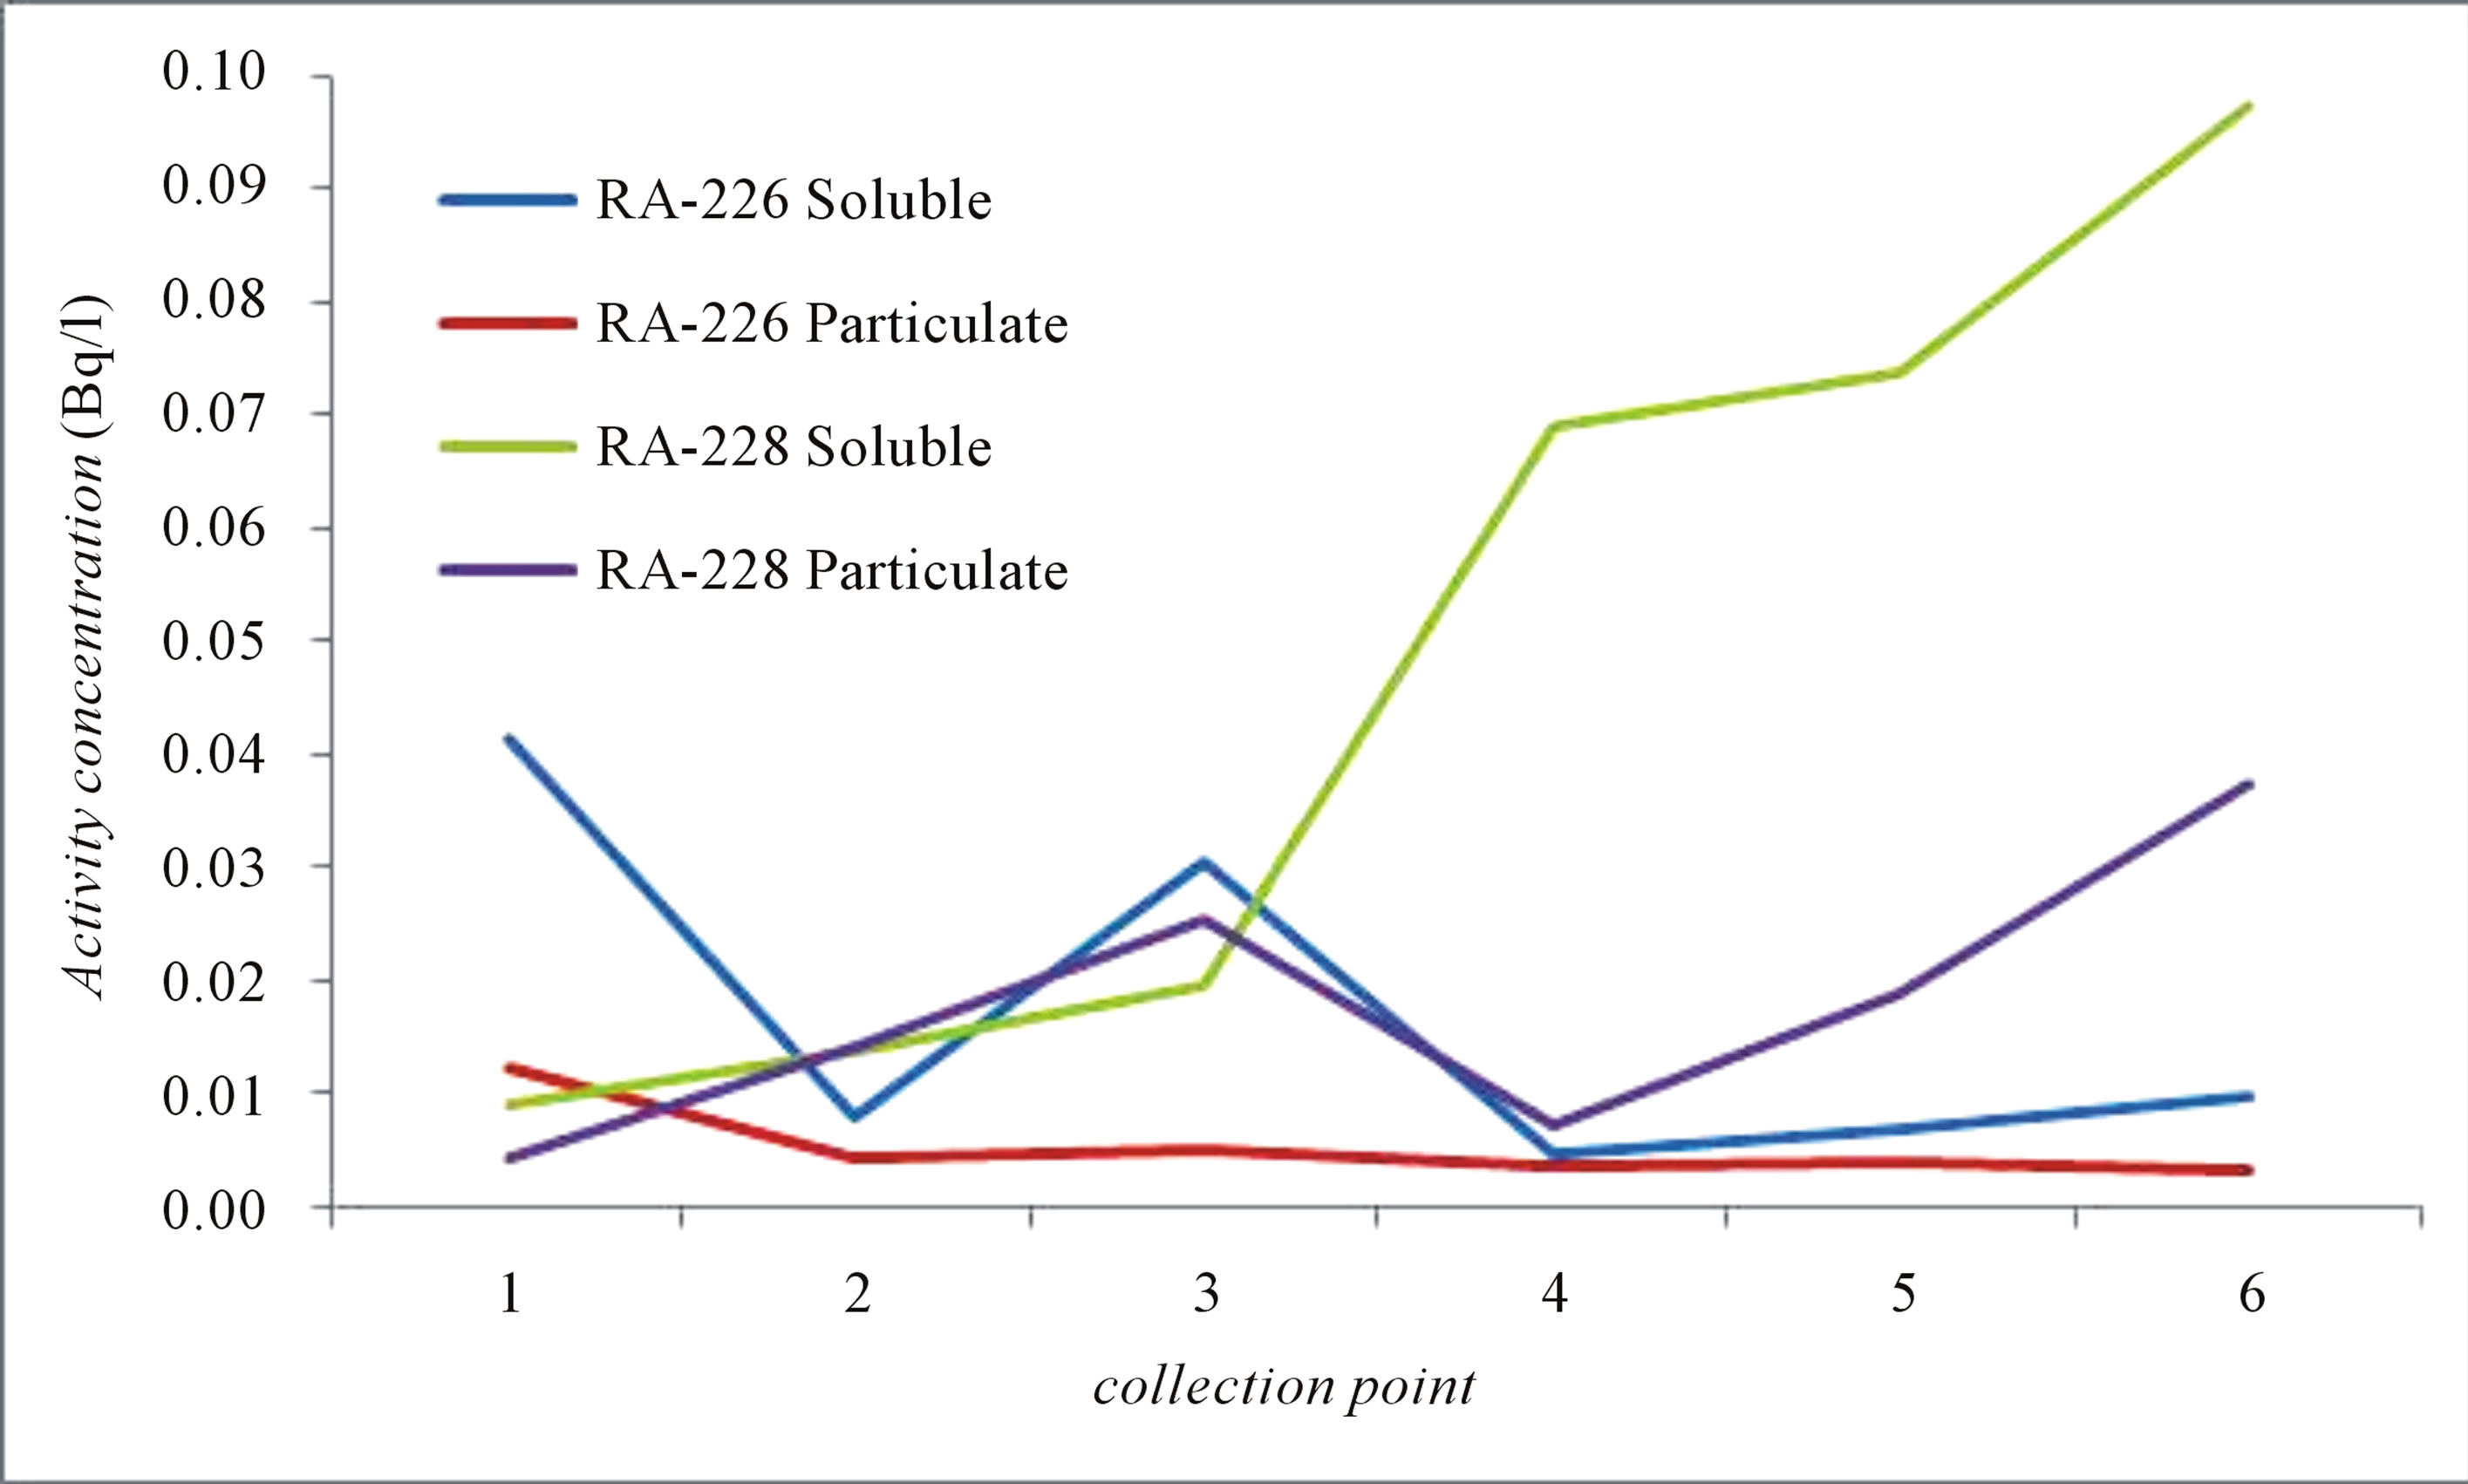
Figure 2. Activity concentration average values of 226Ra and 228Ra in particulate and soluble phases at the 6 collecting points (Bq∙l−1).
values of the soluble phase again higher than of the particulate one (Zcal = 2.08 > Zcri = 1.64, P < 0.01).
When the values of the phases are analyzed regardless of the radionuclides and of the collecting points, the values for the soluble phase were considered statistically higher than those of the particulate phase (Zcal = 6.97 > Zcri = 1.64, P < 0.01).
Now comparing the radionuclides regardless of the phases and of the collecting points, the concentrations of activity for 228Ra were considered higher than those of 226Ra (Zcal = 2.85 > Zcri = 1.64, with P < 0.01).
3.4. Ordination of Data
The PCA analysis results are shown in Figure 3. PCA identified four groups of samples. The results of 228Ra in the soluble phase are grouped in the negative parts of axis 1 (Factor 1) and axis 2 (Factor 2).
Results of 226Ra in the particulate phase are grouped in the positive part of axis 1 (Factor 1) and in the negative part of axis 2.
Results of 226Ra in the soluble phase are grouped along the positive part of axis 1 (Factor 1) and near the origin of axis 2 (Factor 2).
Finally, results of 228Ra in the particulate phase are grouped in the positive parts of axis 1 (Factor 1) and axis 2 (Factor 2). This group shows two discrepant points (01 and 06), due to their variance most related to the group composed by 228Ra in the soluble phase, mainly point 06.
4. Discussion and Conclusions
The statistical analyses allow commentaries. When the radionuclides are analyzed regardless of the other variables, it may be concluded that there are differences between the concentrations of activity of considered radionuclides, with 228Ra showing higher concentrations of activity than 226Ra.
When the phases are analyzed regardless of the other variables, differences are observed between them, with the soluble phase showing higher concentrations of activity than the particulate one.
Concerning the collecting points, another scenario is observed. Thus, when the points are analyzed regardless of the other variables, no differences were observed between them. All the points were considered to have identical means.
Thus, the univariate analysis (ANOVA) allowed establishing that the environmental variables “radionuclide” and “phase” have different behaviors, but the variable “collecting point” showed no differences between the points.
The situation is more complicated when the collecting points are analyzed taking into consideration the variables radionuclide and phase. Three distinct groups appear, with high, intermediate or low means.
The highest average appears for 228Ra in the soluble phase at point 06, forming a group of a single element. The second group with intermediate averages is heterogeneous being composed by 228Ra, in both phases at points 02, 03 and 05, plus 228Ra in the soluble phase at point 04 and in the particulate phase at point 06, and also by 226Ra in both phases at point 01 and in the soluble phase at point 03. The last group, with the lowest concentrations of activity, is composed by 228Ra in both phases at point 01 and 228Ra in the particulate fraction at point 04. This group also contains 226Ra in both phases at points 02, 04, 05 and 06 together with 226Ra in the particulate fraction at point 03.
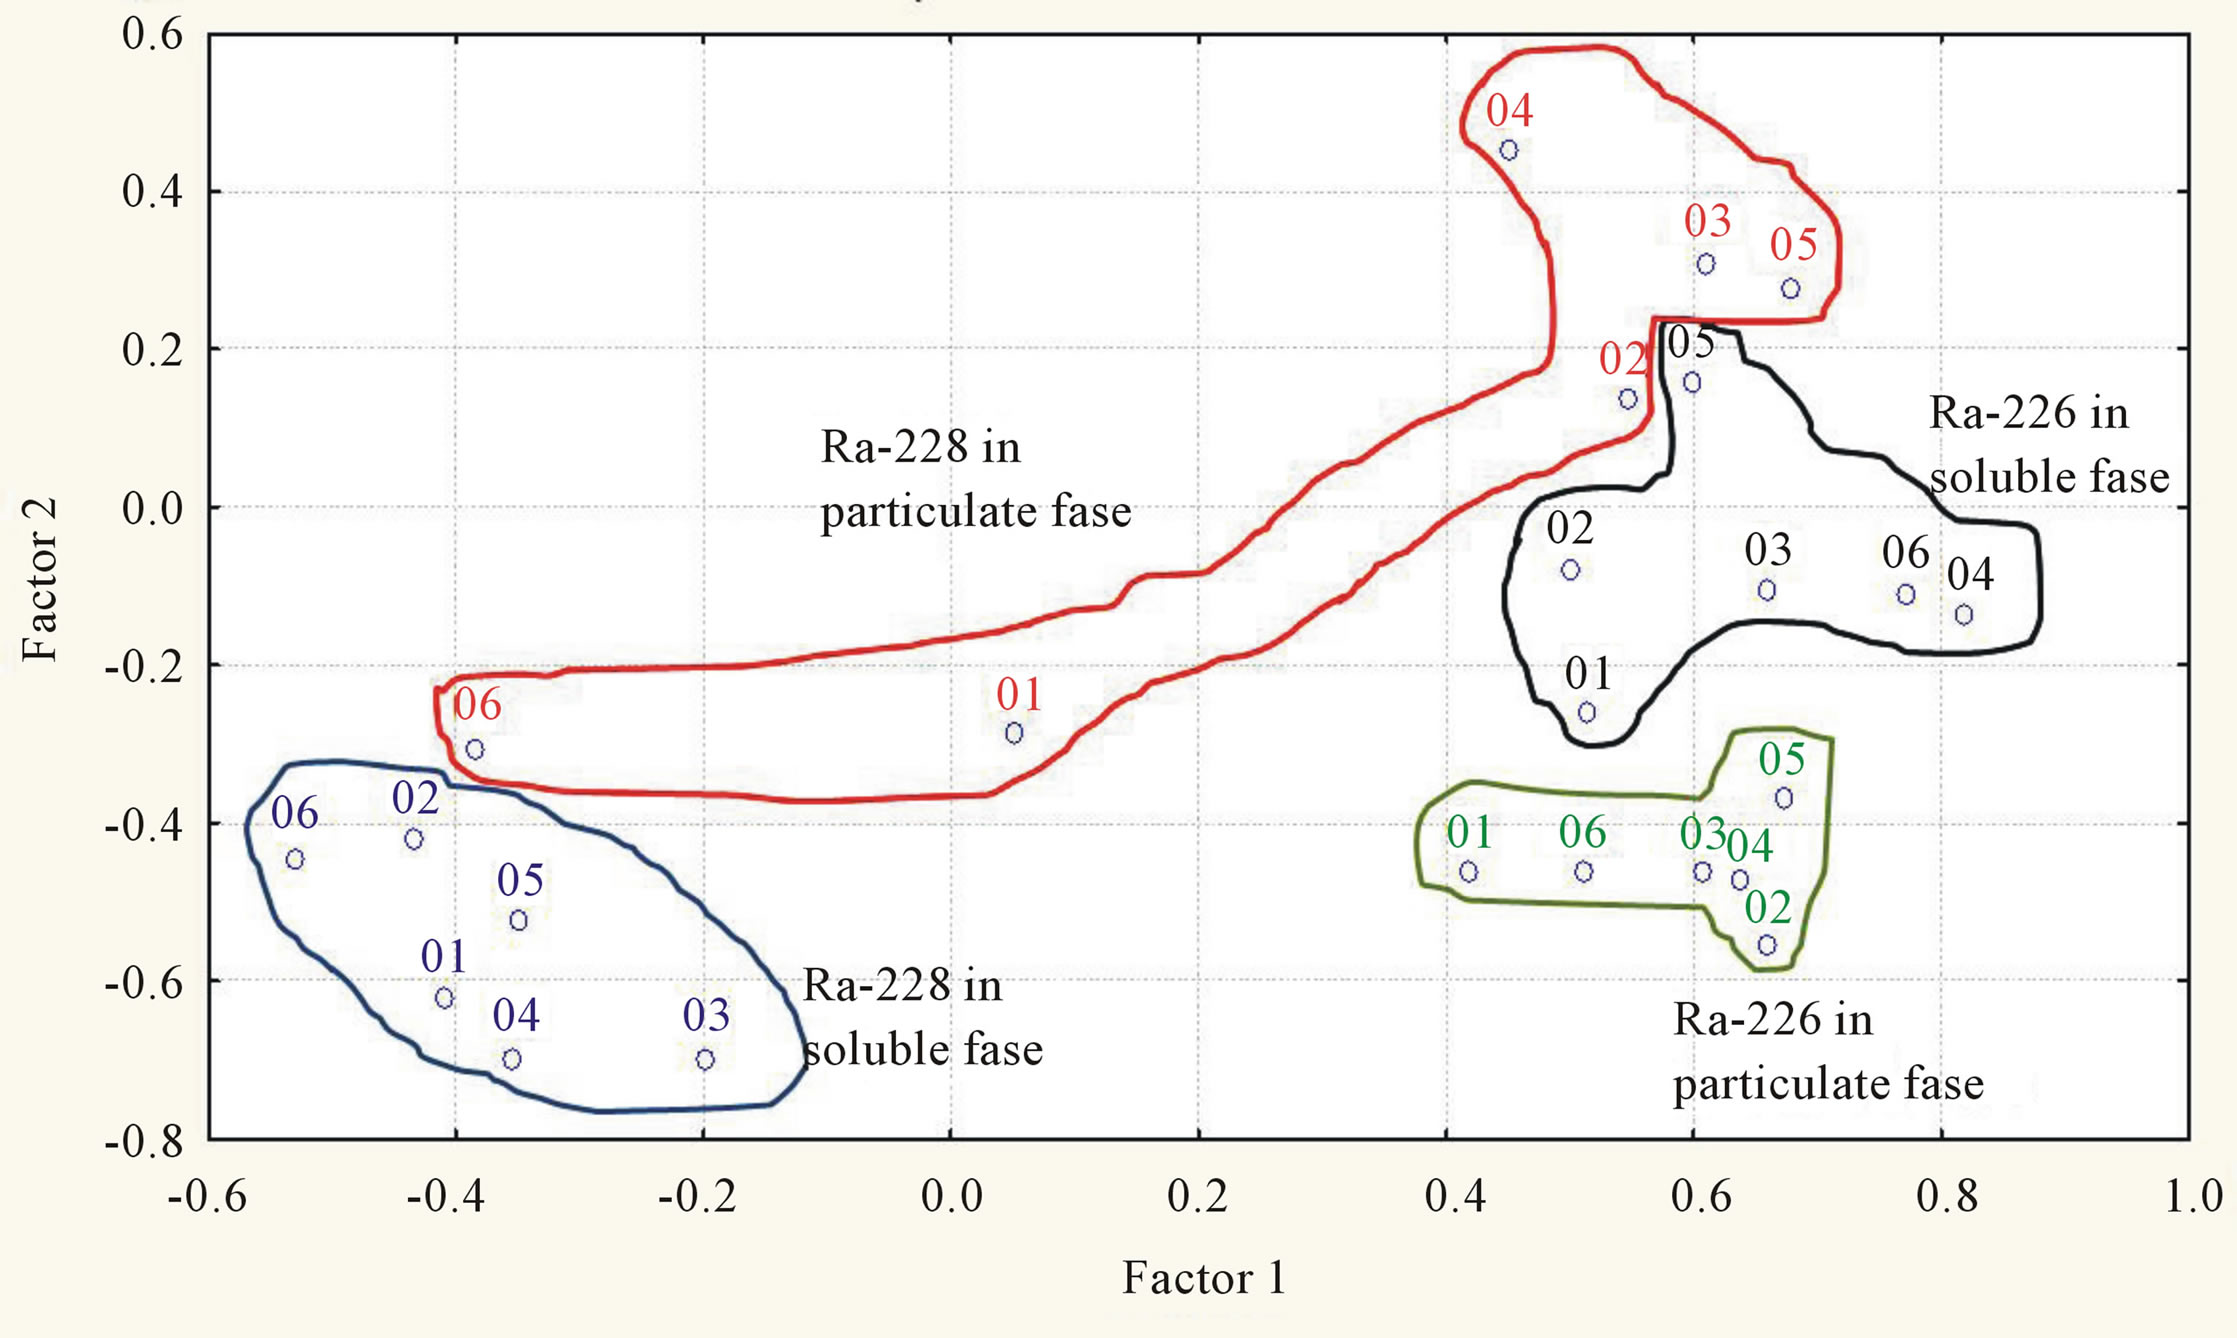
Figure 3. Ordination of collecting points as a function of radionuclides and sample phase.
The Tukey test detected the trend of Ra-228 to have higher concentrations than Ra-226, and this was corroborated by the Z test. Thus, Table 3 reports Ra-228 as the only representative of the group of highest activity (A); it is also predominant in the group of intermediate activity AB (8 hits in 11, 73%) but uncommon in the group of lowest activity B (3 in 12, 25%).
In relation to the phase of the radionuclide, values showed no trend. On the contrary, the univariate analysis (Tukey test) identified differences between the collecting points, forming groups of similar activity concentration.
Complementary information was achieved using multivariated analysis. Thus, the PCA technique was used here as a tool to evaluate the possibility of grouping the collecting points depending of the environmental variables radionuclide and phase. Indeed, PCA enabled to ordinate the six collecting points in four groups (Figure 3): one associated the six points with 226Ra in the soluble phase; a second the six points with 226Ra in the particulate phase and a third the six points with 228Ra in soluble phase. Finally the fourth group associated the points with 228Ra in the particulate phase. In the latter group, two points (01 and 06) are quite distant producing an irregular group, different from the other three which are nicely homogeneous.
Thus on the whole, PCA was a good method for the ordination of data from monitoring points using concentration of activity of radionuclides and sample phases as parameters.
The combination of univariate and multivariate statistical analyses enabled to assemble a more comprehensive analysis of pre-operational environmental monitoring at the Santa Quitéria phosphate with NORM mine, affording complementary information that only one class of statistical analysis cannot furnish.
Data from this study represent the values of activity concentration in the region before the beginning of the operation of the mine (background). The mine operation inevitably will affect the overall picture presented here and such changes will need to be analyzed in order to assess major concerns relative to radioecology and environmental radioprotection.
REFERENCES
- E. M. Ashraf, H. A. Khater and A. L. Sewaidan, “Radiation Exposure Due to Agricultural Uses of Phosphate Fertilizers,” Radiation Measurements, Vol. 43, No. 8, 2008, pp. 1402-1407. http://dx.doi.org/10.1016/j.radmeas.2008.04.084
- P. M. Rutherford, M. J. Dudas and J. M. Arocena, “Radio-Activity and Elemental Composition of Phosphogypsum Produced from Three Phosphate Rock Sources,” Waste Management & Research, Vol. 13, No. 5, 1995, pp. 407-423.
- H. Beddow, S. Black and D. Read, “Naturally Occurring Radioactive Material (NORM) from a Former Phosphoric Acid Processing Plant,” Journal of Environmental Radioactivity, Vol. 86, No. 3, 2006, pp. 289-312. http://dx.doi.org/10.1016/j.jenvrad.2005.09.006
- I. Othman and M. S. Al-Masri, “Impact of Phosphate Industry on the Environment: A Case Study,” Applied Radiation and Isotopes, Vol. 65, No. 1, 2007, pp. 131- 141. http://dx.doi.org/10.1016/j.apradiso.2006.06.014
- N. Casacuberta, P. Masqué and J. Garcia-Orellana, “Fluxes of 238U Decay Series Radionuclides in a Dicalcium Phosphate Industrial Plant,” Journal of Hazardous Materials, Vol. 190, No. 1-3, 2011, pp. 245-252. http://dx.doi.org/10.1016/j.jhazmat.2011.03.035
- J. R. Silva, “Caracterização Hidrogeológica da Jazida de Itataia,” M.Sc. Dissertation, Universidade Federal do Ceará, Ceará, 2003, p. 126.
- National Commission for Nuclear Energy—CNEN, Standard CNEN-NN-4.01, “Requisitos de Segurança e Proteção Radiológica para Instalações Mínero-Industriais,” 2005, p. 19.
- National Commission for Nuclear Energy—CNEN, Standard CNEN-NN-3.01, “Diretrizes Básicas de Proteção Radiológica,” 2005a, p. 34.
- National Commission for Nuclear Energy—CNEN, “Standard Posição Regulatória 3.01/008:2011 Programa de Monitoração Radiológica Ambiental,” 2011, p. 5.
- National Commission for Nuclear Energy—CNEN, “Standard Posição Regulatória 3.01/009:2011 Modelo para Elaboração de Relatórios de Programa de Monitoração Radiológica Ambiental,” 2011, p. 5.
- M. García-Talavera, J. L. M. Matarranz, R. Salas and L. Ramos, “A Regulatory Perspective on the Radiological Impact of NORM Industries: The Case of the Spanish Phosphate Industry,” Journal of Environmental Radioactivity, Vol. 102, No. 1, 2011, pp. 1-7. http://dx.doi.org/10.1016/j.jenvrad.2010.08.007
- A. J. Ceteno, “Curso de Estatística Aplicada à Biologia,” Universidade Federal de Goiás, Goiânia, 1999, p. 188.
- H. G. Arango, “Bioestatística: Teórica e Computacional Com Bancos de Dados Reais em Disco,” 3rd Edition, Guanabara & Koogan, 2009, p. 438.
- M. A. Schork and R. D. Remington, “Statistics with Applications to the Biological and Health Science,” 3rd Edition, Prentice Hall, Upper Saddle River, 2000, p. 478.
- B. Rosner, “Fundamentals of Biostatistics,” 5th Edition, Duxbury Thomson Learning, Stamford, 2000, p. 792.
- D. F. Ferreira, “Estatística Multivariada,” Editora da UFLA, Lavras, 2008, p. 650 p.
- J. L. Valentin, “Ecologia Numérica. Uma Introdução à Análise Multivariada de Dados Ecológicos,” Interciência, Rio de Janeiro, 2000, p. 117.
- N. J. Gotelli and A. M. Ellison, “A Primer of Ecological Statistic,” Sinauer Associates, Sunderland, 2004, p. 510.
- J. M. Godoy, D. C. Lauria, M. L. D. P. Godoy and R. P. Cunha, “Development of a Sequential Method for Determination of 238U, 234U, 232Th, 230Th, 228Th, 228Ra, 226Ra and 210Pb in Environmental Samples,” Journal of RadioAnalytical Nuclear Chemistry, Vol. 182, No. 1, 1994, pp. 165-169. http://dx.doi.org/10.1007/BF02047980