Journal of Environmental Protection
Vol.4 No.11B(2013), Article ID:40257,7 pages DOI:10.4236/jep.2013.411B003
A Study of Environmental Assessment of Acid Mine Drainage in Ngwenya, Swaziland
![]()
Department of Chemistry, University of Swaziland, Kwaluseni, Swaziland.
Email: *caroldlmn@gmail.com
Copyright © 2013 C. L. Dlamini et al. This is an open access article distributed under the Creative Commons Attribution License, which permits unrestricted use, distribution, and reproduction in any medium, provided the original work is properly cited.
Received August 8th, 2013; revised September 10th, 2013; accepted October 7th, 2013
Keywords: Acid Mine Drainage; Sediments; Sequential Extraction; Heavy Metals; Speciation
ABSTRACT
Acid mine drainage (AMD) is an industrial pollution of prime concern for the whole world. It is the driving force for an array of water pollutants especially heavy metals. Heavy metals (Cr, Mn, Fe, Ni, Co, Cu, Zn, Pb, Cd) were investigated in this study. Water and sediment samples were collected from the Ngwenya Iron Ore Mine Quarry Dam to investigate the occurrence of AMD phenomenon in the old mine. The main Fe compounds found in the Ngwenya Mine ore are haematite and pyrite. The Quarry Dam is located in one of the mine pits and it has neither visible inlet nor outlet. Physico-chemical parameters (pH, EC, ORP, T) were determined in the water by Electrochemical methods using the WTW 340i probes. Anions in the water were quantified by Ion Chromatography (IC) whereas heavy metals in water and sediments were quantified by Flame Atomic Absorption Spectrometry (FAAS). The BCR-Sequential Extraction procedure was used to speciate the heavy metals in the sediment samples. The mean pH of 4.34 in the Quarry Dam water is comparable to the pH of other AMD polluted water. The high mean EC of 4.522 mS/cm depicted that the water was laden with ions which are dissolved from the ore by the AMD. The sulfate ion, a well-known indicator for AMD pollution in water, is the second dominant anion where the order is  >
>  > Cl−. The heavy metal levels in water and sediments were in the order Co > Ni > Cr >Zn > Mn > Cu > Fe > Cd > Pb and Fe > Mn > Cr > Ni > Pb > Co > Cd > Cu > Zn respectively. The heavy metals are all bioavailable, hence they are potential health risks to both biota and residents in the vicinity of the mine. The pH of the water in the Quarry dam is comparable to those obtained for some other AMD polluted water. It is inferred that AMD is being produced in the old mine. It is recommended that an Environmental Impact Assessment of AMD must be carried out before the mine is re-opened.
1. Introduction
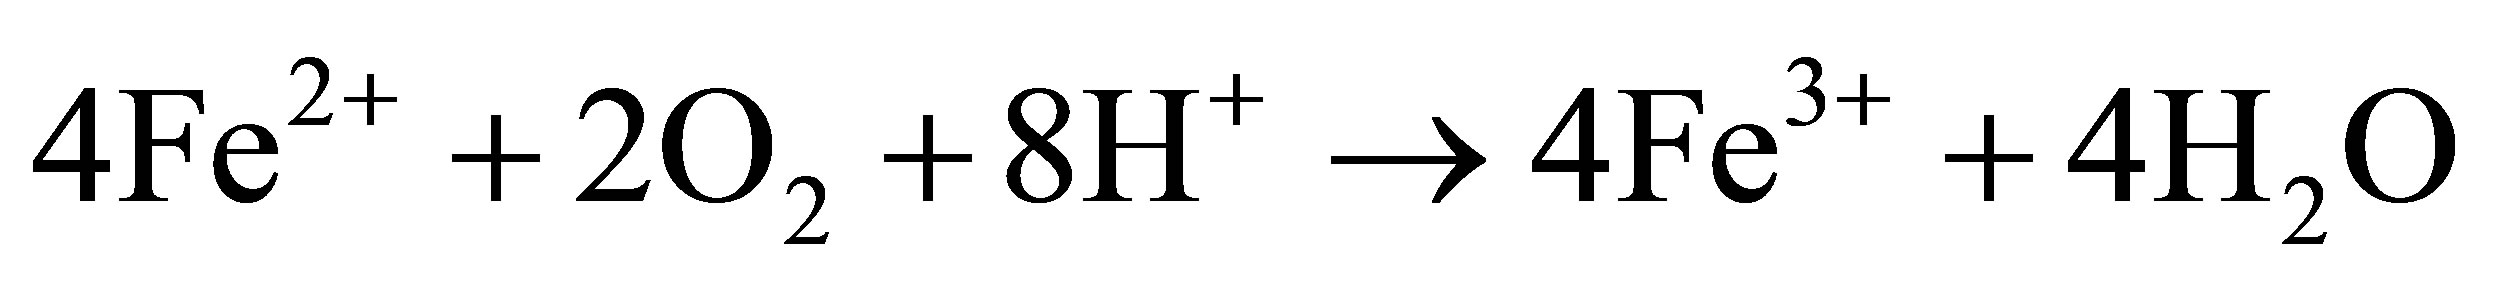
The matrix of natural waters, such as the surface freshwaters, contains extremely complex and dynamic chemical and biological systems [1]. Its components include total dissolved solutes, natural organic matter and particulate matter. Usually several chemical reactions occur between these components including heavy metals dissolved in trace amounts in the water as well as in the underlying sediments. The distribution of heavy metal contaminants within the water body and its components determines the geochemical and biological reactivity of the aquatic system. Heavy metal dissolution is usually enhanced by low pH in natural water. Very often observed low pH in surface water bodies is a consequence of acid mine drainage pollution. This is a feature which is typical of both abandoned and live mines, but sometimes occurs naturally [2]. Metal extraction always involves removal of rocks from underground hence exposing them to attack by air and water. When these rocks contain metal sulfides, especially iron disulfide (FeS2) which is pyrite and/or marcasite, they become oxidized by air and water producing Fe2+, H+ and  ions [3,4]. When these ions get into solution, sulfuric acid is produced rendering the water acidic. Equations (1.1)-(1.3) below summarize the oxidation of pyrite:
 (1.1)
(1.1)
![]() (1.2)
(1.2)
 (1.3)
(1.3)
This acidic effluent produced during the mining process is called ‘Acid Mine Drainage’ (AMD) [5,6]. AMD is a major pollutant resulting in enhanced acidity of water bodies wherever it exists [7].
Acid mine drainage is a major driving force responsible for heavy metal pollution. AMD causes metals trapped in geologic material in the mineral ores to be released into the environment thereby rendering them available for ecological uptake [8]. Ecological systems are upset by acidic water [9,10]. Heavy metals are of high environmental concern because they cannot be removed from aquatic systems by self purification but instead accumulate in the underlying sediments where they can enter the food chain through biomagnifications [11]. As a result, sediments are a sink as well as a source of heavy metal contaminants [1,11]. They reflect the quality of a particular surface water body by providing information on transport pathways and ultimate fate of a pollutant. To protect the aquatic environment, the assessment of the severity of sediment contamination is of prime importance. This cannot be achieved by only quantifying the total heavy metal contents in the sediments but also by speciating those to determine the specific fractional amount available for biological uptake. Speciation is the determination of the different forms of an element which sum up to its total concentration in a sample. The heavy metals can be fractionated into four broad phases or fractions [12,13]. Fraction 1 (exchangeables) are metals bound as carbonates and are the easily available to biota. Fraction 2 (reducibles) are metals bound as hydroxides and oxides of Fe and Mn. Fraction 3 (oxidisables) are the metals that form complexes with natural organic matter which consists of humic and fulvic acids. Fraction 4 (residual) consists of metals bound to the mineral matter and is not bioavailable. The first three fractions are the bioavailable portion of the total metal content whilst the fourth constitutes no threat to the environment as no natural condition can be harsh enough to release the heavy metal from mineral binding [13].
In the old Ngwenya Iron Ore Mine, the rocks that were exposed during the mining operations on the walls of the pit are exposed to attack by water containing dissolved oxygen. If the rocks in contact with such water contain pyrite or metal sulfides, an acidic effluent would be produced. The main Fe compounds that are found in the Ngwenya Mine ore are haematite and pyrite. Therefore, it is of paramount importance to investigate the Quarry Dam for AMD pollution. AMD would increase the dissolved heavy metal load in the water hence rendering them labile to contaminate the environment. No previous study on AMD has been conducted and documented in Swaziland hence the necessity of this work. The objective of this study was to investigate the occurrence of acid mine drainage phenomenon in the old Ngwenya Iron Ore Mine. This was achieved by the determination of some physico-chemical properties and anion abundance in the water, the investigation of some heavy metal levels in the water and sediments, and the potential risks of sediment bound heavy metals to biota.
2. Materials and Methods
2.1. Description of the Study Area
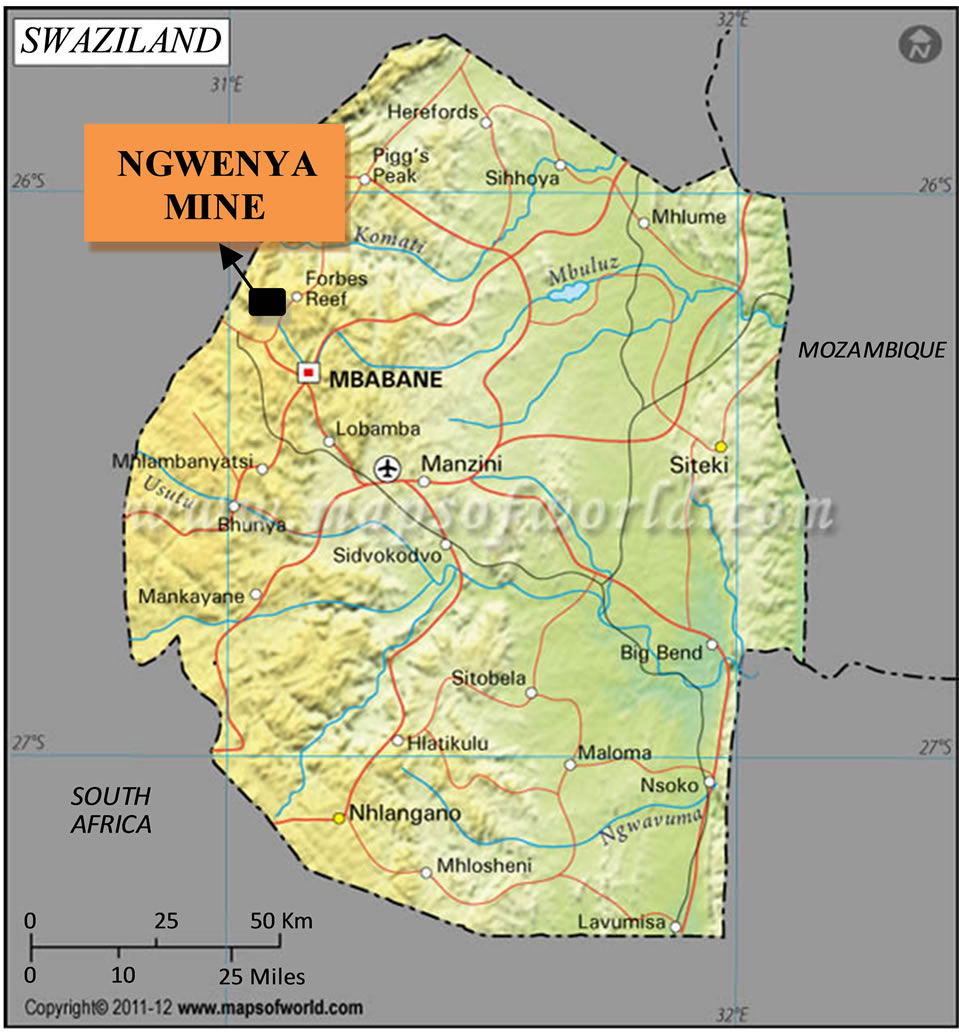
The Ngwenya Iron Ore Mine is dated from 43,000 B.C. and is located in the Hhohho Region of Swaziland [14]. It is in the North-Western boarder of the country between latitude 26˚11'15"S and 26˚13'45"S and between longitude 31˚00'30"E and 31˚03'00"E (Figures 1(a) and (b)). It is located on the Ngwenya Mountain with an altitude of 1829 m. The haematite was mined by the open pit method. This mine was the sole producer of iron ore in Swaziland from 1964 to 1979 when it closed down. There are three mine pits in the mountain and one of them has water. According to the Swaziland National Trust Commission (SNTC), the water extruded from underground and stopped the excavation in that pit [14]. This pit with water is what is now called the Ngwenya Mine Quarry Dam (Figure 1(c)) which has an estimated area of 4500 m2 and a depth of about 12 m.
2.2. Sampling Design, Collection, Preservation and Pretreatment
A total of 44 water samples and 25 sediment samples were collected from the Quarry Dam with the aid of a boat. The water samples were collected into 1 L polyethylene prewashed bottles. Prior to sampling, the bottles were soaked in a soap solution overnight. After rinsing with tap water, they were soaked in aqua regia overnight. The sample bottles were rinsed with distilled water first to remove the acid, then three times with deionized water. These were kept upside down to drain. After drying, the sample bottles were kept in a plastic bag to protect them from dust accumulation. After collection, the water samples were kept under ice in a cooler box and then transported to the laboratory where they were kept in a chest freezer. About 1 kg each of the sediment samples were collected using an auger, then extruded into clean plastic bags. These were securely tied and put in a cooler box before transportation to the laboratory where they were kept in a chest freezer.
2.3. Experimental
Upon arrival in the laboratory, the water samples were analysed for physical parameters i.e. pH, electrical conductivity (EC), Redox Potential (ORP) and temperature using WTW 340i probes. The water samples were filtered through 0.45 µm polymer membrane and then kept
 (a)
(a)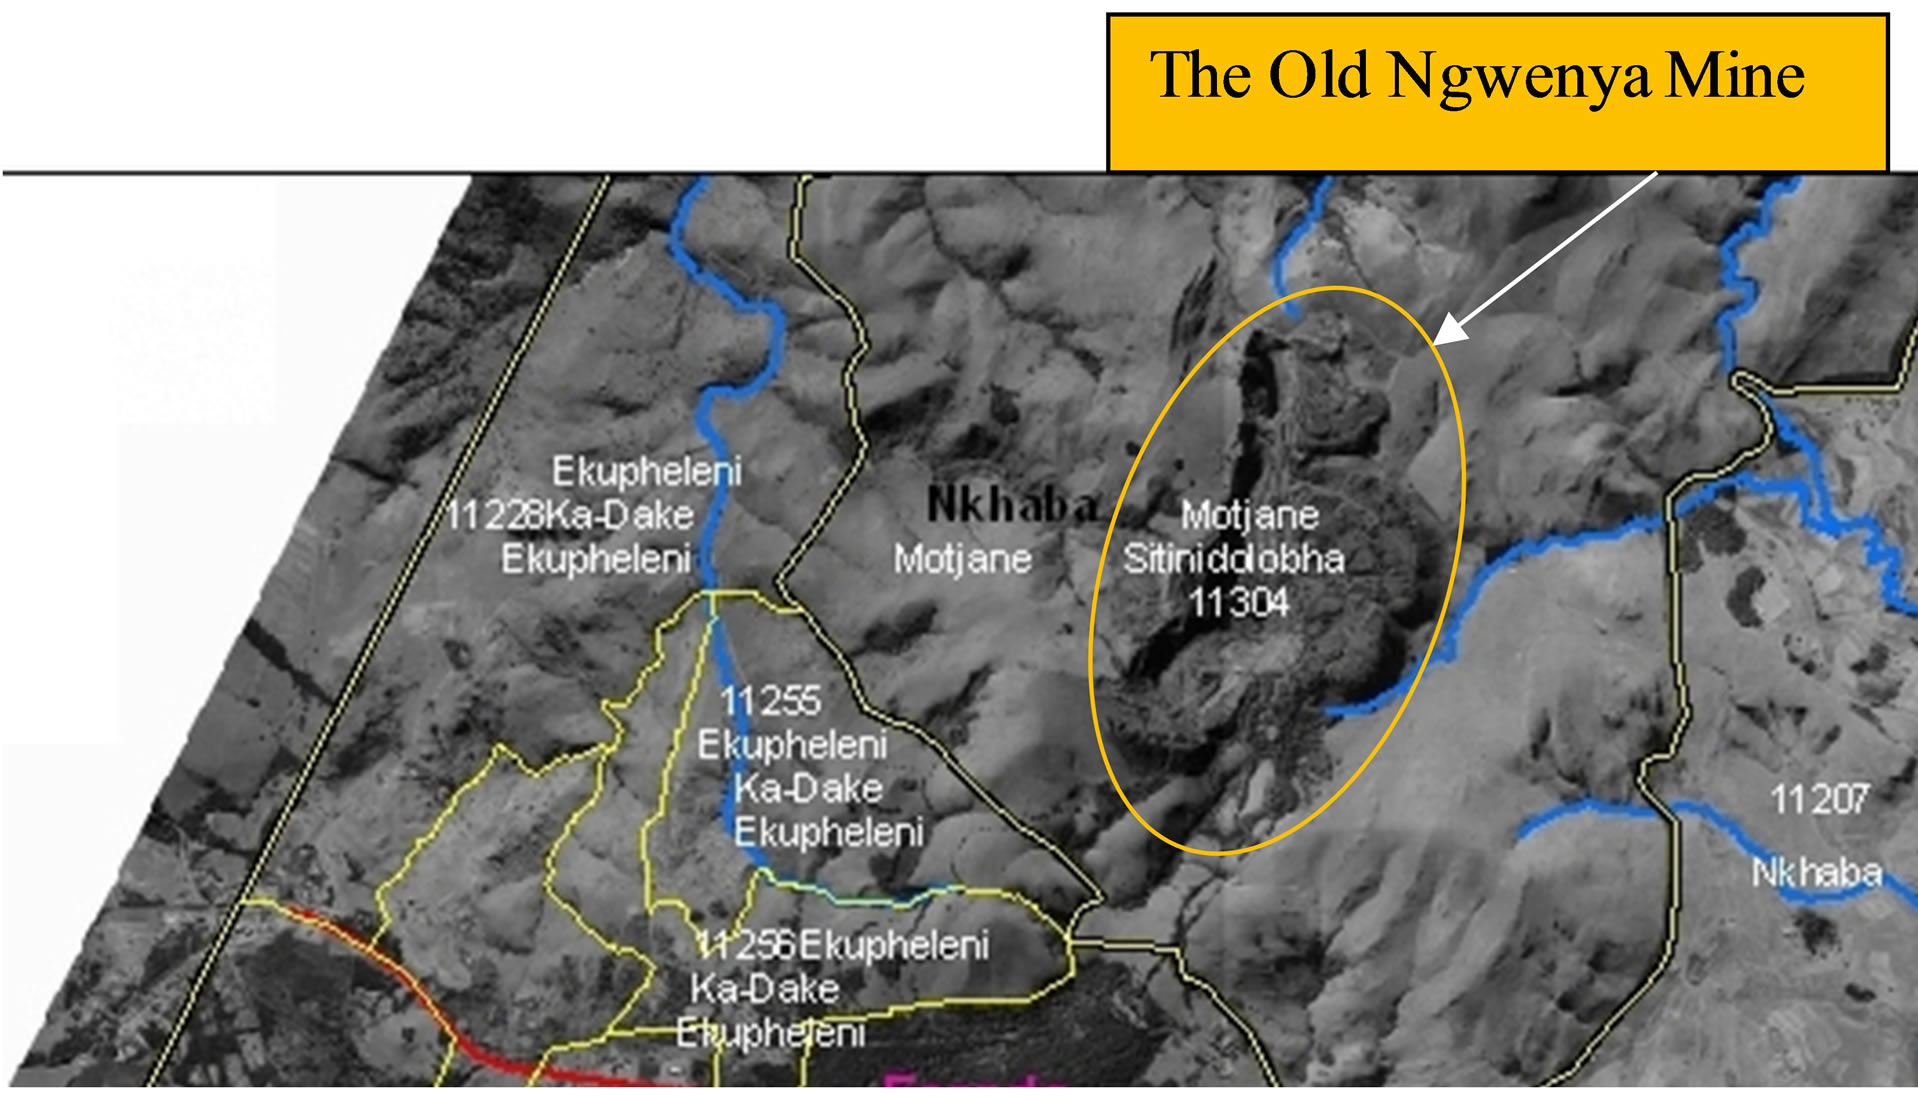 (b)
(b)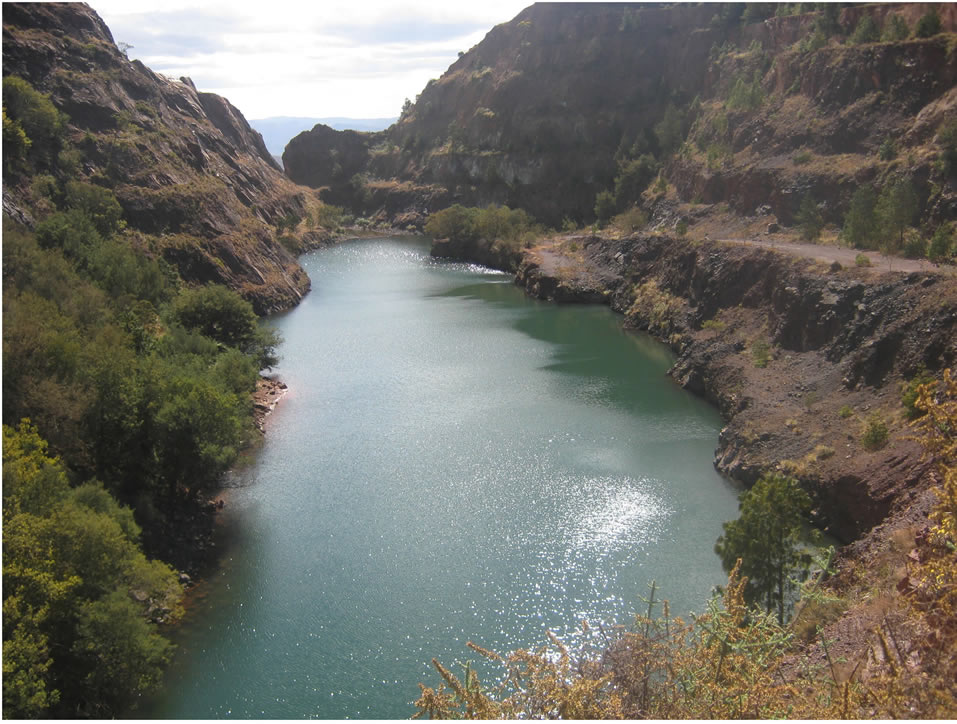 (c)
(c)
Figure 1. (a) Map of Swaziland showing the position of the Ngwenya Mine; (b) Part of the map of Swaziland showing the Ngwenya Mine and streams in its vicinity; (c) The photograph of the Quarry Dam in the mine pit.
in the freezer for analysis. The anions (F−, Cl−, Br−,  ,
,  ,
,  ,
, ) were analyzed in the filtered water samples using Ion Chromatography (model: Metrohm, 861 Advanced Compact IC) which was set at 17 minutes analysis time for each sample. A multi-standard for the seven anions was used to calibrate the instrument for the analysis. Analysis of the heavy metals (Cr, Mn, Fe, Ni, Co, Cu, Zn, Pb, Cd) was carried out using a Varian AA240FS flame atomic absorption spectrometer. The air/acetylene flame was used.
The sediment samples were each dried in an oven for 24 hrs at 120˚C thereafter cooled in a dessicator. The cooled dried sediment samples were ground with pestle and mortar then passed through 90 µm and 53 µm Modison Test sieves. The smallest particle size was used for analysis. A 0.500 g of each sediment sample was acid digested with 3 ml each of 40% HF and 55% HNO3 acid mixture in a 10 ml HACH digesting tube in a heating block at 105˚C. The supernatant obtained after 72 hours was diluted in the ratio 1:10 with deionized water and kept in the freezer until analysis. The analysis of the heavy metals was carried out using FAAS with instrument operating parameters indicated in Table 1. Another 0.500 g of each sediment sample was weighed into 50 ml centrifuge tube and extracted sequentially into four fractions i.e. the exchangeable (0.11 M CH3COOH), the reducible (0.5 M NH2OH HCl), the oxidisable (H2O2 30% and 1 M CH3COONH4) and the residual (40% HF, 55% HNO3) fractions using a modified method from Tessier et al. [15]. The fractions were each analysed for the nine selected heavy metals using FAAS with the specifications in Table 1.
3. Results and Discussion
3.1. Physico-Chemical Parameters
The pH, EC, ORP and temperature were determined in the water samples. The results obtained are given in Table 2. The Eh was calculated from ORP using Equation 3.1 [16].
 (3.1)
(3.1)
From Table 2 the mean values obtained were: pH = 4.34, ORP = 279.43 mV, EC = 4.52 mS/cm and the mean temperature when ORP was measured was 22.46˚C. The Eh calculated from the mean ORP was 525.11 mV. The mean pH of 4.34 depicted that the water was acidic. Concas et al. [2], concluded that low pH of 4.45 and 4.73 in studied water samples is a consequence of AMD. Low pH is a result of pyrite oxidation [17]. The mean EC of 4.52 mS/cm was quite high, indicating that the water was metal laden and contains high ionic species that conduct the electricity. Dissolved heavy metals are enhanced in acidic waters. The Eh-pH speciation diagram in Figure 2
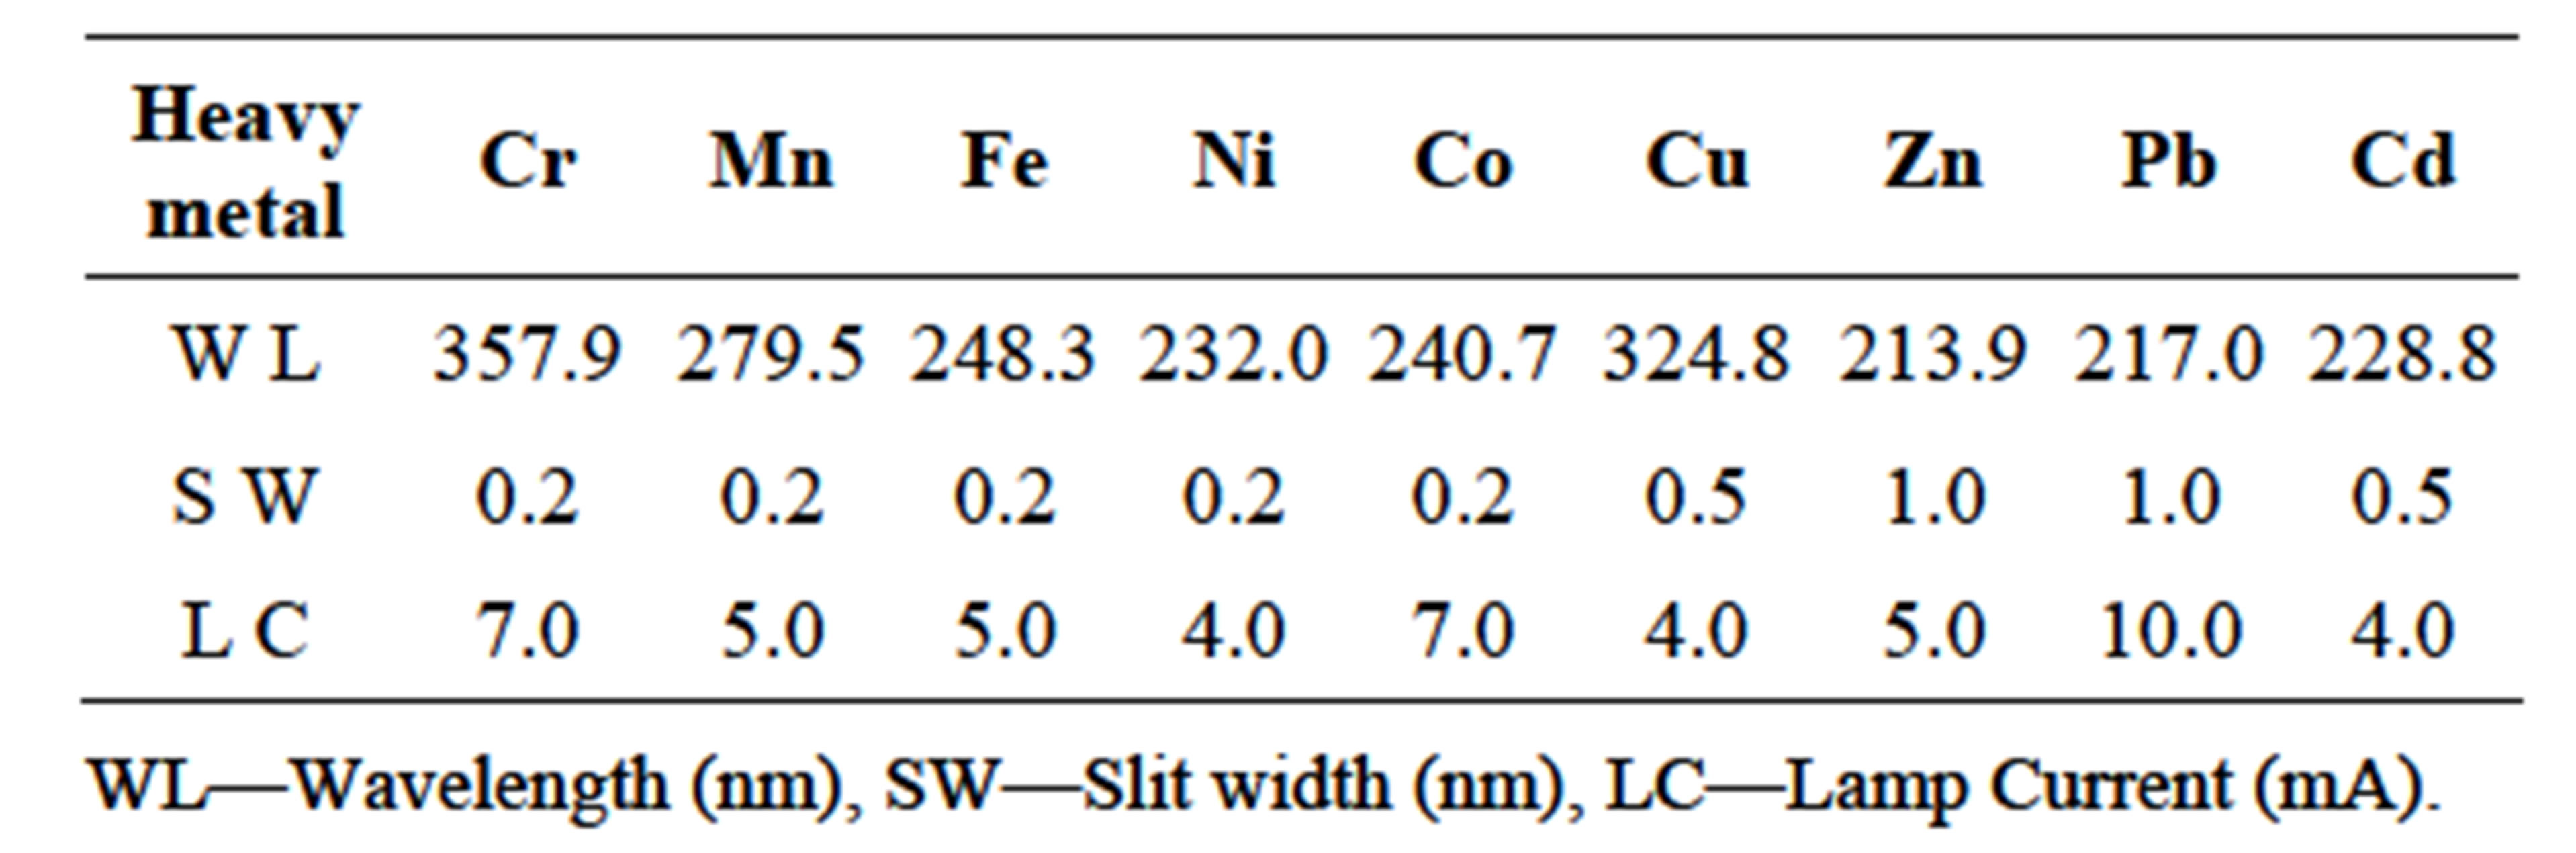
Table 1. Instrument operating parameters used in the analysis of respective heavy metals.
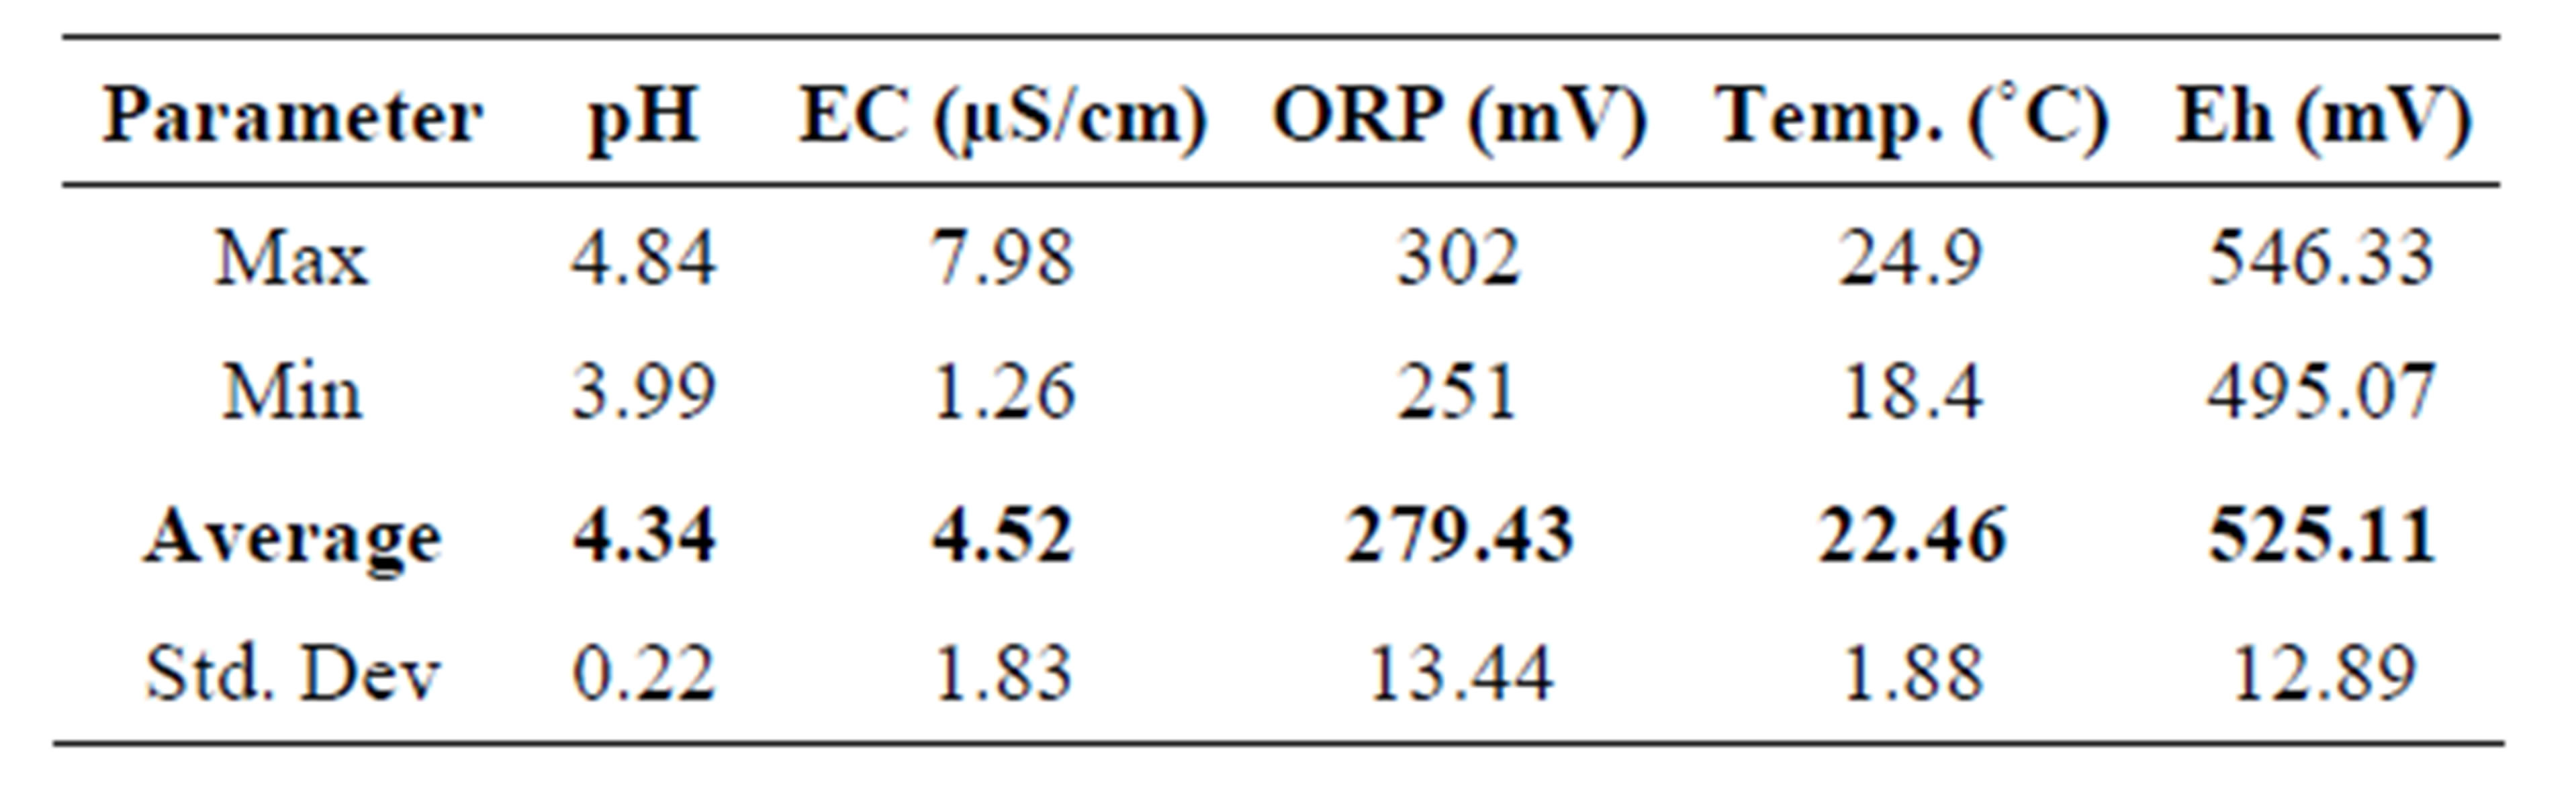
Table 2. The physico-chemical parameters of the water samples from the Quarry Dam.
was used to plot the experimental mean Eh against mean pH obtained from the experiment. The point of intersection shows that the dominant Fe species in the water is the ferrous ion. The Fe2+ ion is the immediate product of pyrite oxidation. In conclusion, all these observations indicate that the AMD phenomenon occurs in the Ngwenya Mine Quarry Dam.
3.2. Anions in Water
The dominant anion levels (ppm) in the Quarry dam water were in the order  (22.29) >
  (13.25) > Cl− (11.37) whilst Br−, F−,
  and
and  were not detectible. The
  ion is an indicator anion for AMD pollution because sulfates are not affected by change in pH. Often the main source of
  ions in water bodies are fertilizers applied in fields. There are no fields at the top of the mountain where the Quarry dam is located. This implies that the nitrates must be from some natural sources. The tree species that surround the dam is mainly the wattle tree (acacia mearsii) which is leguminous; hence it most likely fixes nitrogen from the air into the soil as nitrates. Nitrates are absolutely not soil adhesive implying their high mobility in soil, so they are easily leached from the banks of the dam into the water. This is an expected behaviour from the nitrates as they are highly soluble in water and are hydrophilic. In this way the
  ions accumulate in the upper part of the dam which has no visible outlet. Nitrates have the tendency of moving down gradient but move very slowly vertically to the depth of stagnant waters.
3.3. The Kolmogoroff-Sminoff Test for Normality
This was employed to test for the normality of the heavy metal distributions in the Quarry Dam. Manganese concentrations were standardized by converting them to z values and then comparing them with a standard normal distribution. The z values were found in Statistical Tables. The Kolmogoroff-Sminoff (K-S) test involves comparing the cumulative frequency curve of test data and that of hypothesized distribution. The two curves were overlaid on a graph. The maximum vertical difference between them was found and compared with the tabulated value for the same number of samples. A typical example of the K-S plot for the concentration of Mn in water samples is given in Figure 3.
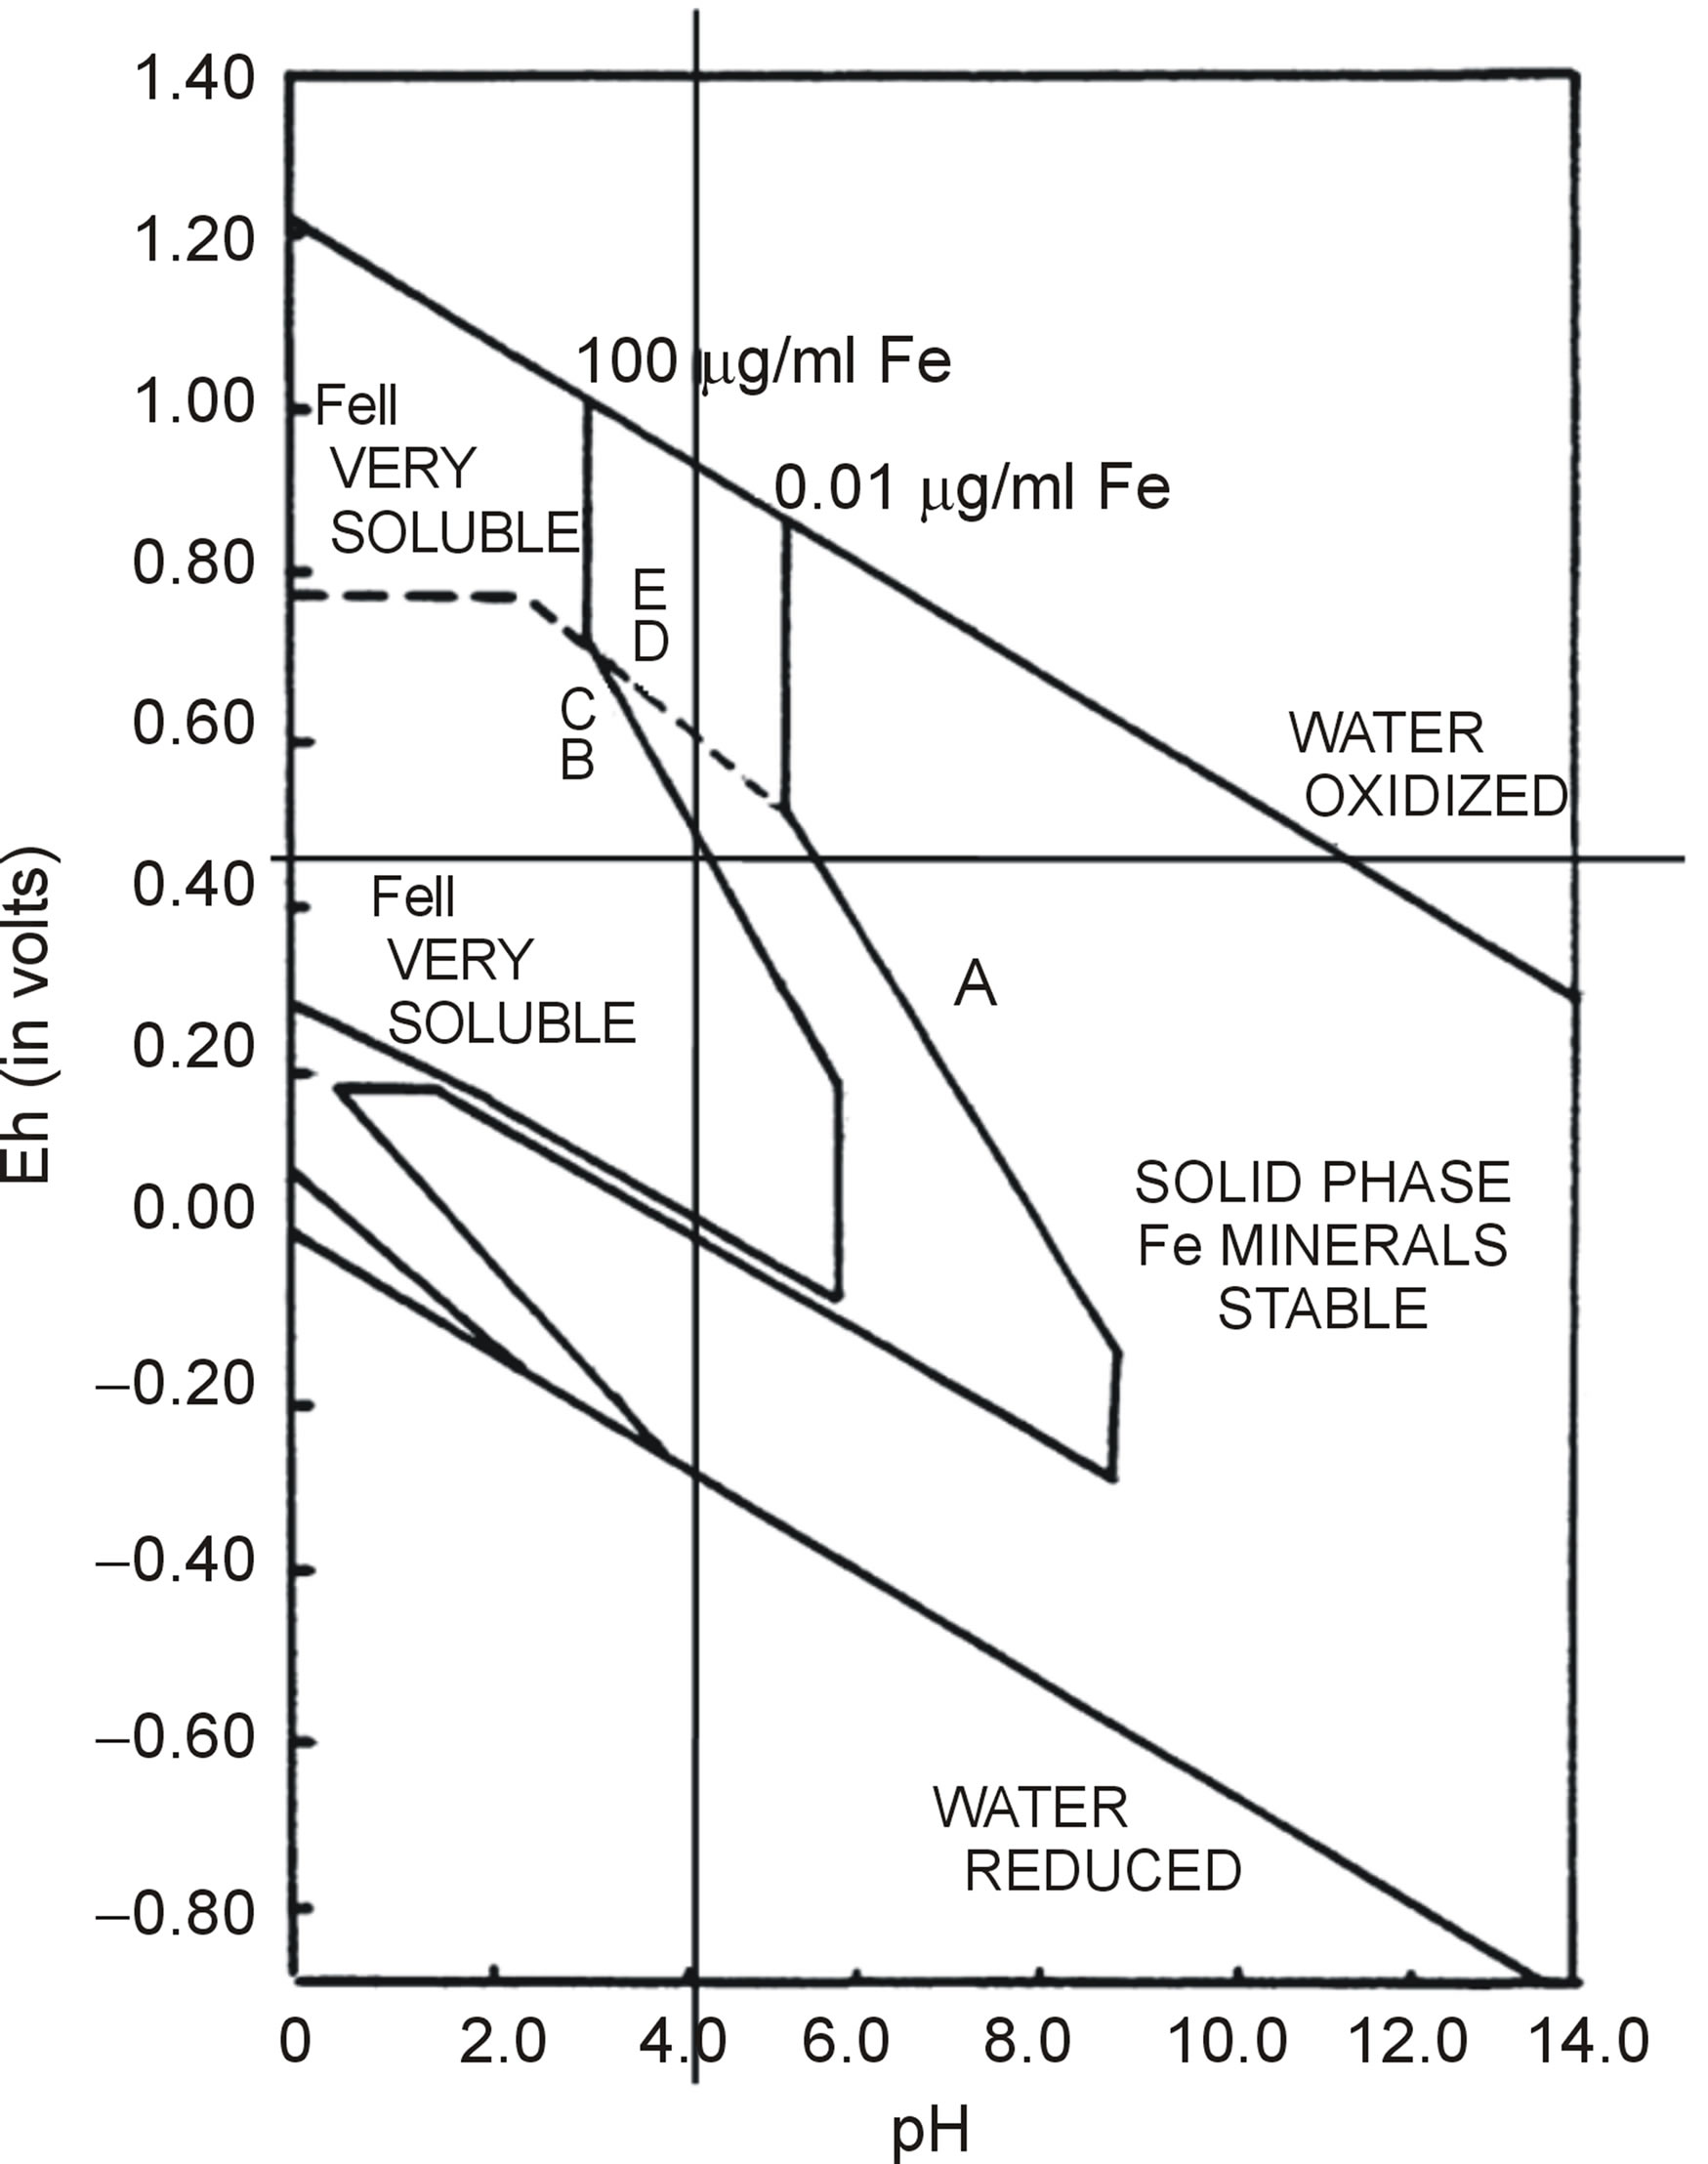
Figure 2. The Eh-pH diagram for the speciation of iron in water (source: Bigham et al. [16]).
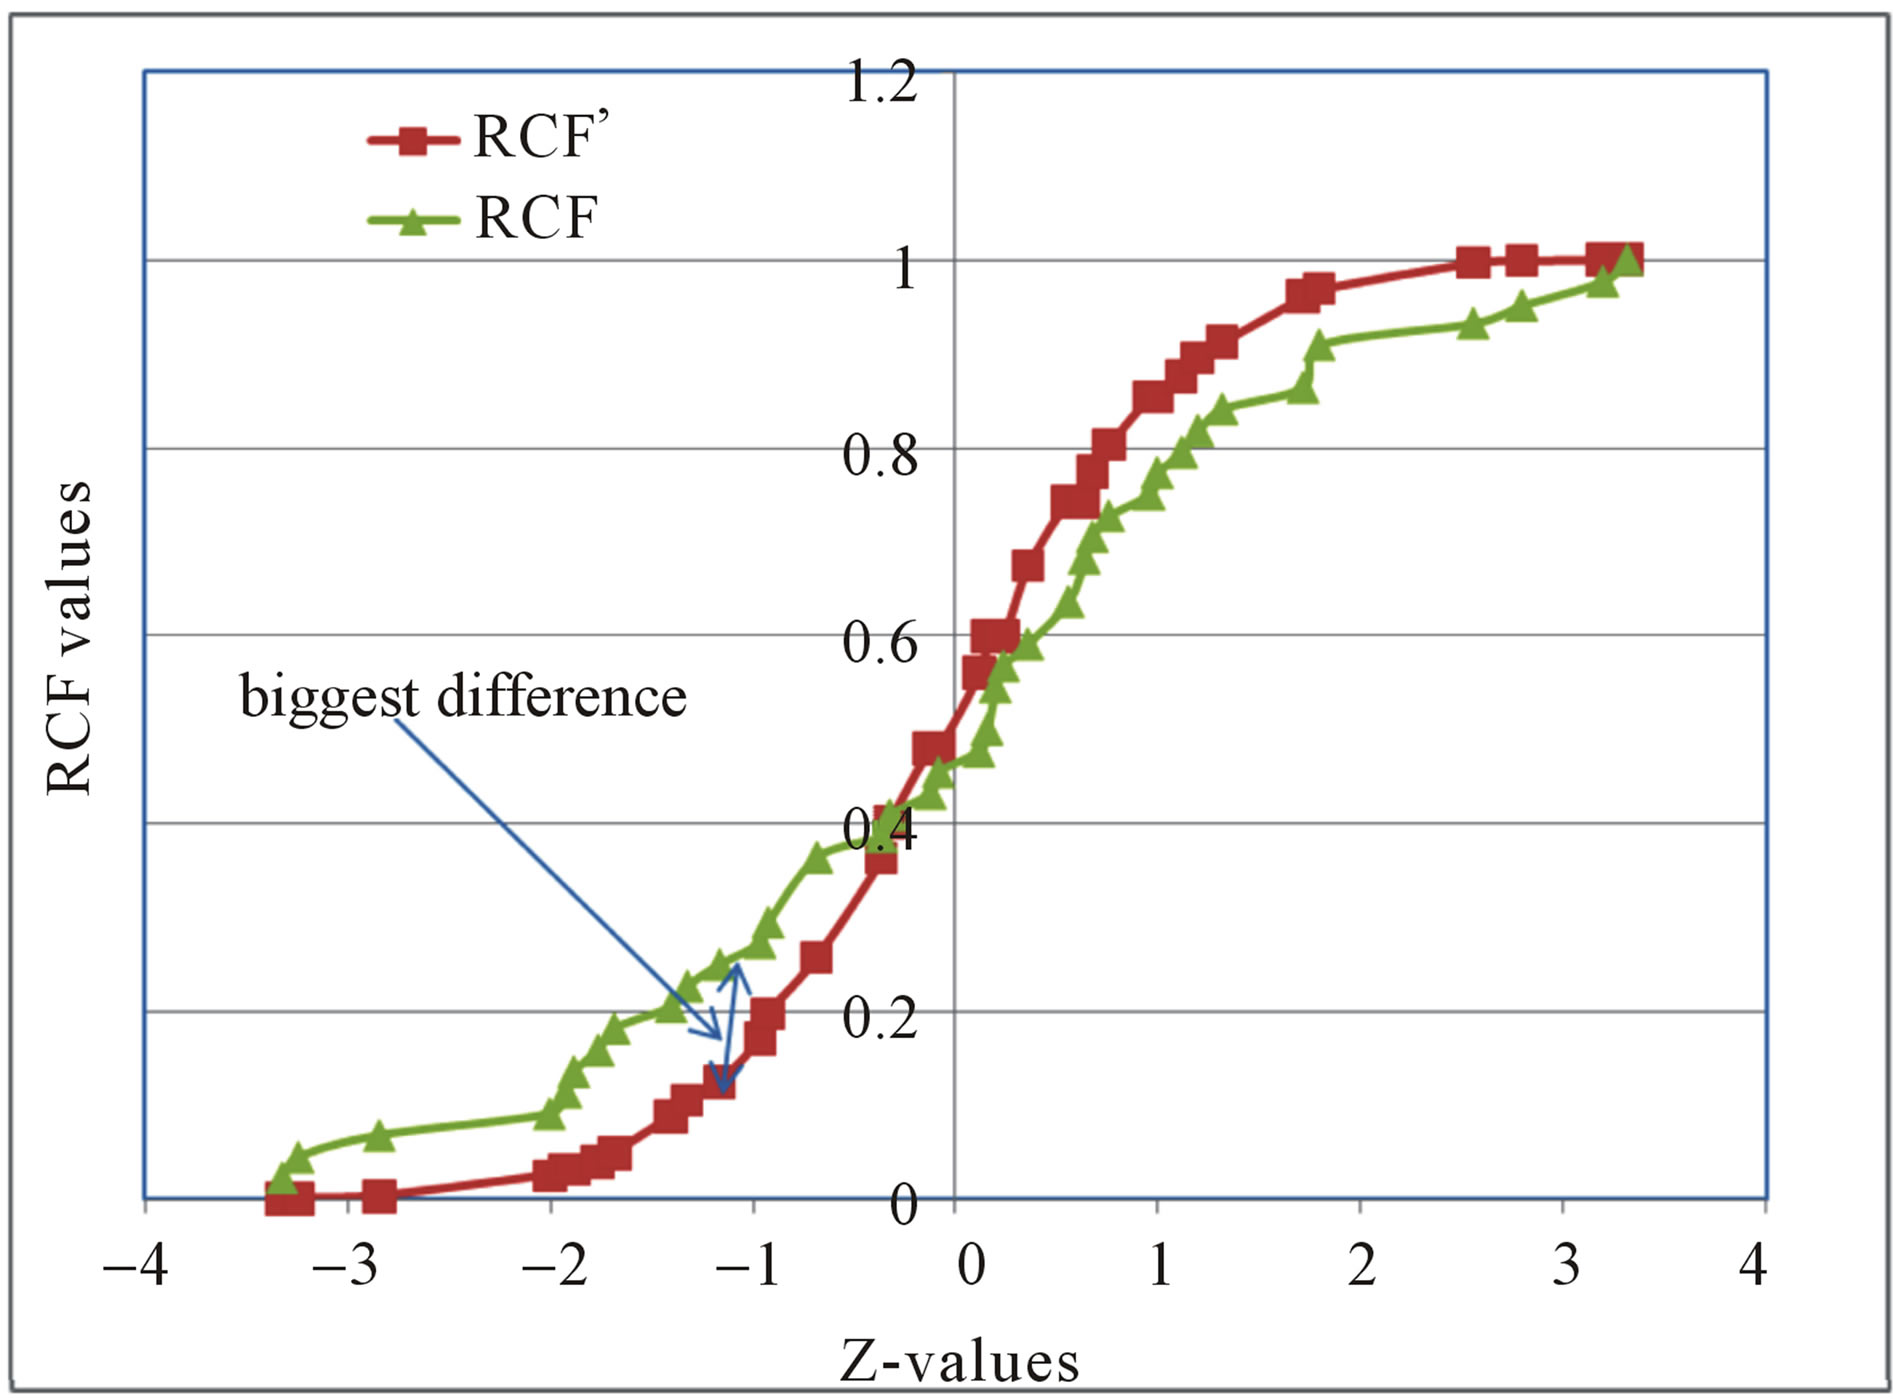
Figure 3. The K-S test results for Mn in water samples. RCF’-expected relative cumulative frequency. RCF-experimental relative cumulative frequency.
The biggest difference between the observed relative cumulative frequencies (RCF) and the expected relative cumulative frequencies (RCF’) was 0.1249. This is less than the tabulated difference which is 0.1866. Since the critical value for normality at 95% confidence limit obtained from Statistical Tables for n = 44 (n = number of samples) was greater than the calculated value, then the distribution was normal i.e. Gaussian. Therefore, concentrations of all the analyzed heavy metals were reported as averages.
3.4. Heavy Metals in Surface Water
Table 3 shows the mean levels of some heavy metals in the Ngwenya Mine Quarry Dam. The levels of the heavy metals in the Quarry Dam water were in the order:
Co > Ni > Cr > Zn > Mn > Cu > Fe > Cd > Pb.
The Co cation (8.6025 ppm) was the most abundant, whilst Pb (0.0554 ppm) was the least abundant ion. It was only Fe, Cu and Zn levels which were below the maximum permissible limit as set by WHO 2008 [18]. The water in the dam was polluted by Cr, Mn, Ni, Co, Pb and Cd.
The quarry dam has a high potential for pollution by the AMD because it receives raw mine dumps through runoff. Additionally, it has in-place geologic raw materials capable of initiating AMD production.
3.5. Total Heavy Metals in Sediments
Changes in properties of the overlying water column cause dissolved heavy metals to precipitate and accumulate in the sediments. Thus, the matrix of sediments gives a better picture about previous interactions in a water body than the rapidly changing water itself. Heavy metal levels (mg/kg) in the Quarry Dam sediments were in the order: Fe (23791.30) > Mn (6840.93) > Cr (128.08) > Ni (55.23) > Pb (47.54) > Co (28.29) > Cd (16.70) > Cu (10.58) > Zn (10.08). Thus Fe is the most abundant among the analyzed heavy metals while Zn is the least abundant. This observation fully supports the idea of Fe being the element of main interest during AMD analysis. The respective mean levels, range and standard deviation of the heavy metals in the sediments are depicted in Table 4.
The fairly high level of Pb, 5th highest, is most likely due to contribution from the automobile exhausts of tourists to the Quarry Dam. All the other heavy metals are associated with ore minerals so they must have been released from the geologic material of the mine by acid drainage.
3.6. Speciation of Heavy Metals in Sediments
Speciation studies of metals allow for the analysis of the levels of the heavy metals in different fractions of soil and sediment samples [19]. The BCR-sequential extraction method speciates the heavy metals in the sediments into four fractions. The first three fractions are of utmost interest to the environmentalist as they give the estimate of the amount of heavy metals available for absorption by ecological materials. The amount of any heavy metal concentration available depicts the toxicity level for that particular metal. The non-bioavailable portion, fraction 4 called the residual, poses no threat to the environment. In this work, Table 5 shows that most of the heavy metals were found in the residual phase. This observation is in line with other similar studies [20]. This fraction has been left out in Figure 4 as it would overshadow the bioavailable part which is of interest. Thus, the 3 bioavailable fractions’ ratios are shown on Figure 4.
The exchangeable fraction (F1) indicates the level of the heavy metal most easily available to biota. All the studied heavy metals are labile to contaminate the environment. F1 is an indicator of the degree of mobility of the metal. The percentages of the F1 in the heavy metals were in the following order: Cu (42%) > Co (40%). > Ni (33%) > Mn (29%) > Cd (27%) > Pb (19%) > Cr (16%) > Fe (15%) > Zn (7%). Most of the bio-available components of the heavy metals exist as oxides. This is evident of the fact that all the heavy metals have higher levels in the easily reducible fraction as shown by Figure 4. This observation is in agreement with other similar studies [20,21]. Oxides of Fe and Mn are scavengers of trace metals and are thermodynamically unstable in reducing environments [20,22]. This means that anoxic conditions favour metal release into the environment while oxic conditions retain them in the reducible phase. Thus, the levels of heavy metals in the reducible fraction are influenced by the quantity of Fe and Mn available in the sediments. Mn, Zn, Pb and Cd were bound more to natural organic matter than to carbonates as indicated by their abundance in the oxidisable fraction. The high organic
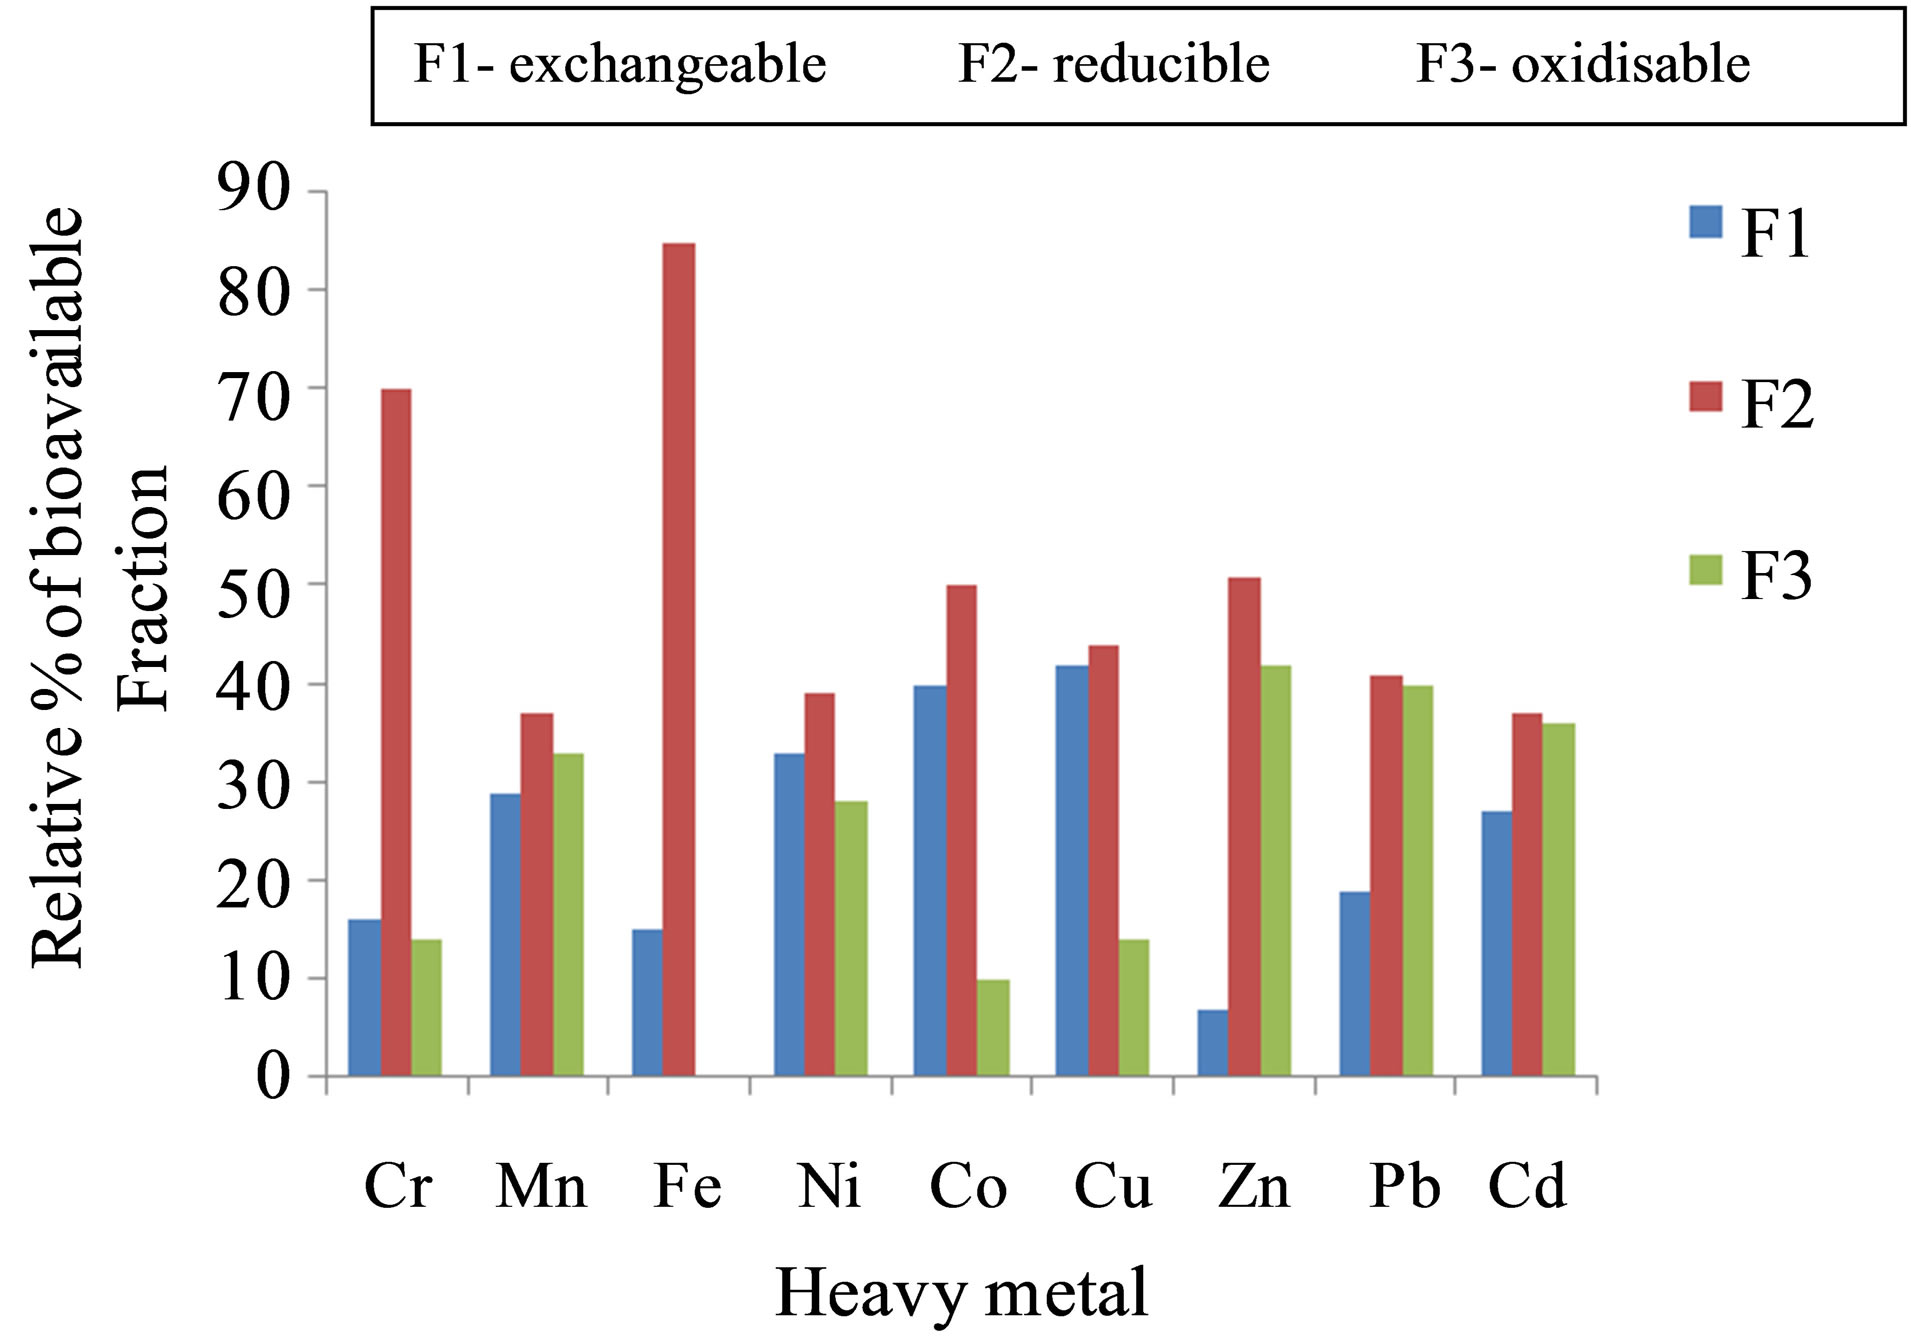
Figure 4. % mean levels of heavy metals in the bioavailable fractions in the Quarry Dam sediment samples.
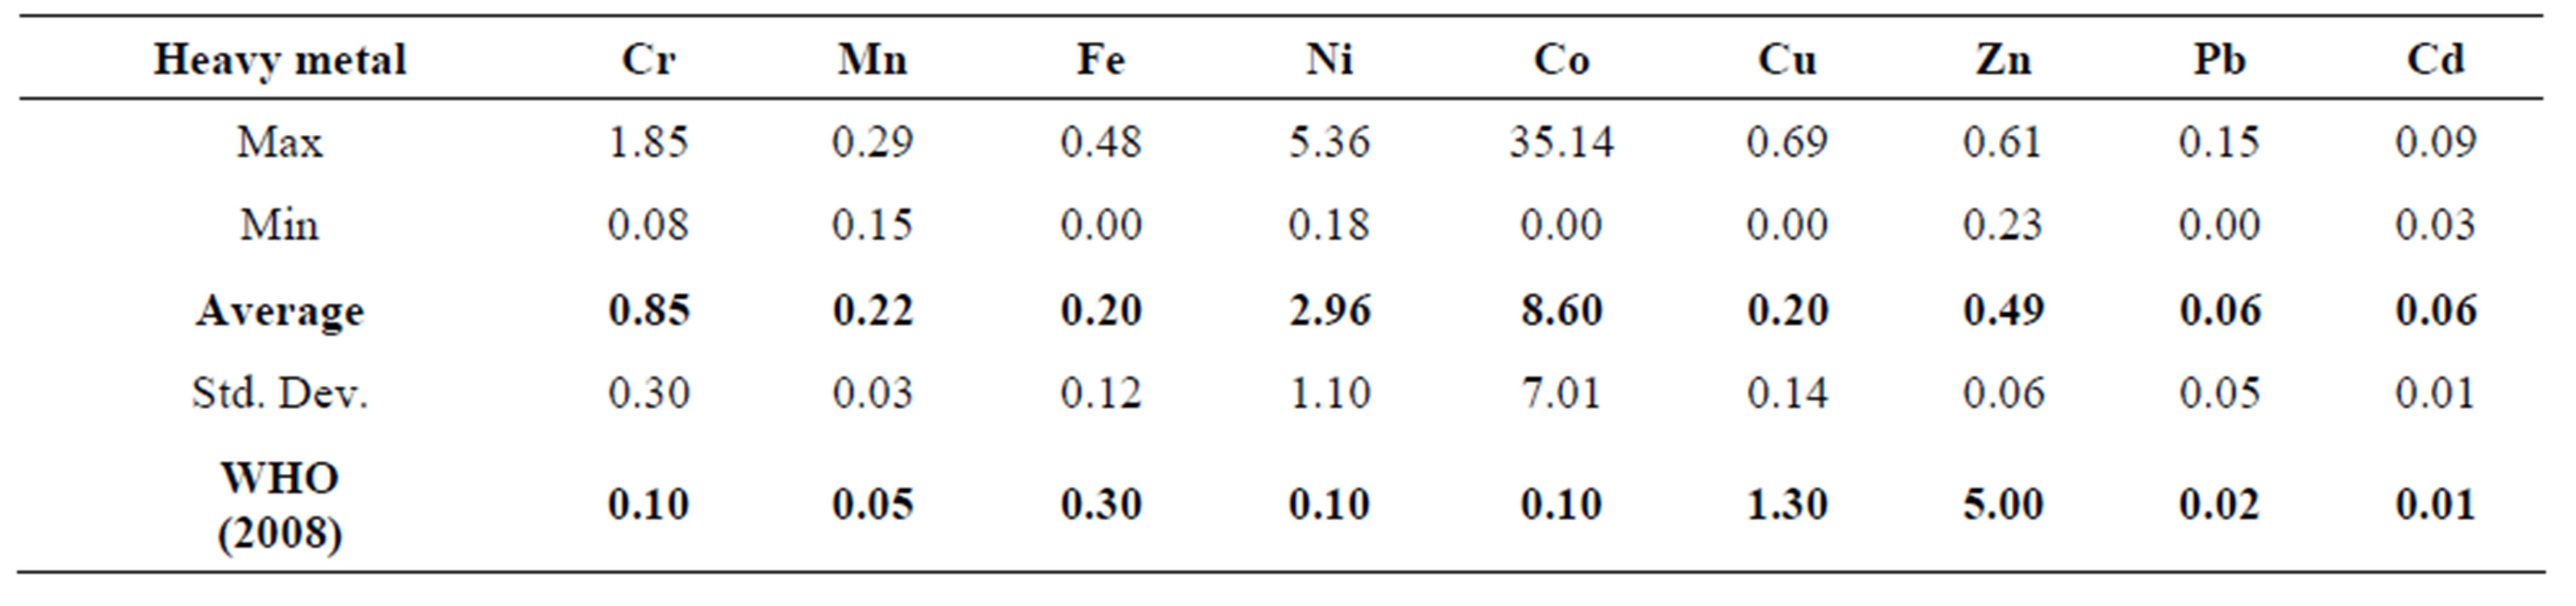
Table 3. Averages, standard deviations, ranges and guideline levels (ppm) of heavy metals in the Quarry Dam water.
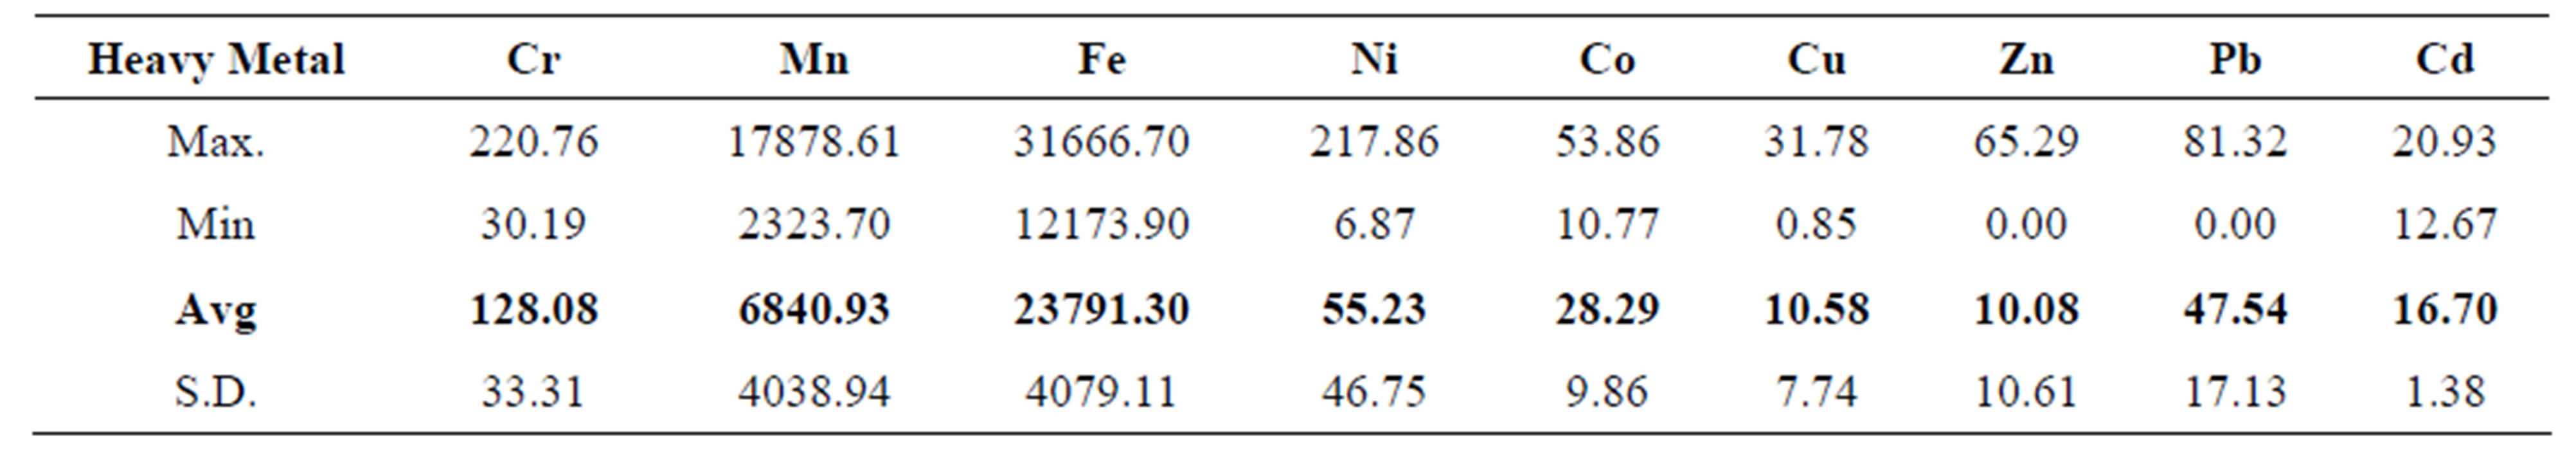
Table 4. Range and mean of total heavy metal levels (mg/kg) in the Quarry Dam sediment samples.
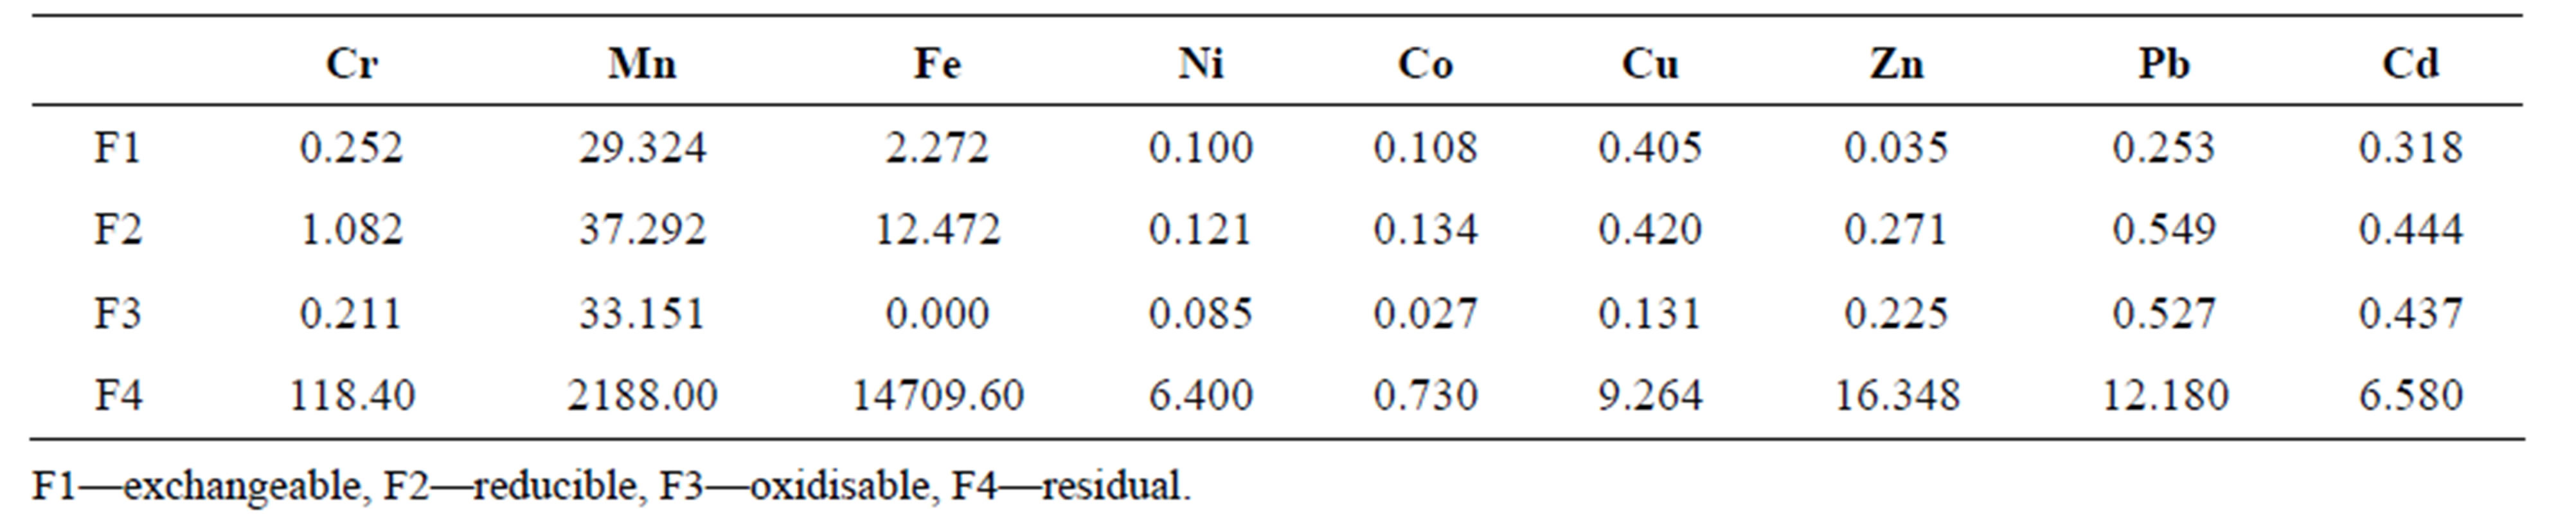
Table 5. Mean heavy metal levels (mg/kg) distribution among the four fractions obtained by BCR-sequential extraction.
matter in the quarry dam must be from the vegetation hanging over it.
4. Conclusion
The Ngwenya Iron Ore Mine Quarry Dam was used as the study site to establish whether or not AMD was produced in the old mine since it is located in one of the mine pits. Presumably it receives the acidic effluents from the ore lining the dam. The mean pH was 4.34, implying that the Quarry Dam water was acidic. This observation is supported by the fact that the water in the quarry dam was heavily laden with dissolved metal ions since metals dissolve in acidic media. The dissolved metals also accounted for the observed elevated electrical conductivity with a mean value of 4.52 mS/cm. The acidic water was most probably a result of AMD pollution. Thus the acid mine drainage phenomenon occurs in the old Ngwenya Iron Ore Mine. The Fe2+ was the prominent Fe species in the water. This provides an additional evidence of AMD production in the dam as Fe2+ ions are one of the immediate products of pyrite oxidation. The presence of the  ion in the water is another indicator of AMD pollution because sulfate ions are not affected by change in pH. The distribution of heavy metals in the water was Gaussian thus averages were used to present the data. Heavy metal levels were higher in the sediments than in their respective standing water. All the heavy metals studied were sufficiently labile to contaminate the environment. The bioavailable fraction of the heavy metals in the sediments was mostly found in the reducible phase thus, most of the heavy metals exist bound as oxides of Fe and Mn. As this case study has established the occurrence of AMD phenomenon in the Ngwenya Mine, it is worthwhile that surface waters in the areas around the mine be also assessed for AMD pollution. This would provide a more comprehensive picture of the extent of the AMD pollution of the immediate environment of the old Ngwenya Mine in Swaziland.
5. Acknowledgements
We would like to thank the Swaziland National Trust Commission (SNTC) for granting us the permission of entry from time to time into the study area and an anonymous reviewer for his comments and constructive suggestions.
REFERENCES
- G. O. Olutona, O. G. Aribisala and E. A. Akintunde, “A Study of Chemical Speciation of Metals in Aquatic Bottom Sediment of Aiba Reservoir, Iwo, Nigeria,” African Journal of Environmental Science and Technology, Vol. 6, No. 8, 2012, pp. 312-321.
- A. Concas, C. Ardau, A. Cristini, P. Zuddas and G. Cao, “Mobility of Heavy Metals from Tailings to Stream Waters in a Mining Activity Contaminated Site,” Chemosphere, Vol. 63, No. 2, 2006, pp. 244-253. http://dx.doi.org/10.1016/j.chemosphere.2005.08.024
- H. Tutu, E. M. Cukrowska, V. Dohnal and J. Havel, “Application of Artificial Neural Networks for Classification of Uranium Distribution in the Central Rand Goldfield, South Africa,” Environmental Modeling and Assessment, Vol. 10, No. 2, 2005, pp. 143-152. http://dx.doi.org/10.1007/s10666-005-0214-x
- E. G. Regis, “Assessment of the Effects of Acid Mine Drainage on Mogpog River Ecosystem, Marinduque, Phillippines, and Possible Impacts on Human Communities,” Ph.D., 2006.
- C. Afriyie-Debrah, K. Obiri-Danso and J. H. Ephriam, “Effect of Acid Mine Drainage on Creeks or Streams in a Mining Community in Ghana and Treatment Options,” International Journal of Environmental Science and Development, Vol. 1, No. 5, 2010.
- H. Tutu, E. Cukrowska, T. S. McCarthy, N. F. Mphephu and R. Hart, “Determination and Modelling of Geochemical Speciation of Uranium in Gold Mine Polluted Land in South Africa,” Proceedings of the 8th International Congress on Mine Water and the Environment, Johannesburg, 2003, pp. 137-155.
- S. R. Jennings, D. R. Neuman and P. S. Blicker, “Acid Mine Drainage and Effects on Fish Health and Ecology: A Review,” Reclamation Research Group Publication, Bozeman, 2008.
- A. E. Meadows and A. A. Carpenter, “Acid Mine Drainage and Groundwater Pollution,” Groundwater Pollution Primer. CE 4594: Soil and Groundwater Pollution, Civil Engineering Department, Virginia Tech., 1997.
- R. S. Lokhande, P. U. Singare and D. S Pimple, “Pollution in Water of Kasardi River Flowing along Taloja Industrial Area of Mumbai, India,” World Environment, Vol. 1, No. 1, 2011, pp. 6-13.
- G. M. El Zokm, S. El-Gohary and D. E. Abd-El-Khalek, “Studies of Some Heavy Metals in Water and Sediment in El-Max Fish Farm, Egypt,” World Applied Sciences Journal, Vol. 18, No. 2, 2012, pp. 171-180.
- R. K. Klake, V. K. Nartey, L. K. Doamekpor and K. A. Edor, “Correlation between Heavy Metals in Fish and Sediment in Sakumo and Kpeshie Lagoons, Ghana,” Journal of Environmental Protection, Vol. 3, 2012, pp. 1070- 1077. http://dx.doi.org/10.4236/jep.2012.39125
- M. F. Zaranyika and T. Chirinda, “Heavy Metal Speciation Trends in Mine Slime Dams: A Case Study of Slime Dams at a Goldmine in Zimbabwe,” Journal of Environmental Chemistry and Ecotoxicology, Vol. 3, No. 5, 2011, pp. 103-115.
- A. D. O’Sullivan, R. Conlon, B. Moran and M. Otte, “Characterisation of Constructed Wetland Substrates by Chemical Sequential Extraction and X-Ray Diffraction Analyses,” Biology and Environment: Proceedings of the Royal Irish Academy, Vol. 105B, No. 2, 2005, pp. 87-94. http://dx.doi.org/10.3318/BIOE.2005.105.2.87
- Malolotja Nature Reserve, 1998-2013. http://www.wheretostay.co.za/information/topic/3791
- A. Tessier, P. G. C. Campbell and M. Bisson, “Sequential Extraction Procedure for the Speciation of Particulate Trace Metals,” Analytical Chemistry, Vol. 51, No. 7, 1979, pp. 844-851. http://dx.doi.org/10.1021/ac50043a017
- J. M. Bigham, O. H. Tuovinen, K. S. Brady and T. J. Logan, “Iron Speciation in Acid Mine Effluents: Chemical and Microbial Controls,” Department of Agronomy and Microbiology, The Ohio State University, 1984.
- M. C. Jung, J. S. Ahn and H. Chon, “Environmental Contamination and Sequential Extraction of Trace Elements from Mine Wastes around Various Metalliferous Mines in Korea,” Geosystem Eng., 2001, pp. 50-60.
- M. Gebrekidan and Z. Samuel, “Concentrations of Heavy Metals in Drinking Water from Urban Areas of the Tigray Region, Northern Ethiopia,” Mekelle University, Vol. 3, No. 1, 2011, pp. 105-121.
- C. Ewen, M. A. Anagnostopoulou and N. I. Ward, “Monitoring of Heavy Metal Levels in Roadside Dusts of Thessaloniki, Greece, in Relation to Motor Vehicle Traffic Density and Flow,” Environmental Monitoring & Assessment, Vol. 157, No. 1-4, pp. 483-498.
- E. U. Etim and G. U. Adie, “Assessment of Toxic Heavy Metal Loading in Topsoil Samples within the Vicinity of a Limestone Quarry in South Western Nigeria,” African Journal of Environmental Science and Technology, Vol. 6, No. 8, 2012, pp. 322-330.
- A. Szucs, “Geochemical Landscape Analysis for the Risk Assessment of Acid Mine Drainage in a Wetland Environment,” Ph.D. Dissertation, Department of Earth Sciences, Uppsala University, Uppsala, 2006.
- K. F. Mossop and C. M. Davidson, “Comparison of Original and Modified BCR Sequential Procedures for the Fractionation of Copper, Iron, Lead, Manganese and Zinc in Soils and Sediments,” Department of Pure and Applied Chemistry, University of Strathclyde, Glasgow.
NOTES
*Corresponding author.