Journal of Environmental Protection
Vol. 4 No. 9 (2013) , Article ID: 36309 , 26 pages DOI:10.4236/jep.2013.49104
Radiation Exposure and Cancer Incidence (1990 to 2008) around Nuclear Power Plants in Ontario, Canada
![]()
Canadian Nuclear Safety Commission, Ottawa, Canada.
Email: *Patsy.Thompson@cnsc-ccsn.gc.ca
Copyright © 2013 R. Lane et al. This is an open access article distributed under the Creative Commons Attribution License, which permits unrestricted use, distribution, and reproduction in any medium, provided the original work is properly cited.
Received June 22nd, 2013; revised July 25th, 2013; accepted August 16th, 2013
Keywords: Cancer; Childhood Leukemia; Radiation Doses; Population; Nuclear Power Plants
ABSTRACT
Radiation doses and cancer incidence among the population living within 25 km of three nuclear power plants (NPPs) in Ontario, Canada were investigated for the period 1985 to 2008 for radiation exposure and 1990 to 2008 for cancer incidence. This study design provided at least a five-year latency period between potential radiation exposure and cancer incidence. Around the NPPs, the incidence of childhood cancers, leukemia and non-Hodgkin lymphoma, in young children (aged 0 - 4) was lower than the general Ontario population, but not statistically so. Cancer incidence in children aged 0 - 14 was similar to the Ontario population. Overall, for all ages there was no consistent pattern of cancer incidence (all cancers combined and radio-sensitive cancers) across the population living within 25 km of the three NPPs. Some types of cancers were statistically higher than expected, others were statistically lower than expected, and others were similar to the general Ontario population. Although variations in all cancers combined and radiosensitive cancers were found in this study, the pattern was found to be within the natural variation of cancer in Ontario. During the period 1985 to 2000 (Pickering and Bruce NPPs) and 1985 to 2002 (Darlington NPP) radiation doses to members of the public from the operation of the NPPs, estimated on the basis of a hypothetical individual at the facility fence line, were ≤0.052 mSv/year; while for the period 2001 to 2008 (Pickering and Bruce NPPs) and 2003 to 2008 (Darlington NPP) radiation doses, more realistically estimated using the critical group concept for six age classes, were ≤0.0067 mSv/year. Hence, public doses from environmental releases of radionuclides from Ontario NPPs represent a very small fraction of natural background radiation (1.338 and 2.02 mSv/year) in the regions where the NPPs are located. Our study shows no evidence of childhood leukemia clusters around the three NPPs and that the incidence of all the cancers investigated for all age groups is within the natural variation of the disease in Ontario. The radiation exposure from NPP operation is a small contributor to the public’s total exposure to radiation and is not a plausible explanation for any excess cancers observed within 25 km of any Ontario NPP.
1. Introduction
Several studies have evaluated the relationship between distance from a nuclear facility and cancer incidence, but few studies have assessed the relationship between radioactive discharges or radiation dose to members of the public from a nuclear facility and cancer incidence.
In Germany, a case-control study (1980 to 2003) found a statistically significant excess risk of leukemia among children under 5 years old living within 5 km of a nuclear power plant (NPP) [1,2]. However, an increasing trend with the inverse distance from the sites, considered as a continuous variable, was not detected when the distance was categorical [2]. Likewise, the risk estimates obtained in the incidence analysis [3] also appeared to be lower than those obtained with the case-control approach [2]. The results were largely attributed to cases in previous studies from 1980 to 1990 [4] and 1991 to 1995 [5], especially in the 5 km zone. Likewise, the estimated risk in the 5 km zone was highly sensitive to whether or not the Krümmel NPP was included [6,7]. Individual radiation exposures from the NPP emissions and other sources were not available. The authors concluded the observed positive distance trend remained unexplained and no statements on the cause of the increase cancer rates could be made. A further analysis [8] observed the trend in risk decreased over time, and a reassessment of the results showed a marked impact of the urban/rural status of the residence on the estimated risk [9]. An independent review of the study [9] concluded there was no support for a causal relationship between any chemical or physical risk factor and the observed risk of childhood leukemia. Several reviews of this study came to similar conclusions [6,10,11].
Other studies have been conducted in the United Kingdom [12], France [10], Switzerland [13] and Finland [14]. No relationship between childhood leukemia and distance from an NPP was found. A recent study conducted in France used a methodology allowing the assignment of radiation doses from nuclear facilities to the cases of leukemia [7]. This study found a significant relationship between distance and childhood leukemia; however, when dose-based geographic zoning was used, childhood leukemia could not be explained by the radiation exposures from the NPPs’ gaseous discharges. Earlier, French studies found no relationship between childhood leukemia incidence and distance from NPPs [10] or radiation exposures in the municipalities near the sites [15].
In Canada, McLaughlin et al. [16] examined leukemia mortality (1950 to 1987) and incidence (1964 to 1986) among children aged 0 - 14 within communities near (25 km) two Ontario NPPs (Pickering, Bruce). Childhood leukemia in the vicinity of the Bruce and Pickering NPPs was greater than expected although not statistically significantly so. Prior to the opening of the Pickering NPP (1950 to 1970), the mortality ratio by residence at birth for the 25 km area was also higher than expected. The confidence intervals included the null value and were generally wide because of the small observed and expected numbers of deaths and cases. The results for leukemia in children aged 0 - 4 were similar. When the areas near Bruce and Pickering NPPs were pooled, the evidence became weaker. The statistical power of the study was also limited due to the rarity of childhood leukemia and the small number of observed and expected cases and deaths. In conclusion, there was no statistical evidence the difference was due to anything but the natural variation of the disease.
Also in Canada, rates of cancer incidence and mortality, congenital anomalies and stillbirths were examined from 1981 to 2004 in areas surrounding the Pickering and Darlington NPPs [17]. The authors concluded that although there were some elevated cancer rates (i.e., thyroid, breast, brain, and kidney cancer, and leukemia (excluding CLL)), there was no clear pattern found across time periods, sexes, and for incidence and mortality statistics. All childhood cancer mortality and incidence rates were similar to the Ontario population. All other health indicators were significantly low or at provincial levels. Overall, the results were consistent with an earlier analysis for the region from 1979 to 1993 [18]. In general, disease rates did not indicate a pattern to suggest the Pickering and Darlington NPPs were causing health effects in the population.
To date, no Canadian study of cancer incidence among the population has included an analysis of exposure of members of the public to radioactive emissions from an NPP. In Ontario, twenty nuclear power reactors located on three NPP sites (Pickering, Bruce and Darlington) which began operation between 1971 and 1989. The objective of this work was to conduct an ecological hypothesis-screening study providing radiation dose estimates for members of the public from environmental radiation monitoring data and updated cancer incidence data for populations living within 25 km of the three Ontario NPPs from 1990 to 2008.
2. Methods
2.1. Radiation Doses to Members of the Public Living near Ontario Nuclear Power Plants
Radionuclides released to the environment from Canadian NPPs are listed in Table 1.
Data on annual radiation dose assessments for members of the public using internal and external environmental exposure pathways were collected from Ontario Power Generation (OPG) and Bruce Power annual reports [19-34]. Exposure pathways included in the dose assessments were inhalation and ingestion of food and water, exposure from air and water immersion, groundshine, and incidental soil and sediment ingestion. Concentrations of radionuclides in various environmental compartments were obtained from the results of radio-
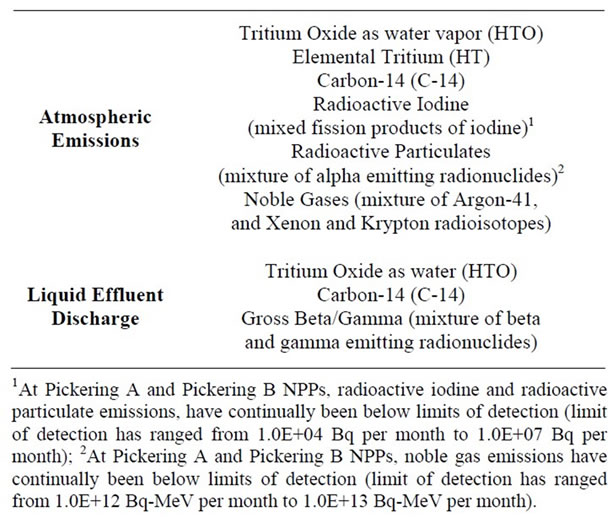
Table 1. Major radionuclide and radionuclide groups released from Canadian NPPs.
logical environmental monitoring programs (REMP). Doses were calculated for members of the public using either a hypothetical individual (1985-2001 for the Pickering and Bruce NPPs; 1985-2003 for the Darlington NPP) or critical groups (2001-2008 for the Pickering and Bruce NPPs; 2003-2008 for the Darlington NPP). Table 2 summarizes the environmental media and radionuclides monitored through the REMP and used in the dose calculations.
While the use of a hypothetical individual resulted in very conservative radiation dose estimates (individual living at the NPP fence line and consuming exclusively local food and water), critical group doses were more realistic. A critical group represents a uniform group of people whose location, age, diet, lifestyle, etc., caused them to receive higher doses than other groups in the exposed population. The three NPPs each have multiple potential critical groups. At each critical group location, age classes (adult, 15‑year‑old, 10‑year‑old, 5‑year‑old, 1‑year‑old, and nursing infant) have been attributed characteristics to reflect different diet consumption rates, and lifestyle habits. Site-specific surveys of residents and local farms surrounding the NPPs were conducted to obtain information on the characteristics of the potential critical groups [35-43]. Surveys generated information on
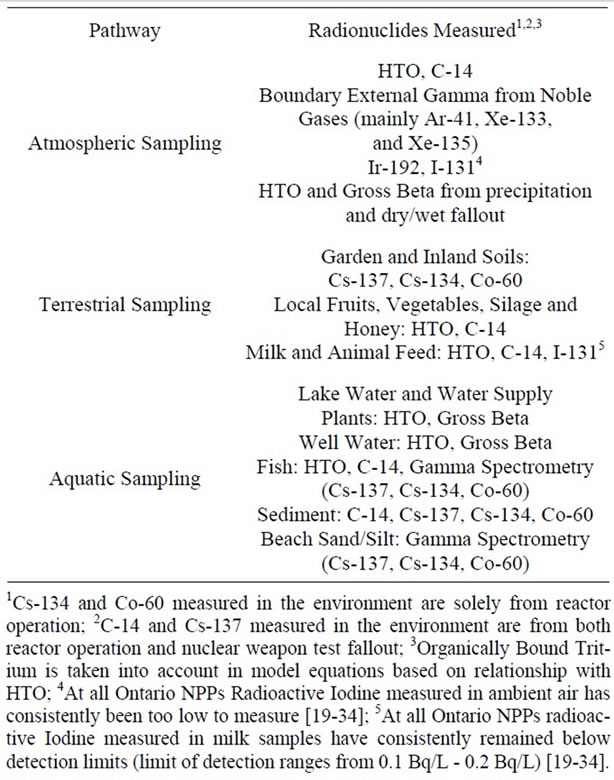
Table 2. Environmental media and radionuclides monitored for the purpose of estimating doses to members of the public.
the number of people living at each residence or farm, their age distribution, sources of water for various uses, as well as the proportion of local and store bought food consumed. If information could not be obtained from surveys, default values in the CSA standard N288.1 [36,37] were used.
For each NPP, all annual total dose data for each hypothetical individual or critical group from 1985 to 2008 were compiled [19-34]. The highest annual doses to critical groups were mapped using ESRI® ArcGIS™ Desktop version 10.1 (ArcGIS) mapping software. A set of maps was generated, one for each NPP, showing the highest doses received to each potential critical group over the study period. A polygon shape file was created with boundaries extending at a radius every 5 km up to 25 km from the NPP, corresponding to the geographic distribution of cancer incidence data used for this study. The Darlington and Pickering NPPs are on the shore of Lake Ontario and the Bruce NPP is on the shore of Lake Huron; therefore, a large portion of the 25 km radius included water.
For each NPP, the year with the highest critical group dose within the study period were identified and a second set of maps was created. For each NPP, atmospheric dispersion plumes for each radionuclide were generated, based on the atmospheric emissions data for the given year. The dispersion plumes were produced using the EcoMetrix® IMPACTTM (IMPACT) modelling software, which is based on CSA standard N288.1 [36,37]. Sitespecific weather data and release characteristics obtained from each NPP were used in the model (available upon request). From the model outputs, a dose plume was generated in ArcGIS using air inhalation and immersion dose conversion factors. For each NPP, the dose plume represents a hypothetical annual dose that would be received by an individual due to air immersion and inhalation if that person spent the entire year outdoors at a particular location (full time occupancy).
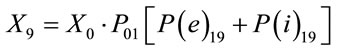
The following equation was used to calculate the dose due to air immersion and air inhalation:
where
 is the dose received (µSv·yr−1);
 is the air emission release rate (Bq·s−1);
 is the dilution factor due to atmospheric dispersion (s·m−3);
 is the transfer parameter for dose to humans via air immersion (Sv·yr−1·Bq−1·m3);
 is the transfer parameter for dose to humans via air inhalation (Sv·yr−1·Bq−1·m3).
Parameters and assumptions used in the atmospheric dispersion plume modelling and dose assessment are based on air emission data for each radionuclide and average annual Triple Joint Frequency meteorological conditions (i.e., wind speed, stability class, and wind direction) and release characteristics (i.e., stack height, stack exit velocity, gas and ambient temperatures). This information came from industry reports formally submitted to the national regulator, the Canadian Nuclear Safety Commission (CNSC) [26,29,31,39-43]. Each report has undergone a critical technical review by the CNSC. Transfer parameters, P(e)19 and P(i)19 and dose conversion factors, DCFa and DCFi for air immersion and air inhalation used in the dose assessment were adopted from CSA standard N288.1 [36,37].
2.2. Cancer Incidence in Members of the Public Living near Ontario Nuclear Power Plants
Cancer incidence data collected by the Ontario Cancer Registry (OCR) [44] from 1990 to 1991 and the Canadian Cancer Registry (CCR) [45] from 1992 to 2008 were obtained for the following: all cancer sites combined; cancer of the thyroid, lung and bronchus; female breast; ovary; esophagus; stomach; colon and rectum; bladder; brain and other nervous system; liver; and leukemia and non-Hodgkin lymphoma. These types of cancer were chosen because they are sensitive to radiation [46-48]. Disease coding was based on the 3rd edition of the International Classification of Diseases for Oncology [49]. Cases coded to the 2nd edition were converted.
Population counts from the Census of Canada [50] for the census years 1991, 1996, 2001, and 2006 were obtained for the areas within 25 km of the three NPPs in Ontario (data not shown). The tables prepared in this study start in 1990 since it was the first year that Cancer Care Ontario (CCO) data had sufficient completeness for postal code information.The geographical areas in our study included combined municipalities in the 25-km radius from an NPP, based on its latitude and longitude. This study focused on a 25-km radius from each Ontario NPP to be consistent with a previous study [16] and because of the low population density around the Bruce NPP. This is less specific than information at the individual census subdivision (CSD) level and not as broad as the census division (CD) level.
CCO conducted a data quality study to investigate residence code errors at the census division (CD) and census subdivision (CSD) level through a record linkage to the Ontario property assessment files. The accuracy of the CSD of residence was 84.4% whereas the accuracy of the CD level of residence was 97.9% for the 1025 cases having this information [51]. The CD is considered the gold standard.
Standardized incidence ratios (SIRs) (O/E) based on residence at diagnosis, observed (O) and expected (E) number of cancer cases and 95% confidence intervals (CIs) were calculated [52] based on the ageand sexspecific rates of the comparison population (i.e., Ontario) for the corresponding period (1990 to 2008) for the 25 km radius of each NPP. Internal calculations of observed and expected cases were stratified by five-year age groups and periods, and controlled for socio-economic status using income quintile.
The statistical power of this study depends on the statistical significance criterion used, the magnitude of the effect of interest, and the sample size. Table 7.2 given by Breslow and Day [53] was used to calculate the power using 80% as a standard for acceptance [54]. Using Ontario as the reference population and the expected cases for leukemia (all ages, both sexes combined) for people living within 25 km of the Bruce NPP (which had the smallest population) for example, the probability (%) of obtaining a result significant at the 0.01 level (one sided) of the expected value (E) of 70 (68.0 actual expected cases) assuming no excess risk, and of the true R (or SIR in our case), the sample power for R = 1.2 is 24%. For childhood cancer (leukemia and NHL) near Bruce NPP at a significance of 0.01, and E of 5, (5.2 actual) assumeing no excess risk, and a true R, the sample power for R = 1.5 is only 8.0%. As a result, the small population size and the rareness of some cancers limited the statistical power of our findings among the population living near Bruce NPP. This was generally not an issue near Darlington and Pickering NPPs which had large observed and expected numbers of cancer cases.
Age-standardized incidence rates (ASIRs), per 100,000 population, were calculated using the direct method, which involves weighing the age-specific rates for each of the age groups (<1, 1 - 4, 5 - 9 ··· 80 - 84, 85+) according to the age distribution of the standard 1991 Canadian population. The 95% CIs are not provided for the ASIRs when the number of rounded cases is ≤ 5 since the approximation used is less accurate for a small number of cases. SIRs were also calculated at the CD level by cancer site and for all ages and both sexes combined, for Durham Region (location of Pickering and Darlington NPPs) and Bruce County (location of Bruce NPP) using Ontario rates as the comparison population. This provided an additional comparison of cancer incidence around the NPPs with that of the 25 km radius analysis.
3. Results
3.1. Radiation Doses to Members of the Public Living near Ontario Nuclear Power Plants
Data on radiation doses to members of the public were obtained for the period 1985 to 2008 to provide exposure information during a minimum 5-year latency period from the start of the cancer incidence data (1990-2008). Annual doses to hypothetical individuals varied from 0.052 to 0.004 mSv and from 0.016 to 0.002 mSv between 1985 and 2000 for the Pickering and Bruce NPP respectively. Annual doses for a hypothetical individual at the Darlington NPP from 1985 to 2002 were slightly lower and ranged from 0.010 to 0.001 mSv.
Tables 3-5 present the highest annual radiation dose to each age class for each critical group at each NPP over the study period. The highest estimated dose received to a critical group over the study period was in 2005 for the Pickering NPP, 2003 for the Darlington NPP and 2008 for the Bruce NPP. For comparison purposes, the annual dose from natural background radiation at each site is also presented. Radiation doses to members of the public from the operation of Ontario NPPs (represented by conservatively estimated doses to critical groups (≤ 0.0067 mSv/year)) are much less than the difference in natural background radiation between the Darlington/Pickering area and the Bruce area (0.682 mSv/year) and hence only represent a very minor contribution to the public’s overall radiation exposure.
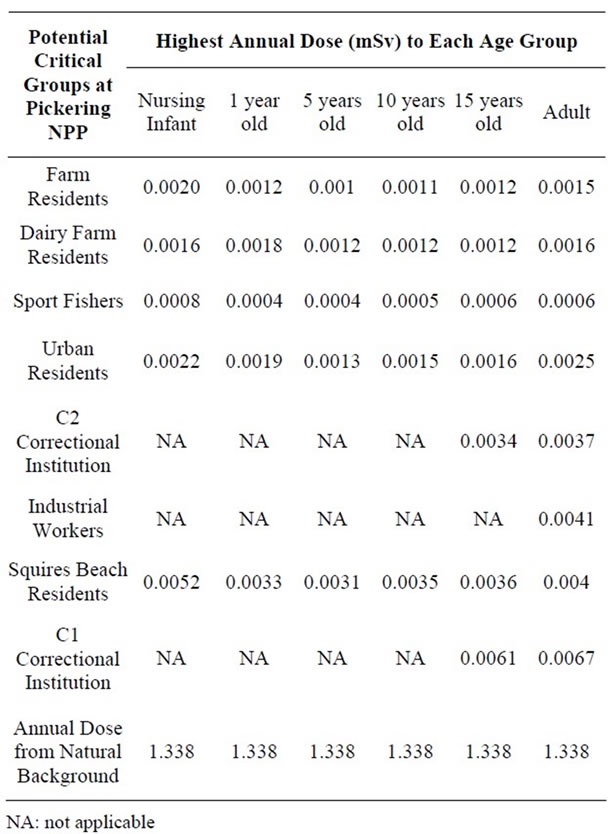
Table 3. Highest Estimated Annual Dose to Potential Critical Groups Age Classes Surrounding the Pickering NPP (2001-2008).
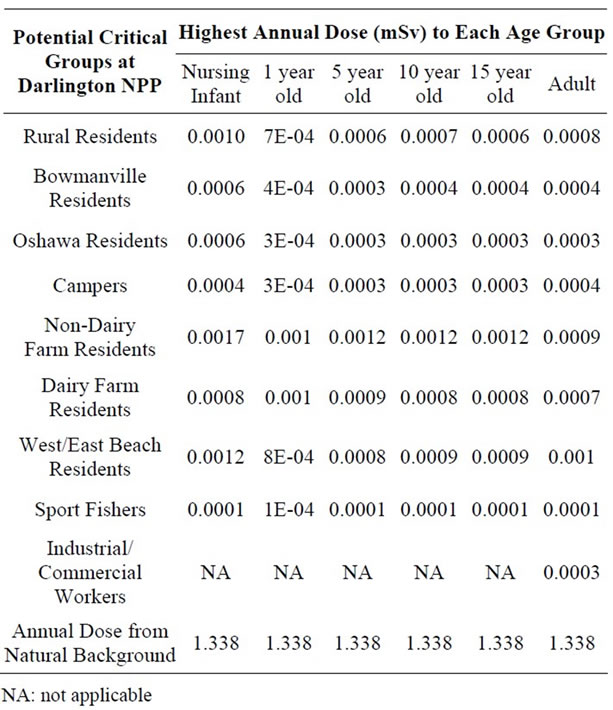
Table 4. Highest Estimated Annual Effective Dose to Potential Critical Group Age Classes Surrounding the Darlington NPP (2003-2008).
The relative contribution of different radionuclides to the total dose was analyzed. Doses from tritium are higher in adults than in children or infants due to higher inhalation rates, whereas the reverse is observed for doses due to noble gases (as a result of increased shielding due to higher assumed body fat in adults).
Critical group doses for Pickering (2005), Darlington (2003), and Bruce (2008) were analyzed for spatial relationship between dose and distance from the three NPPs (Figures 1-3). The analysis revealed that the highest doses were not necessarily associated with critical groups closest to the NPP. For example, residents living closer to the Pickering NPP (such as the non-dairy-farm resident) have lower doses (0.0011 mSv) than the dairy-farm residents living several km further away (0.0013 mSv). This was also observed when comparing the doses to urban residents (0.0020 mSv) with those of residents of the correctional institution (0.0022 mSv). At the Darlington NPP, the dairy-farm residents also have a lower dose (0.0007 mSv) than the rural residents (0.0009 mSv) located further away. Sport fishers near both the Pickering and Darlington NPPs have the lowest doses of all the critical groups, as they are expected to spend at most 1% of the year at the fishing location. Similarly industrial and commercial workers are expected to spend only 20% of the time at the critical group location, also resulting in lower doses. Residents living within 5 km of
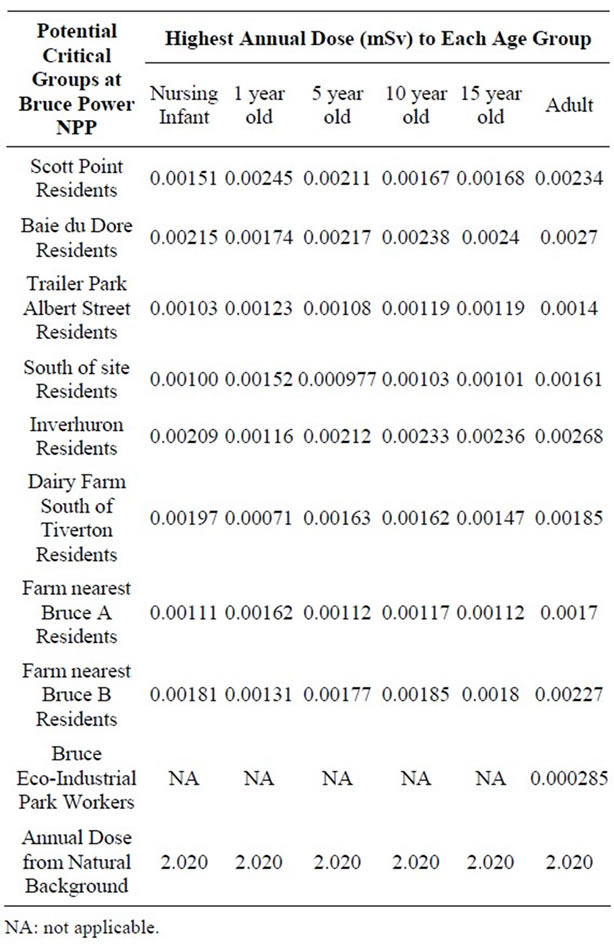
Table 5. Highest Estimated Annual Dose to Potential Critical Group Age Classes Surrounding the Bruce Power NPP (2001-2008).
the Bruce NPP (0.0012 mSv) have lower doses than residents who lived further away (0.0021 mSv). Both groups are non-farm residents with the same dietary characteristics (e.g., food coumption rates; proportion of local vs. store-bought food). The difference in doses is due primarily to differences in location relative to prevailing wind conditions.
Figures 1-3 overlay onto the year with the highest critical group doses the hypothetical atmospheric dose plume for full time occupancy of an infant, child and adult within the plume. The high value represents the dose from inhalation and immersion for full time occupancy at the stack and the low value bounds the fully dispersed atmospheric release. These dose plumes, based on site-specific average annual weather data, clearly indicate a plume extending towards and over the lake, and generally away from populated areas. The dose estimates in the dispersion plumes are higher than critical group doses not only because of the hypothetical full time occupancy in the plume but also because the IMPACT software assumes that the stack is at ground level. Actual emissions from the three NPPs are released from stacks at elevations greater than 10 m, allowing for increased air dispersion before reaching the ground (point of impingement).
3.2. Cancer Incidence in Members of the Public Living near Ontario Nuclear Power Plants
Cancer incidence data were collected for all cancer sites combined and for cancer sites sensitive to radiation. Incidence data were analyzed for the following age groups: 0 - 4, 0 - 14, 0 - 24, 25 - 64, 65+ and 0 - 65+ when the number of cases was sufficient. A blank is given if the number of cases is less than 6 and, therefore, not reported.
Table 6 shows that the SIRs for childhood cancer (leukemia and non-Hodgkin lymphoma) among children aged 0 - 4 living within 25 km of the Pickering and Darlington NPPs were lower than expected for the Ontario population but not statistically significantly so. Similarly, the incidence of childhood cancer in children aged 0 - 14 living near the three NPPs was similar to Ontario. Near the Bruce NPP, no information was available for young children (aged 0 - 4) because there were fewer than 6 cancer cases from 1990 to 2008. Similarly, for children aged 0 - 14, leukemia and nonHodgkin lymphoma were combined to preserve confidentiality of observed cases fewer than 6.
Table 7 shows the results for all cancer sites combined and leukemia for those aged 0 - 24, 25 - 64, and 65+. Other cancer sites were not provided for those aged 0 - 24 since, in general, few cases were observed; especially near Bruce NPP. For all cancer sites combined and especially leukemia, the SIRs were either significantly less than 1.0 or similar to Ontario for those aged 0 - 24 living near all three NPPs.
The age groups 0 - 64 and 65+ were used for all other cancer sites. Tables 8 to 10 present for all three NPPs the SIRs for all the cancer sites, by age group and for both sexes. For all three NPPs, it is very evident that lung and bronchus, female breast and colon and rectum cancer are the most common cancer sites. However, the number of cases varies considerably between the three NPPs due to the large differences in population size of people living within 25 km of Pickering, Darlington and Bruce NPPs (1,580,000; 380,000; and 24,500 respectively, based on the 2006 census year). This is expected, as these are also the most common types of cancer in the province, and in Canada [55]. There was no consistent cancer incidence pattern among people living near the three NPPs. Some types of cancer were statistically significantly higher than expected; however, some types of cancer were statistically significantly lower than expected, and some types
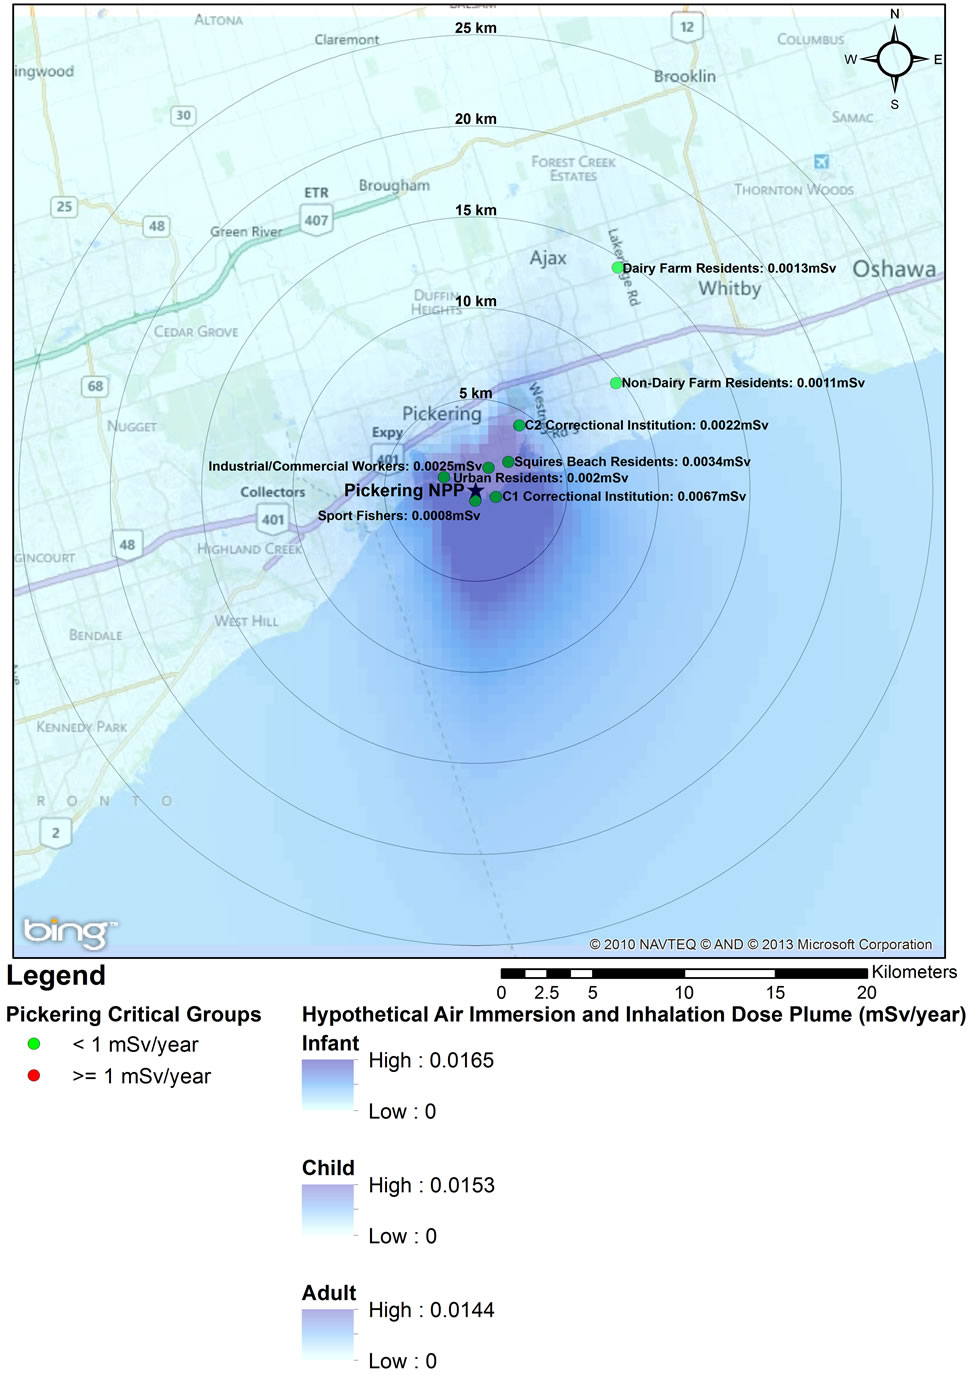
Figure 1. 2005 Critical Group Doses and Hypothetical Air Dispersion Plume for Pickering NPP.
of cancer were the same as expected compared to the general Ontario population.
As seen in Table 8, near the Pickering NPP all cancer sites combined had a SIR significantly less than 1.0 (SIR = 0.95, 95% CI: 0.94, 0.95, p < 0.01). Similarly, seven cancer sites also had SIRs significantly less than 1.0 (lung and bronchus: SIR = 0.84; female breast: SIR = 0.97; colon and rectum: SIR = 0.92; bladder: SIR = 0.91; brain and other nervous system: SIR = 0.92; esophagus: SIR = 0.84; and leukemia: SIR = 0.89). However, three cancer sites had SIRs significantly greater than 1.0 (thyroid: SIR = 1.41; stomach: SIR = 1.06; and liver: SIR = 1.32). Thyroid and liver cancer were elevated in both males and females and all age groups; whereas, the elevated incidence of stomach cancer was limited to women and those age 65+.
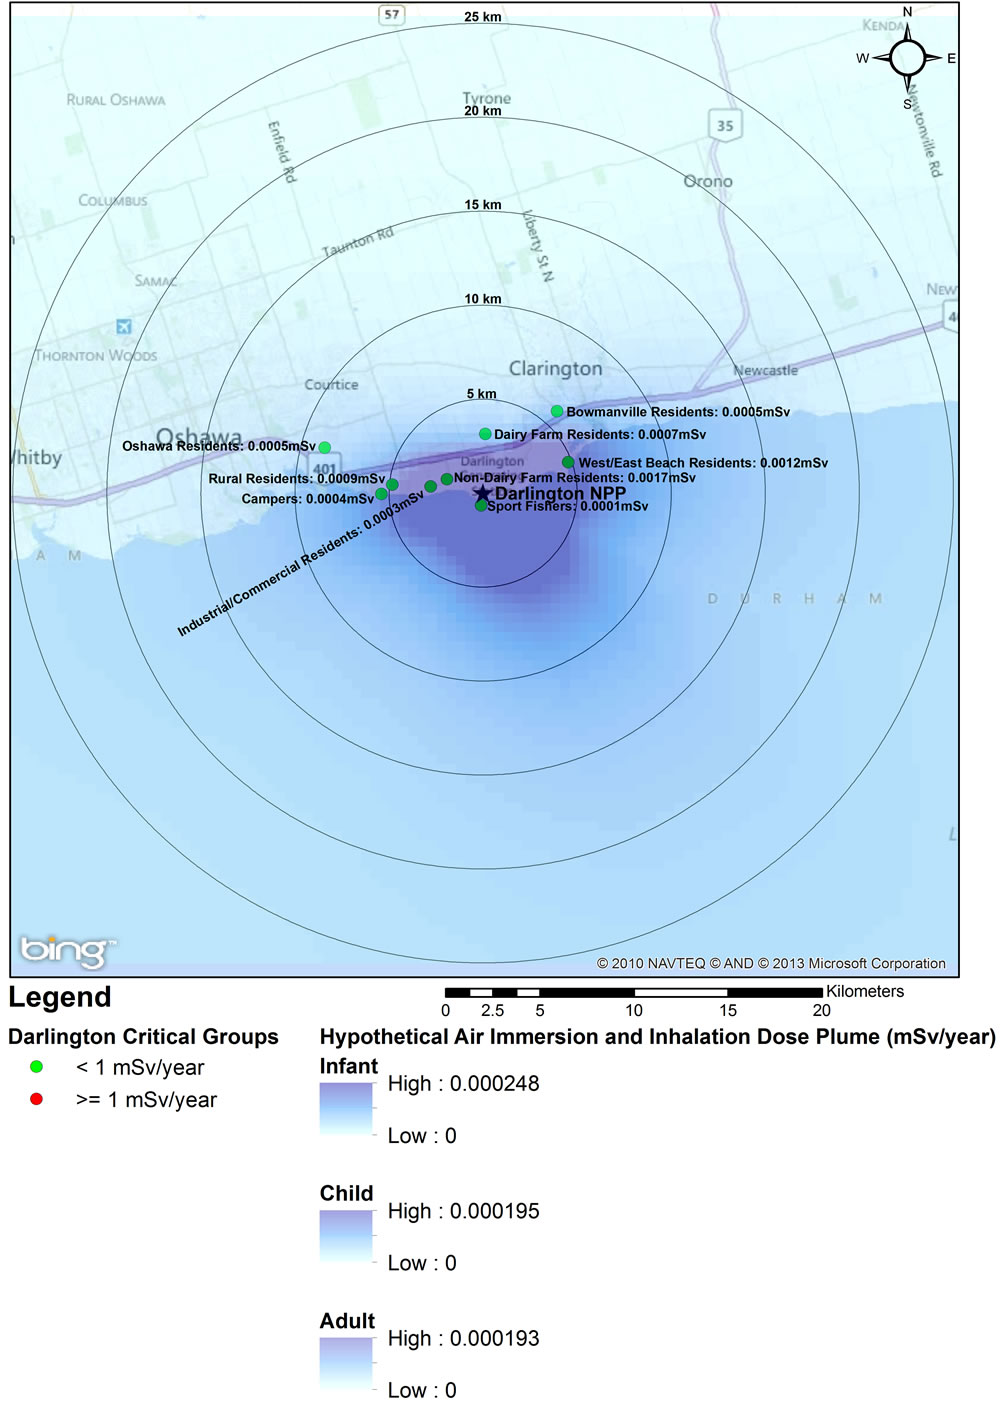
Figure 2. 2003 Critical Group Doses and Hypothetical Air Dispersion Plume for Darlington NPP.
Near the Darlington NPP, the data in Table 9 show that for all cancer sites combined the SIR is significantly greater than 1.0 (SIR = 1.08, 95% CI: 1.07, 1.09, p < 0.01). Five cancer sites also had SIRs significantly greater than 1.0 (lung and bronchus: SIR = 1.12; colon and rectum: SIR = 1.07; thyroid: SIR = 1.08; bladder: SIR = 1.19; and leukemia: SIR = 1.26). While three of these cancers (lung and bronchus, bladder and leukemia) were elevated in males and females and all age groups, the increased incidence of colon and rectum and thyroid cancer were essentially attributable to men and those aged 65+, and all men, respectively. In contrast to Pickering, near Darlington liver cancer had a SIR significantly less than 1.0 (SIR = 0.83).
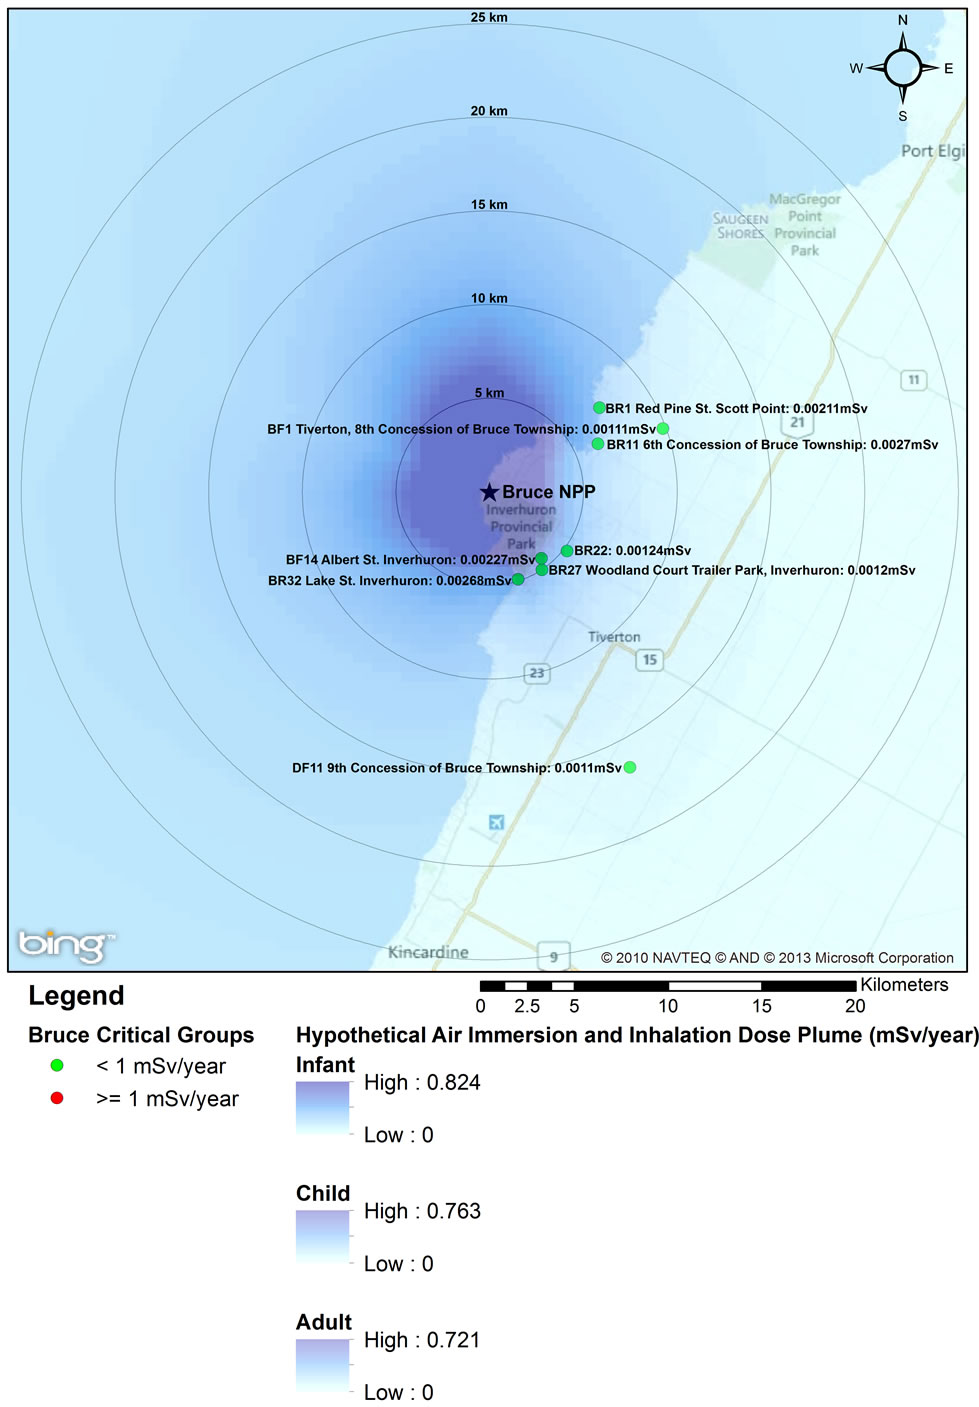
Figure 3. 2008 Critical Group Doses and Hypothetical Air Dispersion Plume for Bruce NPP.
Table 10 shows that near the Bruce NPP, all cancer sites combined had a SIR significantly greater than 1.0 (SIR = 1.09, 95% CI: 1.05, 1.13, p < 0.01). While SIRs were significantly greater than 1.0 for two cancer sites (lung and bronchus: SIR = 1.17; colon and rectum: SIR = 1.17), two cancer sites had SIRs significantly less than 1.0 (bladder: SIR = 0.78; and liver: SIR < 1.00). Lung and bronchus cancer was elevated in males in the 0 - 64 age group; whereas the elevated incidence of colon and rectum cancer was attributed to those aged 65+.
The SIR analysis for people living within the 25 km radius of the three NPPs was found, in general, consistent with the CD analysis of SIRs. The incidence of childhood leukemia and non-Hodgkin lymphoma in children
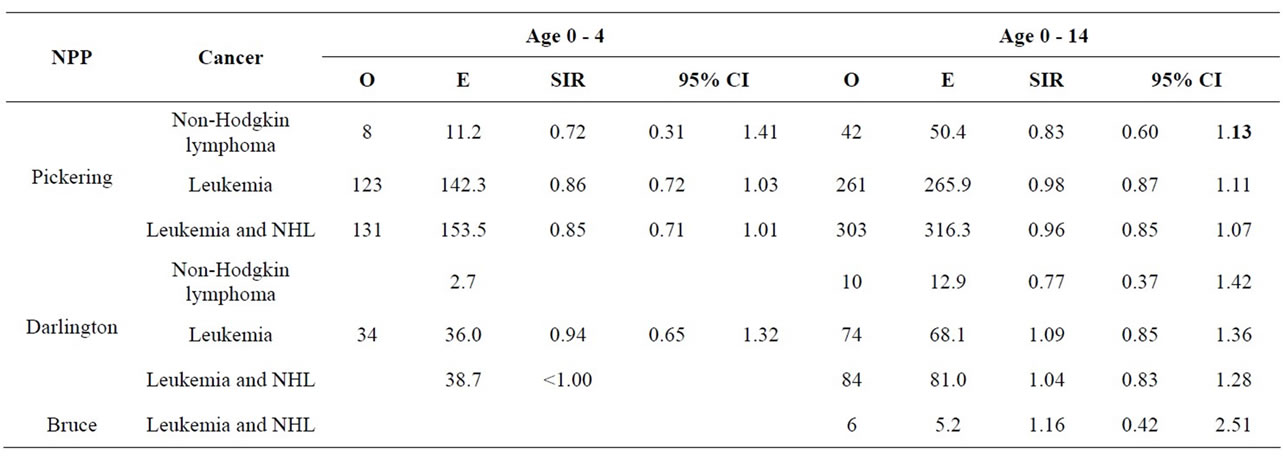
Table 6. Cancer incidence for children aged 0 - 4 and 0 - 14 years living within a 25 km radius of an Ontario NPP at time of diagnosis, 1990-2008.
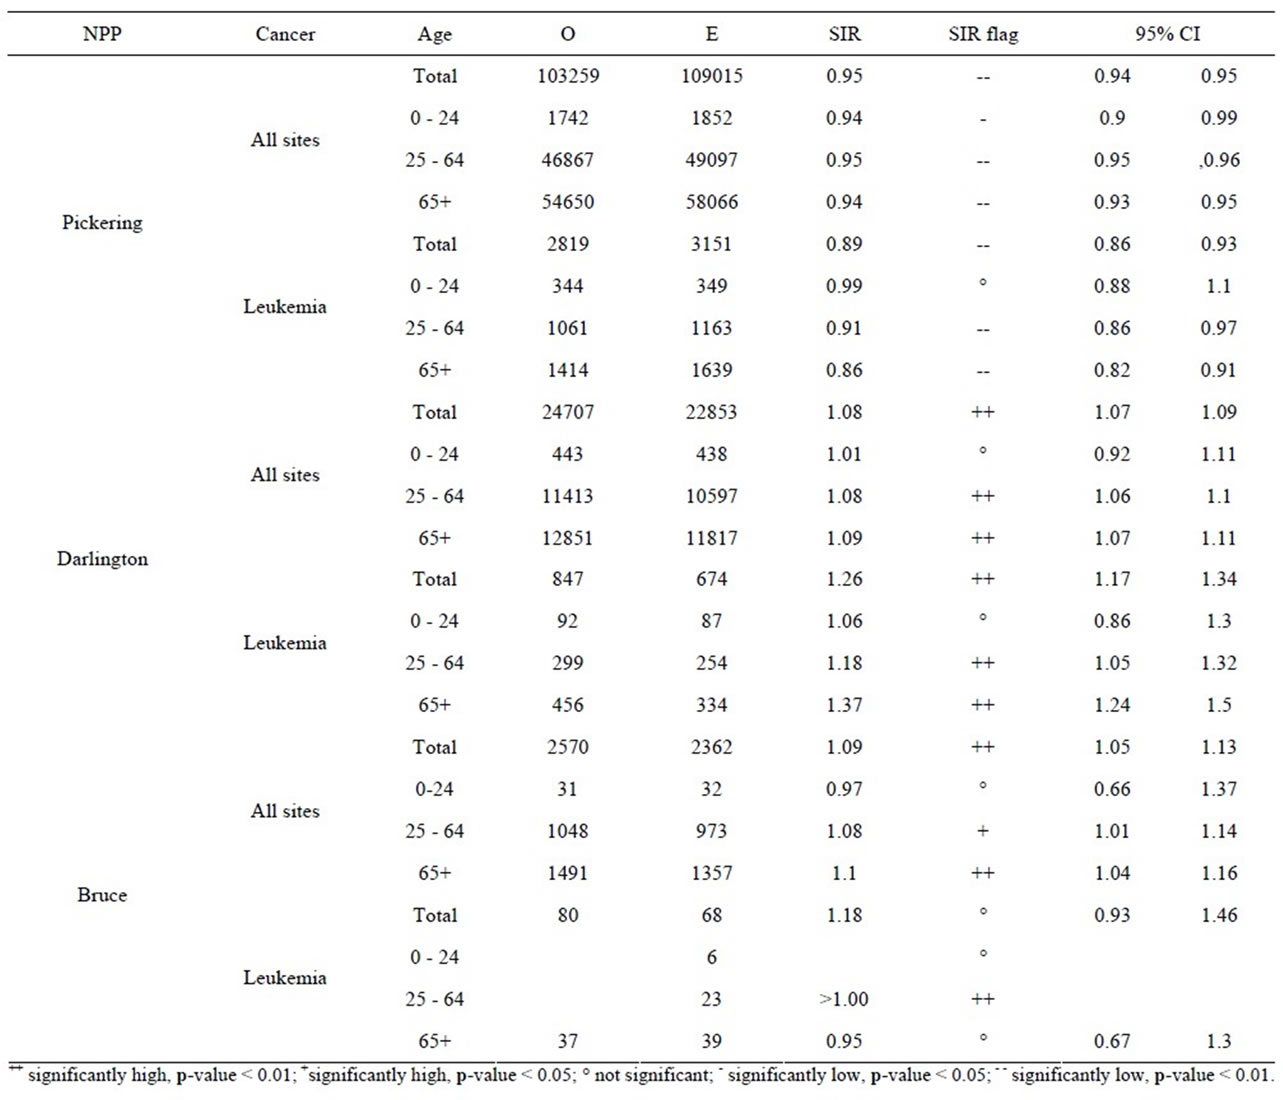
Table 7. Cancer incidence for all cancer sites and leukemia for people living within a 25 km radius of an Ontario NPP at time of diagnosis, by age group, 1990-2008.
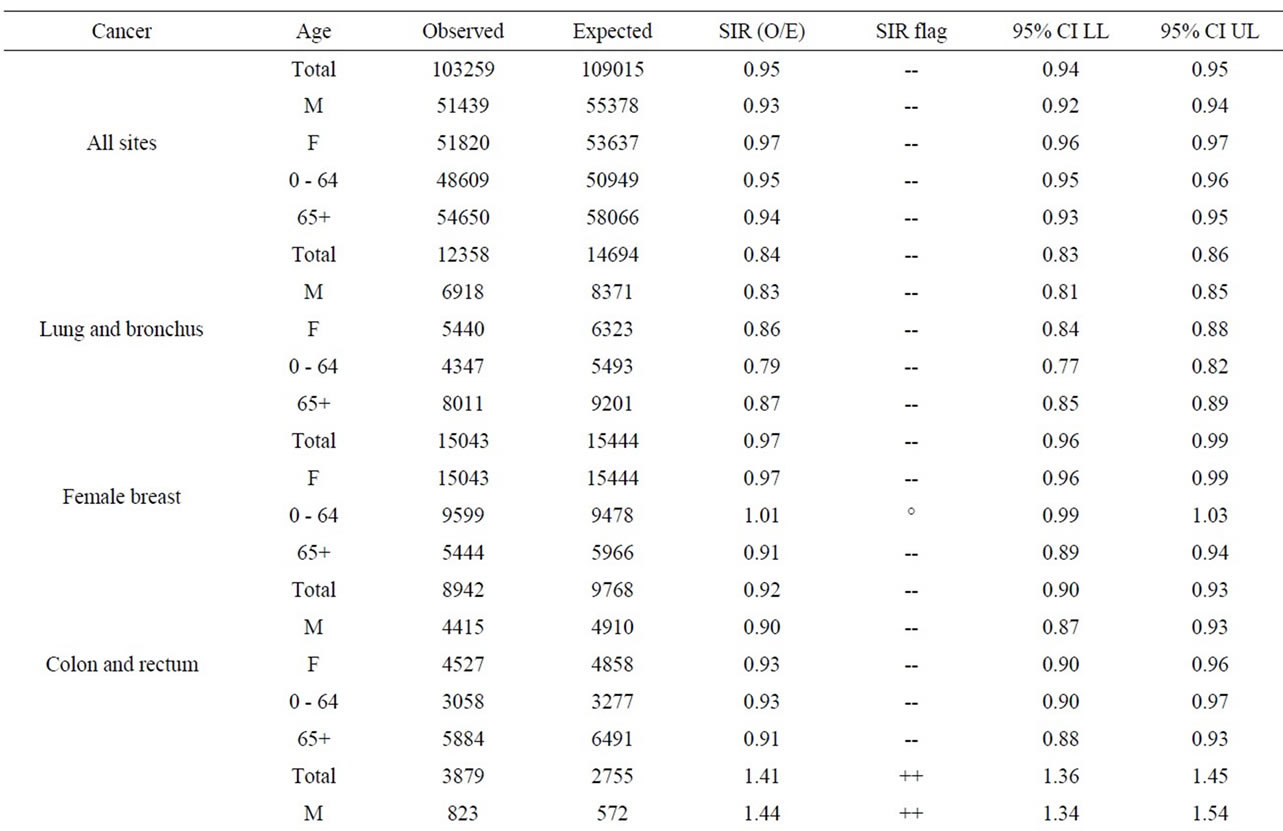
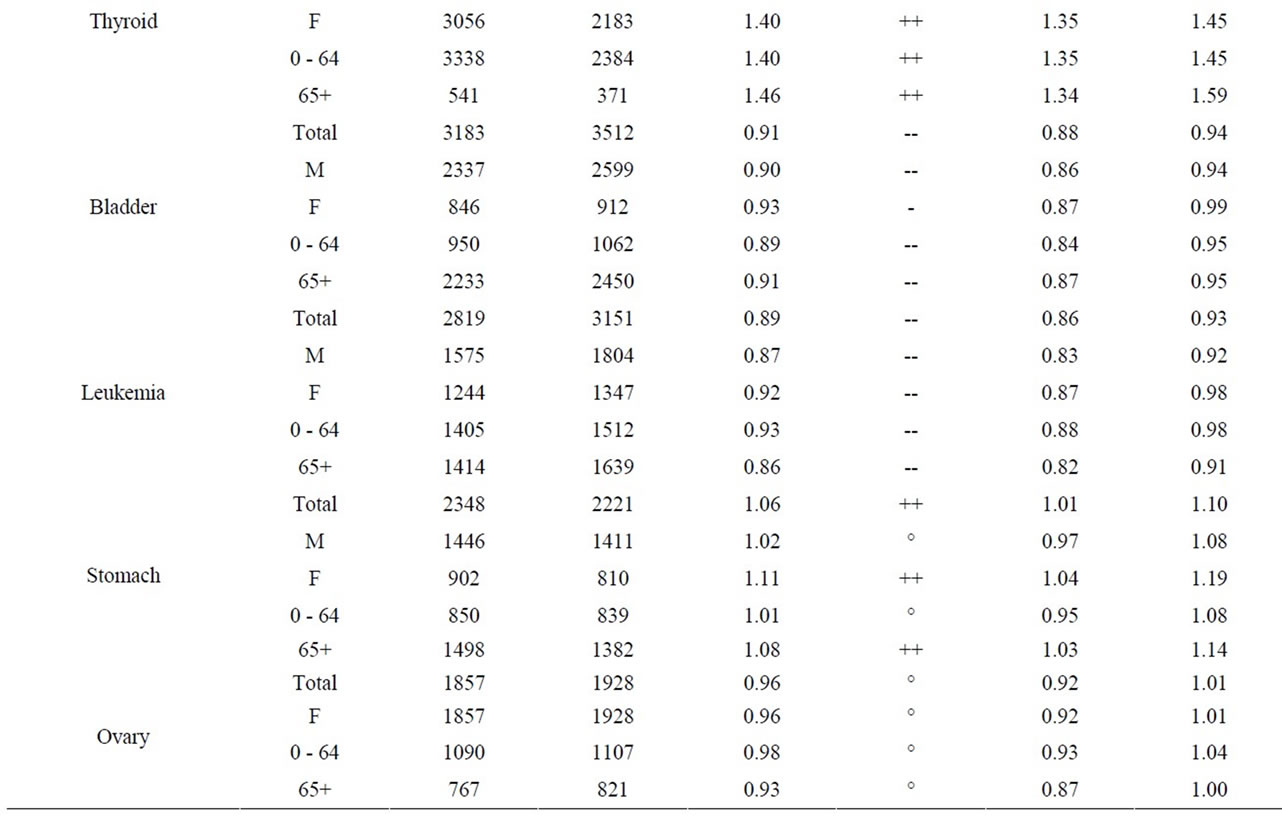
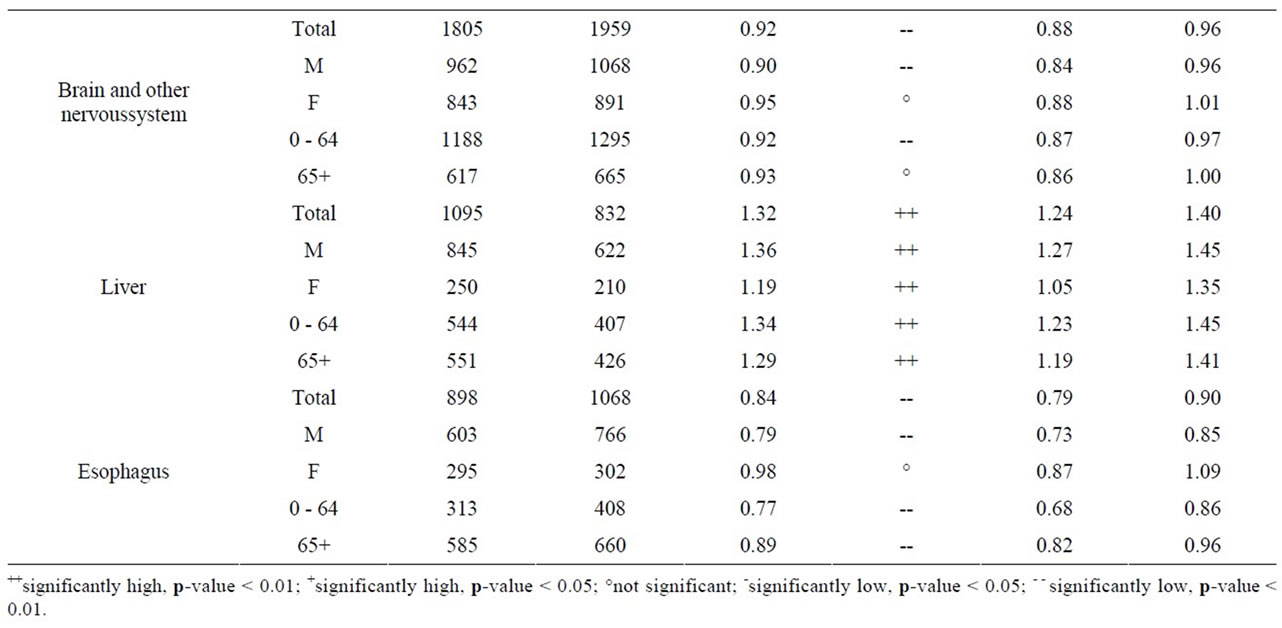
Table 8. Cancer incidence for people living within a 25 km radius of Pickering NPP at time of diagnosis, by sex and age group, 1990-2008.
aged 0 - 14 in Durham Region and Bruce County was similar to Ontario. Breast ovary, stomach, brain and other nervous system, liver and esophagus cancer were either significantly low or similar to Ontario in Durham Region and Bruce County. All cancers sites combined, lung and bronchus, thyroid, bladder, and leukemia were significantly high in Durham Region but either significantly low or similar to Ontario in Bruce County. Colon and rectum cancer was significantly high in Bruce County but similar to Ontario in Durham Region (Table 11).
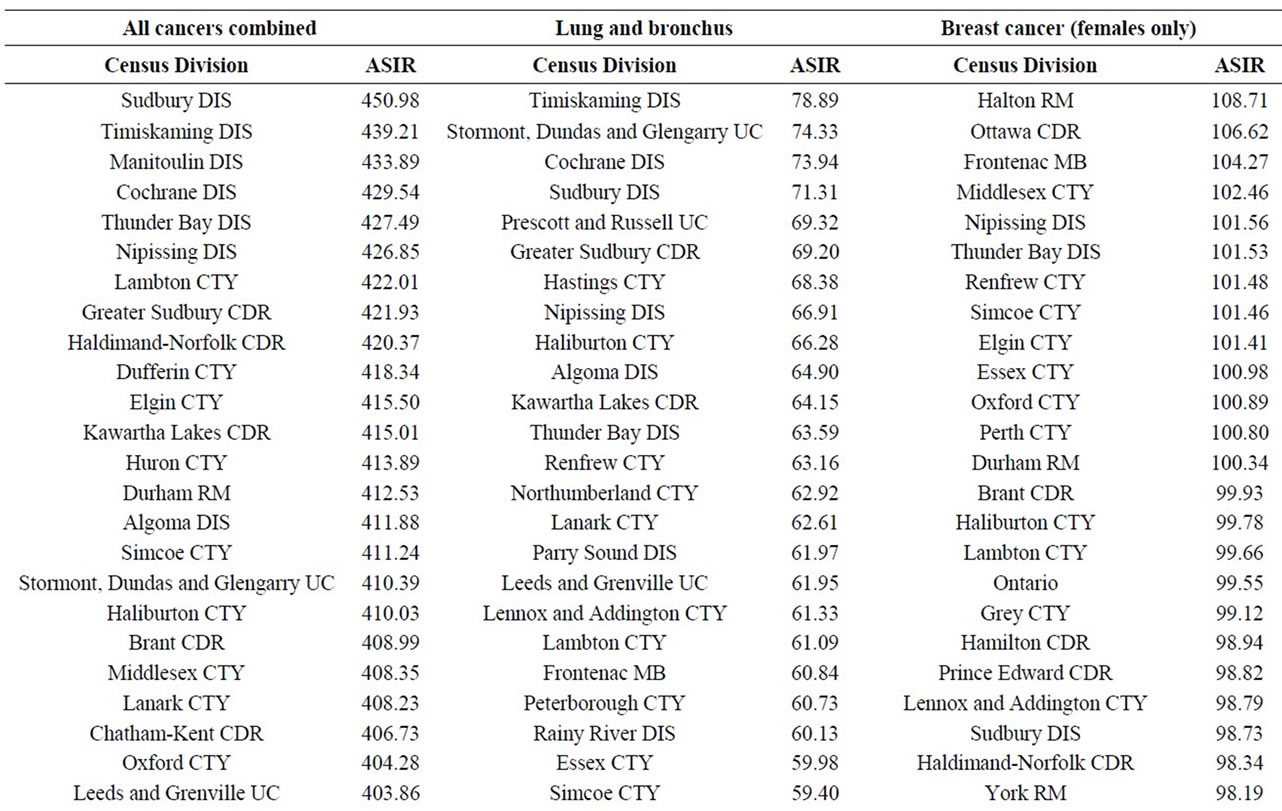
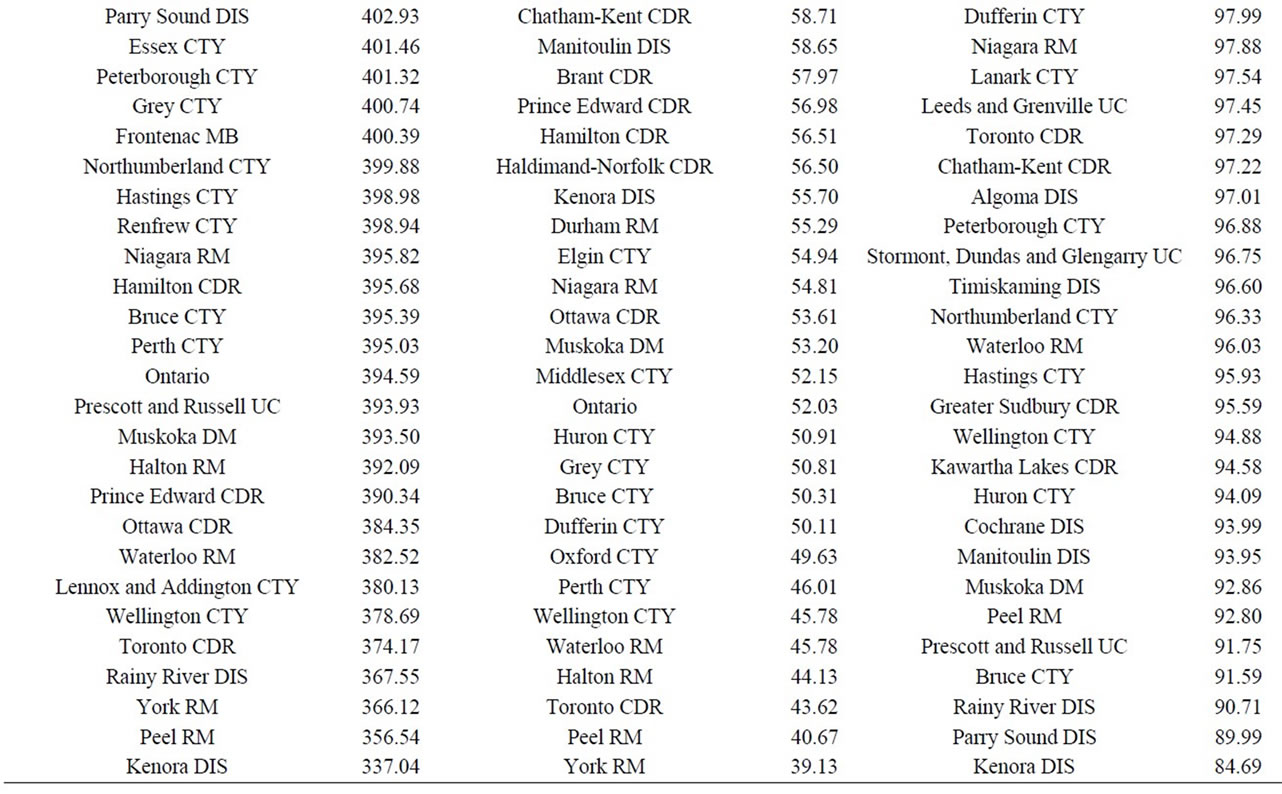
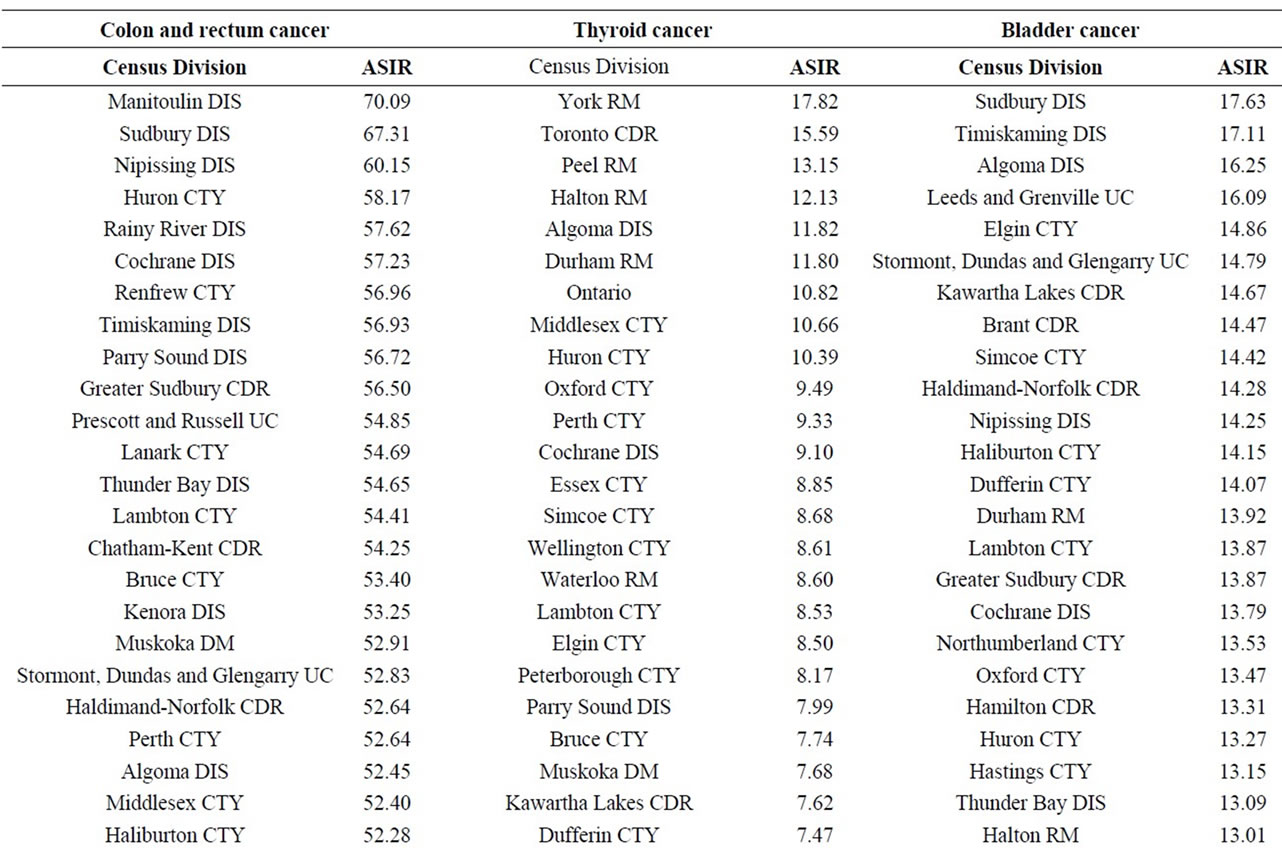
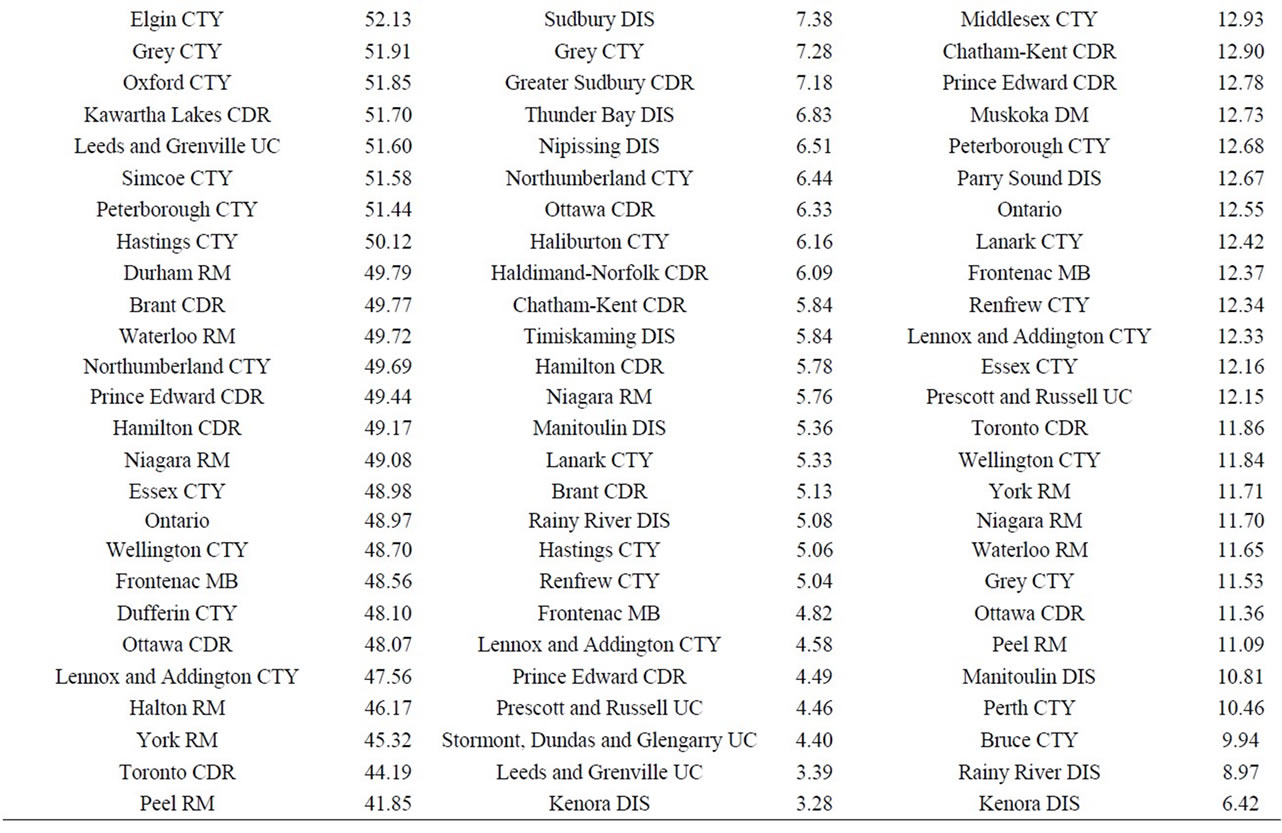
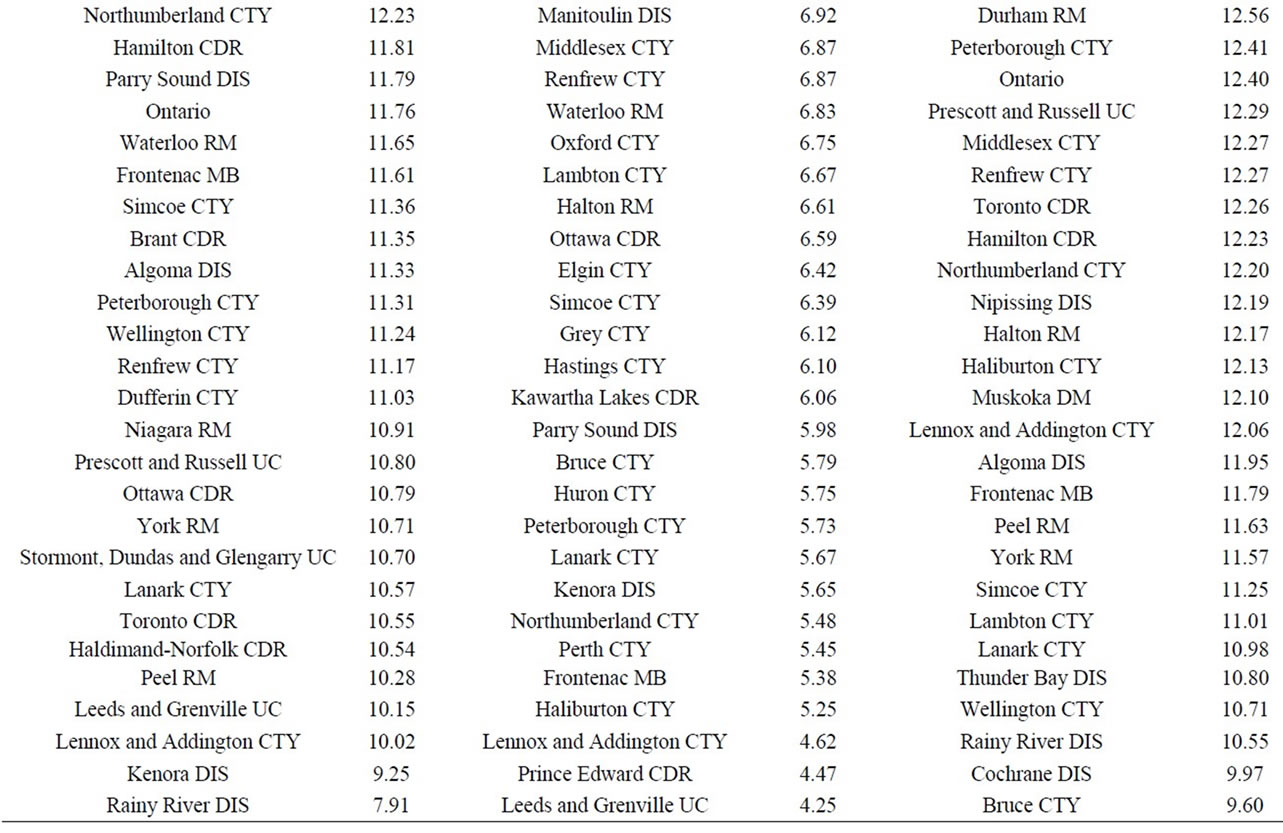
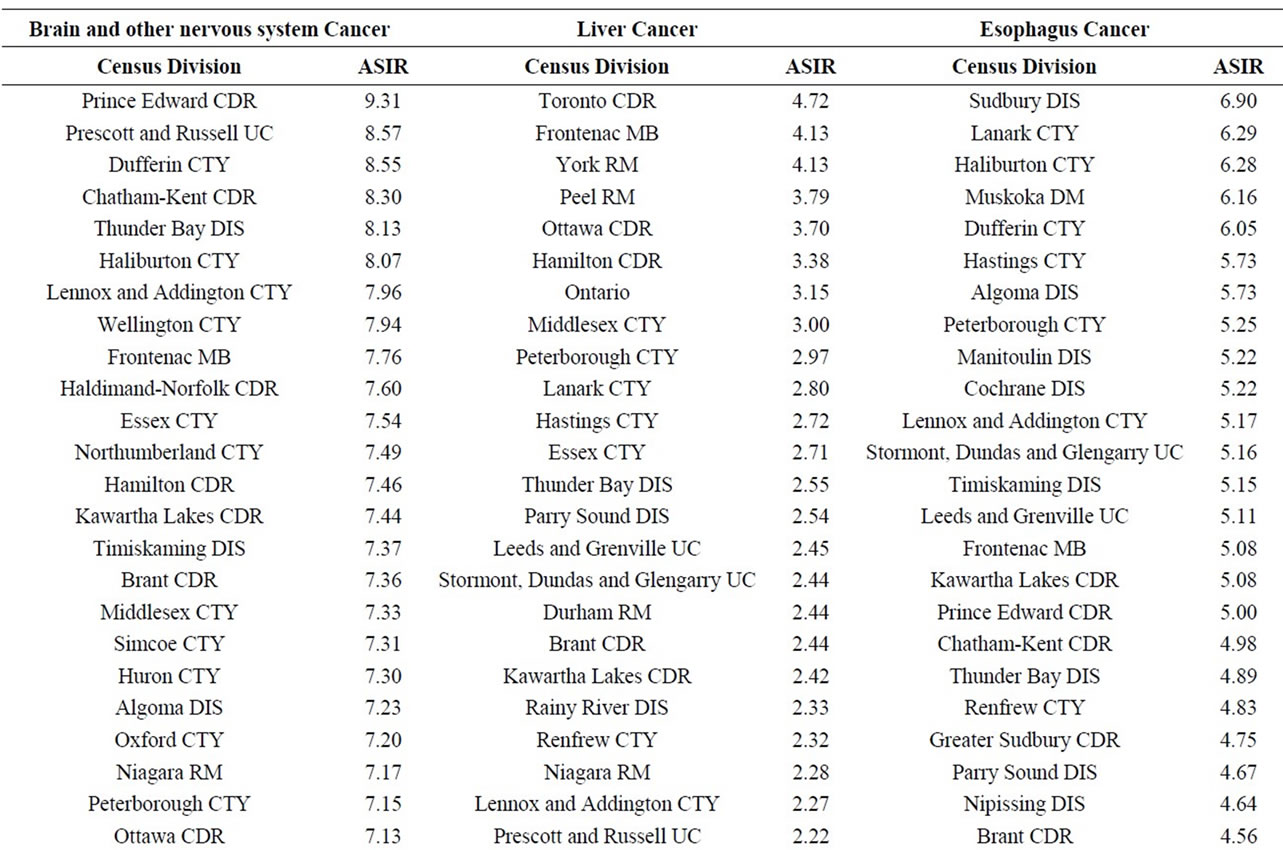
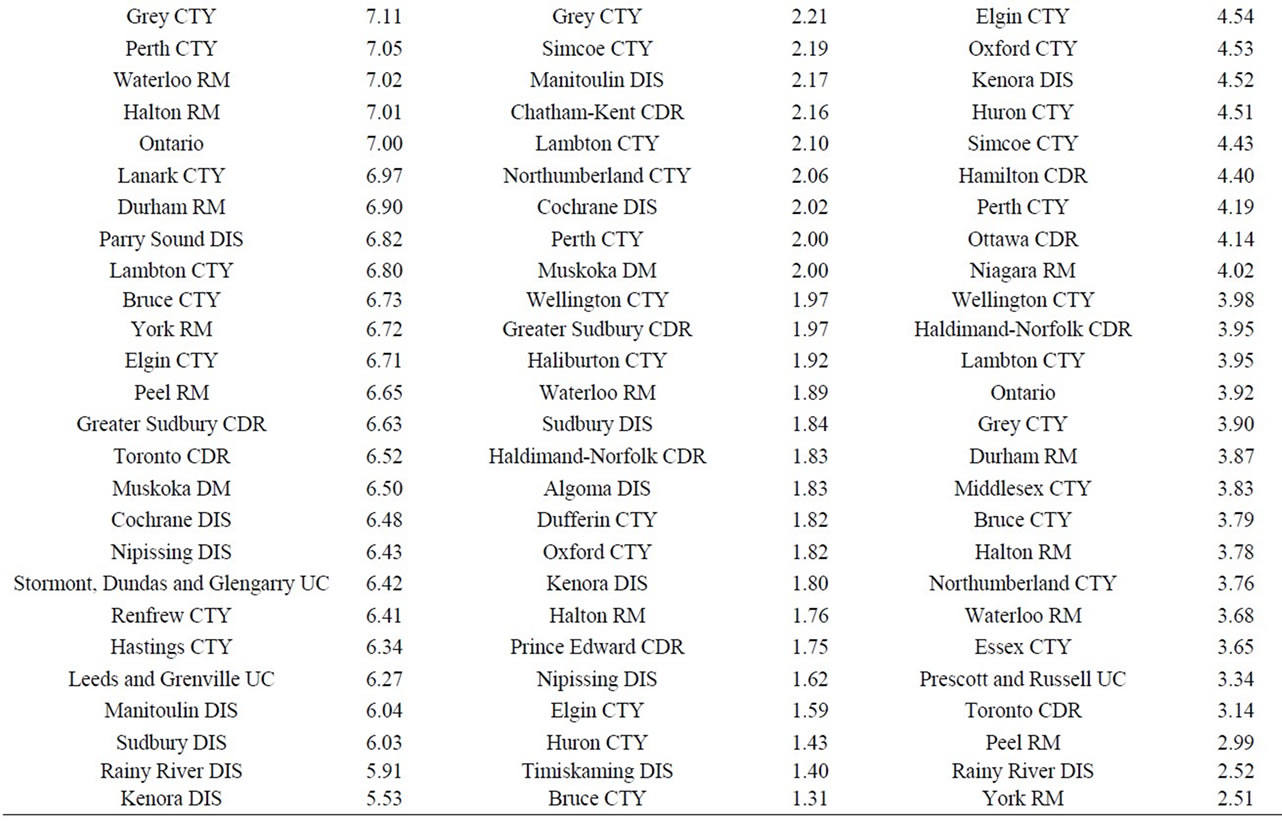
Finally, data on cancer incidence for the cancer sites analyzed in this study across all census divisions (CDs) in Ontario were used for comparison with cancer incidence around the three Ontario NPPs. The data in Table 12 for all ages (0 - 85+) indicate that there is a large geographical variation in cancer age-standardized incidence rates (per 100,000 population) across the province of Ontario. These data show that the incidence rates for all the cancers found in this study to be significantly greater than expected (i.e., all cancer sites combined, lung and bronchus, colon and rectum, thyroid, bladder, leukemia, stomach, liver) were well within the range of cancer incidence within the province. Likewise, the CDs with the highest cancer incidence rates were not those included in our study (Durham Region, Bruce County).
4. Discussion
The primary strength of this study is its inclusion of dose information for various age groups around each NPP generated from radiological releases and environmental monitoring data. This improves on the recent epidemiological studies that used distance of a residence from an NPP as a surrogate for radiation dose data.
Another strength of this study is the quality of the cancer incidence data. Cancer reporting to the OCR and the CCR is virtually complete and of high quality, since it is routinely checked for accuracy through regular assessments by Statistics Canada and the cancer registries [44,45]. Likewise, the Census of Canada undergoes vigorous quality and confidentiality procedures to assure the accuracy and privacy of census information [50]. Incidence data is preferred to mortality data, since detailed clinical and demographic information is collected on individual cases. If any advances in treatment occur during the study period, mortality would become a less sensitive outcome, whereas incidence would be unaffected. Likewise, cancers with high survival rates, such as thyroid cancer, would not be detected by mortality statistics.
The main limitation of an ecological study is that associations at the population level do not necessarily reflect the biological effect at the individual level [46,52,56]. Uniform doses are assigned to the group, whereas the doses received by individuals vary, and at the individual level are also highly uncertain. The very detailed and conservative public doses used in this study provide assurance that actual residents around the NPPs had lower doses. Ecological studies do not typically provide this type of detailed information.
Radioactive emissions from the three Ontario NPPs result in very low concentrations of radionuclides in the environment around the plants and consequently doses to members of the public from all exposure pathways are a small fraction of the natural background radiation in the
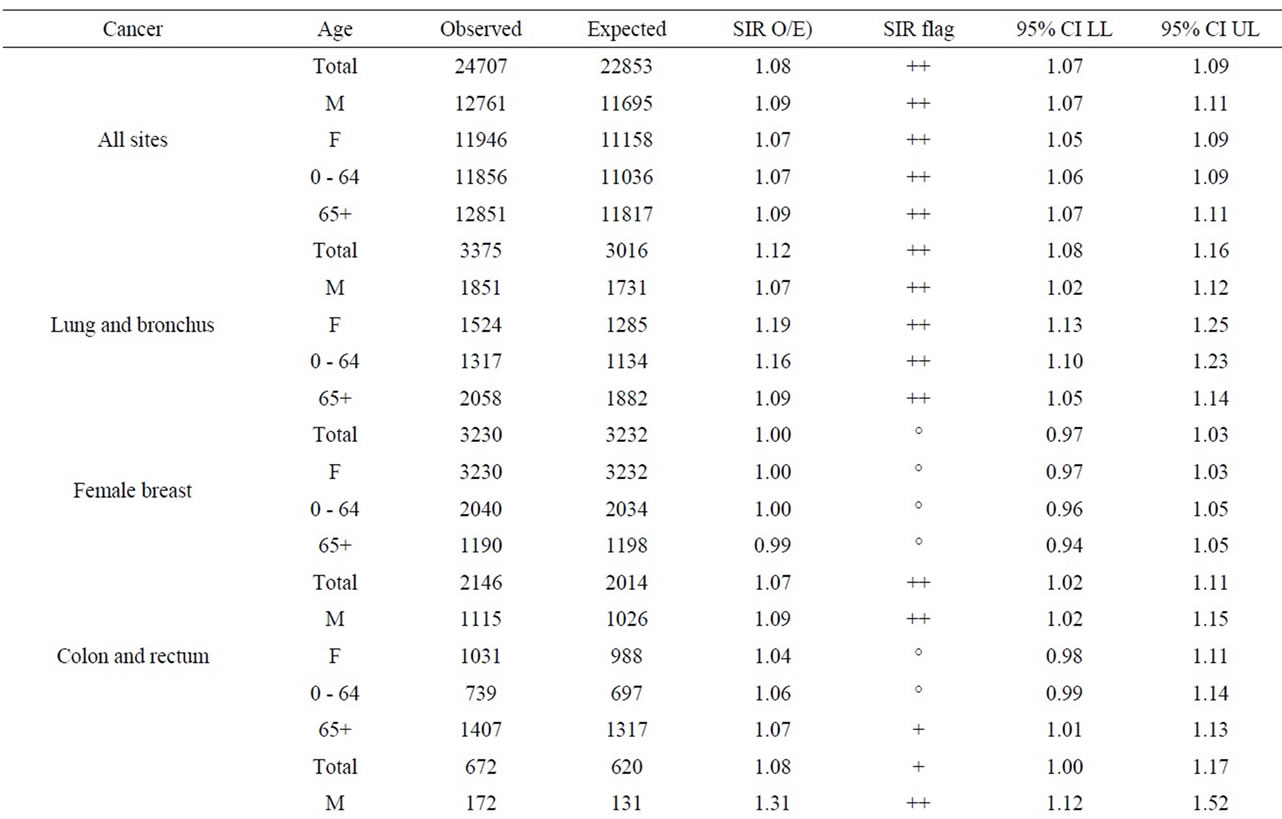
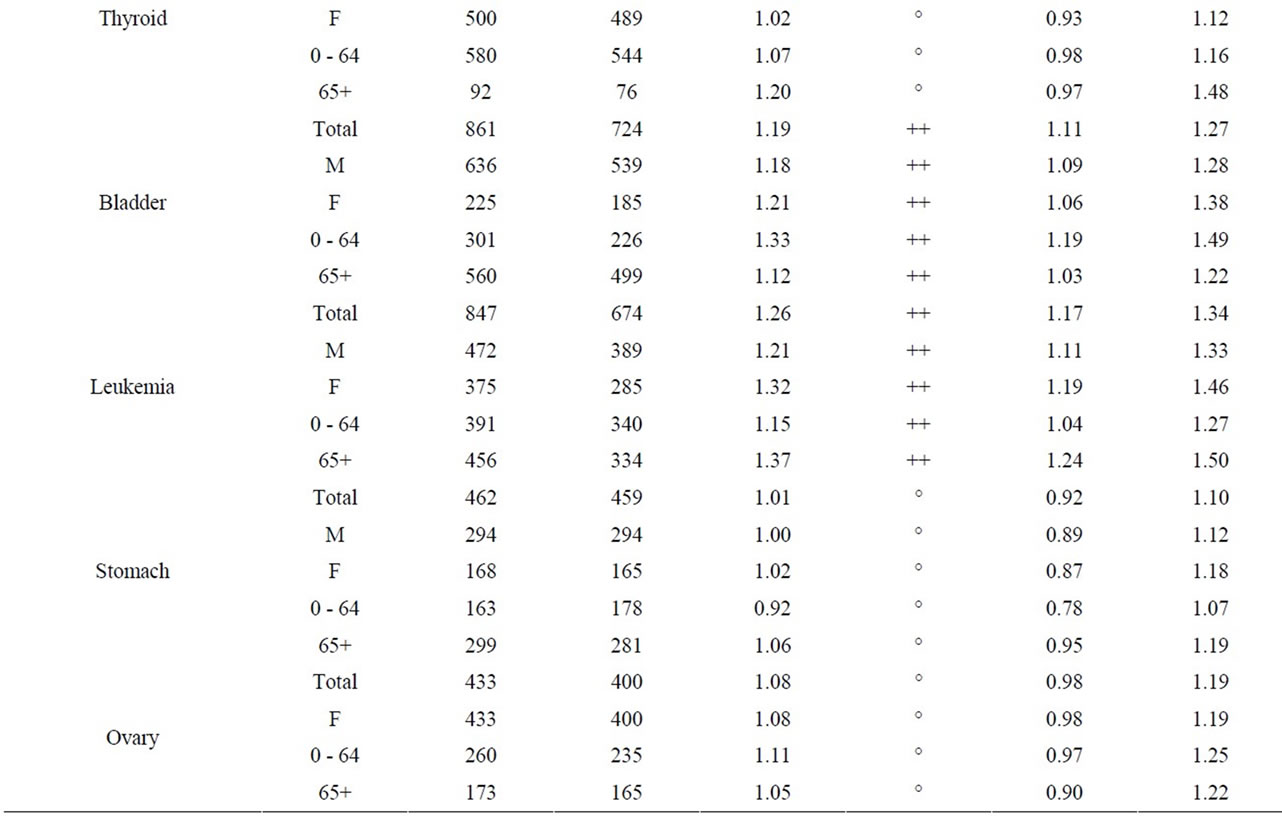
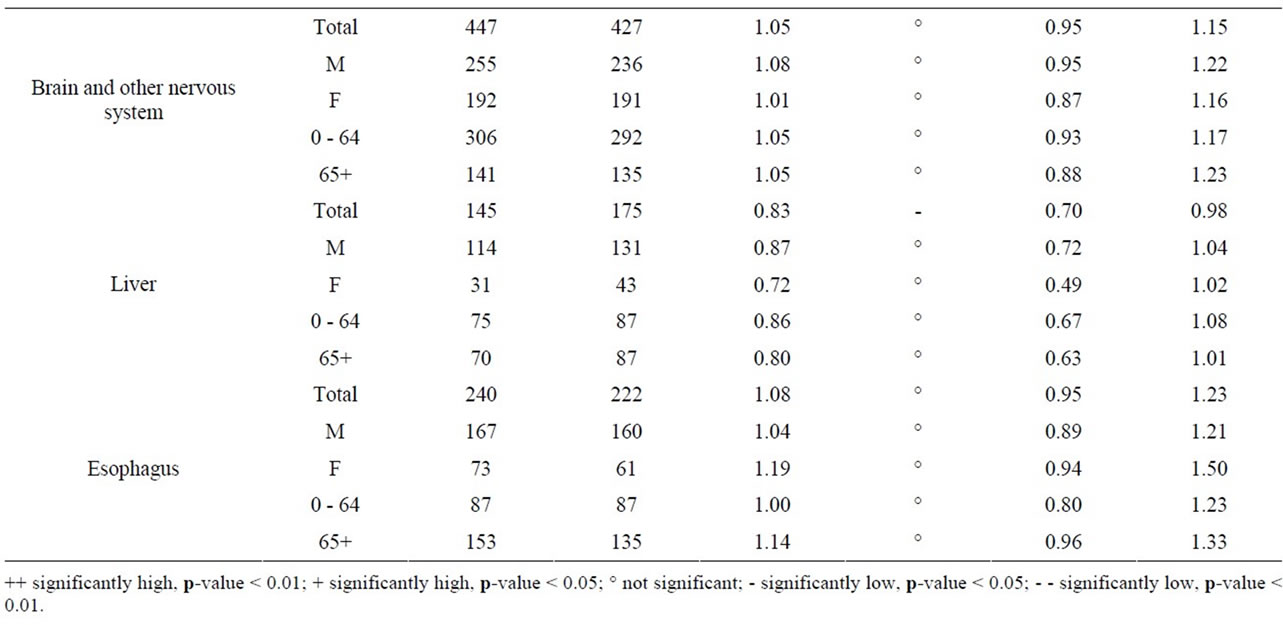
Table 9. Cancer incidence for people living within a 25 km radius of Darlington NPP at time of diagnosis, by sex and age group, 1990-2008.
two regions where the NPPs are located (see Table 3). The doses are also well below the regulatory public dose limit of 1 mSv/year under the CNSC’s Radiation Protection Regulations.
An analysis of the hypothetical dose plumes based on full time occupancy in a ground level atmospheric release shows that based on average meteorological conditions, the majority of exposure to atmospheric releases would occur over Lake Ontario (Pickering and Darling ton NPPs) and Lake Huron (Bruce NPP) (Figures 1-3). Near the Pickering NPP, prevailing winds travel towards the south; near the Darlington NPP they travel towards the south south east (SSE); and over Lake Huron near the Bruce NPP, towards the north. It can also be observed that almost all this hypothetical exposure is contained within 5 km from the centre point of the facility, much of which is located over the site of the facility itself. Even for such unrealistic exposure conditions, all annual doses remained below the 1 mSv/year public dose limit even for an individual hypothetically located at the stack for a full year.
Using the geographical representation of the dose plumes and the critical group doses (Figures 1-3) together with the 2006 census data for the Durham Region [57,58], we estimated that approximately 0.01% of the 25 km radius population reside within 5 km of the Darlington NPP (approximately 40 individuals). Hence, the majority of the population within the 25 km zone receives little or no exposure to radiation from the NPP. An analysis using the same data sources was also conducted for the area around the Pickering NPP. Approximately 1% of the 25 km radius population resides within 5 km of the Pickering NPP (approximately 16,000 people). The Bruce NPP is located in a semi-rural area with low population density; approximately 565 people reside within 5 km of the facility.
The dose plume modeling data (not shown) reveal that the hypothetical doses from air emissions were primarily due to releases of noble gases (i.e., external dose from immersion) at Pickering (~75%), Bruce (~75%), and Darlington (~95%), with some dose being due to tritium oxide (internal dose from inhalation) at Bruce (~25%) and Pickering (~25%), and Carbon-14 (internal dose from inhalation and external dose from immersion) at Darlington (~5%). Radioactive particulates and radioactive iodines contributed very little to the dose (<1%). Doses from exposure to radioactive iodine were conservatively estimated using values set at the detection limit of the in-stack monitor because of extremely low releases. Milk samples have been collected weekly at farms around all three NPPs (part of the REMP) and values were below detection limits during the entire study period.
Recent epidemiological studies of childhood leukemia around nuclear facilities have used distance from the facility as a surrogate for data on exposure to radiation from the plants [1,2,10,12-14,59]. Our study has shown that doses to members of the public do not decrease uniformly with distance from an NPP; in fact the data presented in Figures 1-3 for the three Ontario NPPs show that doses further away from the plants can be higher than doses to the closest critical groups. Radiation dose to members of the public from routine operation of NPPs is controlled by several factors, including: the type of
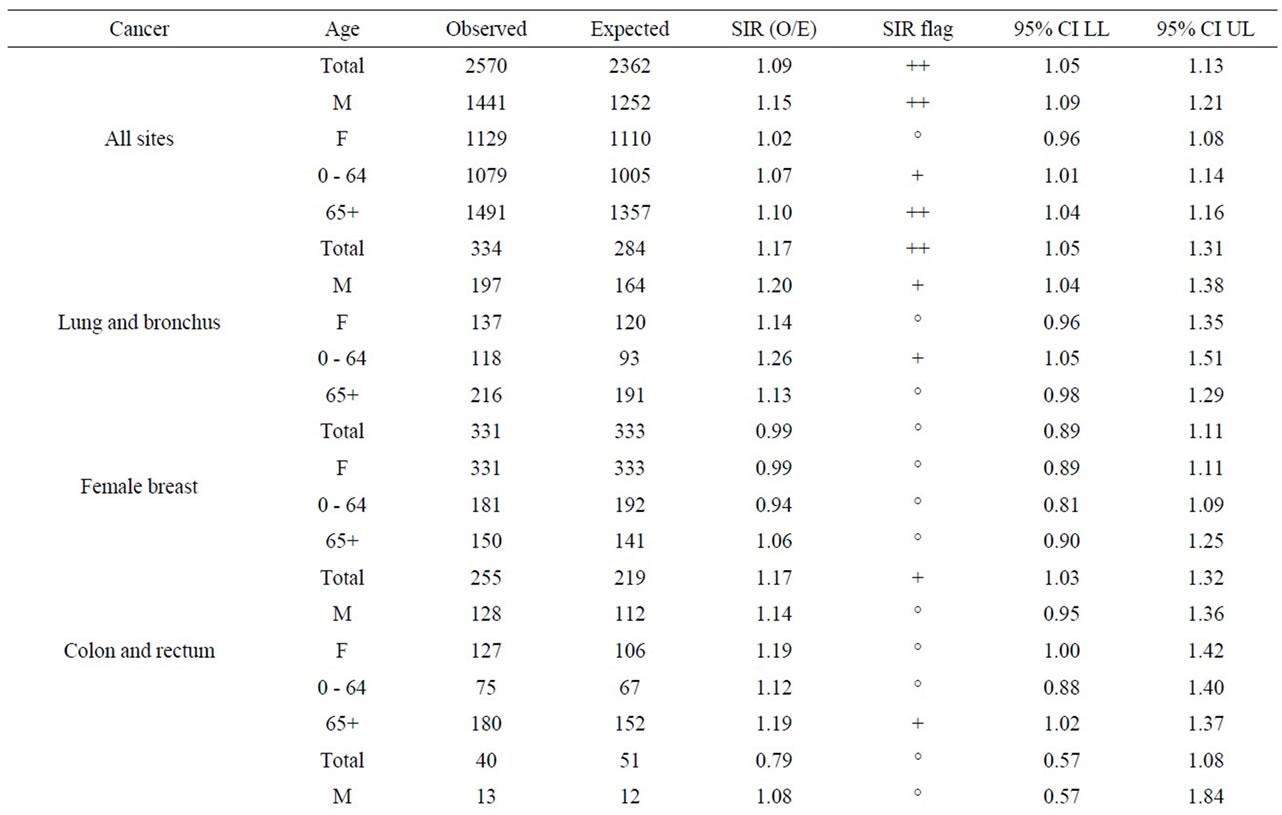
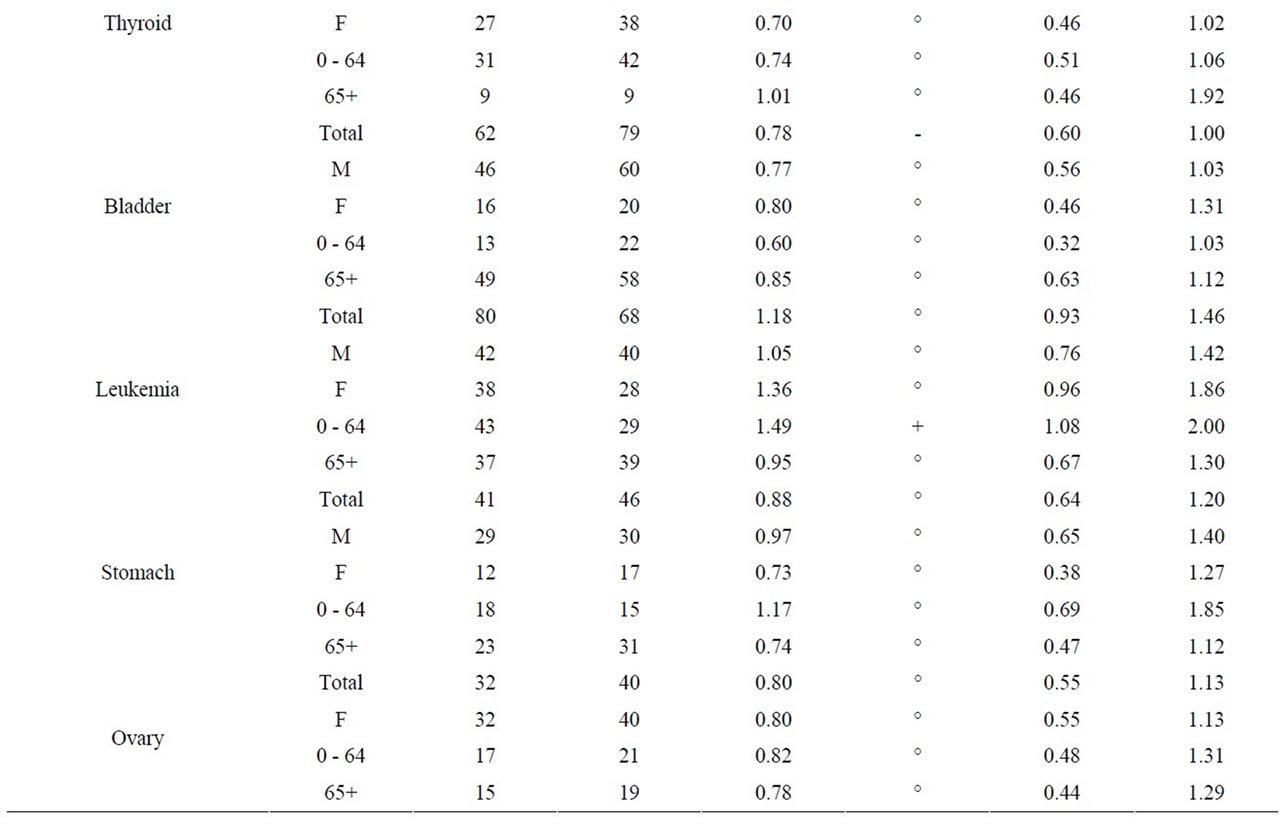
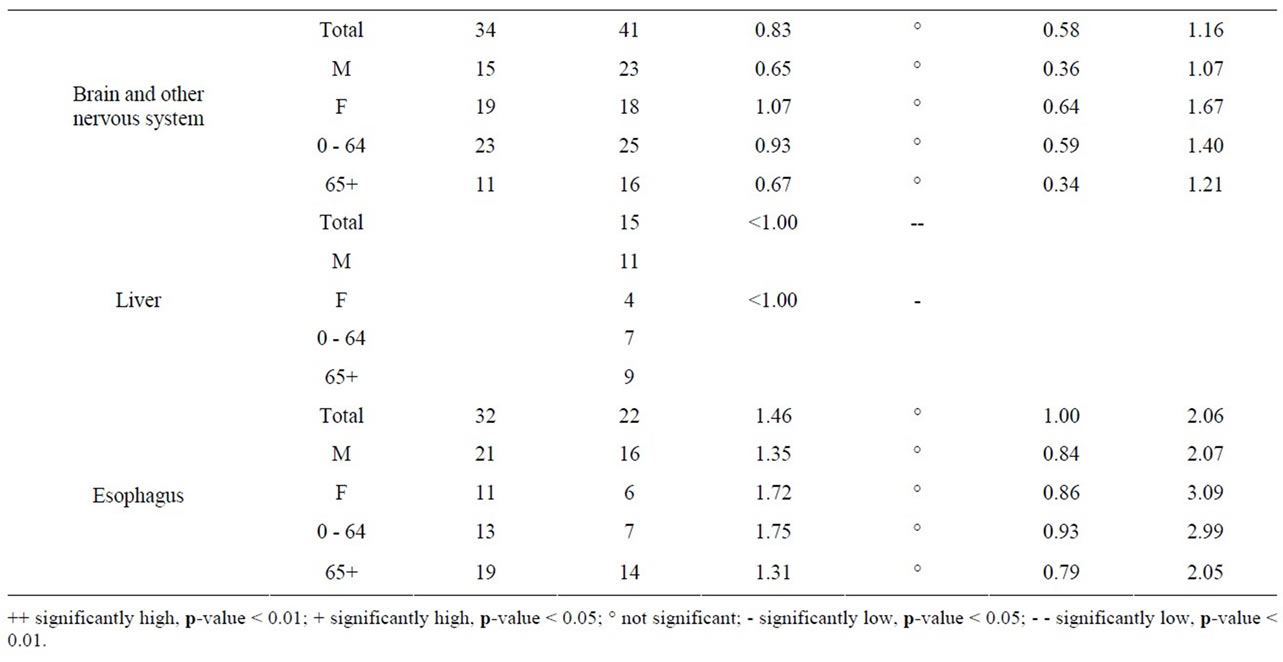
Table 10. Cancer incidence for people living within a 25 km radius of Bruce NPP at time of diagnosis, by sex and age group, 1990-2008.
release (i.e., air emissions or liquid effluent discharges); the characteristics of the release (i.e., stack height); the quantity, type and radioactive decay properties of the nuclear substances released; the meteorological conditions at the facility (i.e., direction of prevailing winds and mixing height); and the diet and lifestyles of people. Thus, distance from an NPP as shown in this study is only one factor affecting exposure of members of the public to plant emissions, and it should not be used in isolation as a surrogate for radiation exposure data.
Cancer incidence, especially childhood leukemia, in populations living near nuclear facilities has been the topic of much scientific interest [6,59-61] and public concern since the 1980s. Authoritative reviews confirmed only three leukemia clusters have persisted over time around nuclear facilities (Sellafield in England, Dounreay in Scotland and Krümmel in Germany). Although some clusters of childhood leukemia cases exist locally, results based on multi-site studies around nuclear facilities do not indicate an excess of cancer globally. Many studies have investigated possible origins of the observed clusters around specific sites, but up to now, none of the proposed hypotheses (i.e., parental pre-conception exposure [16], infectious agent associated with population mixing [62,63]) can explain them [59].
The most important finding of this study is that there is no evidence of childhood cancer clusters within 25 km of the three Ontario NPPs. In fact, cancer incidence (i.e., leukemia, non-Hodgkin lymphoma) in young children (aged 0 - 4) was lower than the general Ontario population (but not statistically significantly so). Cancer incidence in children aged 0 - 14 was similar to the general Ontario population. Finally, childhood cancer (aged 0 - 14) was similar to Ontario within 10 km of the Pickering NPP (SIR = 0.84, 95% CI: 0.61, 1.13) and Darlington NPP (SIR = 0.97, 95% CI: 0.57, 1.53). Information was not provided for Bruce NPP or within the 5 km radius of the Darlington and Pickering NPPs because of few cases.
Overall, there is no consistent cancer incidence pattern among people living near the three NPPs. Some types of cancer were statistically significantly higher than expected; however, some types of cancer were statistically significantly lower than expected, and some types of cancer were the same as expected compared to the general Ontario population. The incidence of female breast, ovary, brain and other nervous system and esophagus cancer were either significantly low or similar to Ontario for people living near all three Ontario NPPs.
There was no consistent pattern for all cancer sites combined near the three Ontario NPPs. While, it was statistically significantly higher than expected for people living near Darlington and Bruce, it was significantly lower near Pickering (the NPP with the highest critical group doses (0.0067 mSv/year) among the three NPPs). It is not possible to know all of the cancers contributing to this finding, since only radiation-sensitive cancers were selected for this study. However, the most common cancers observed among people living near the three Ontario NPPs were cancers of the lung and bronchus, breast, and colon and rectum, which represent about 35% of all cancers combined, for all three NPPs. This is consistent with the rest of Ontario and Canada [44,55].
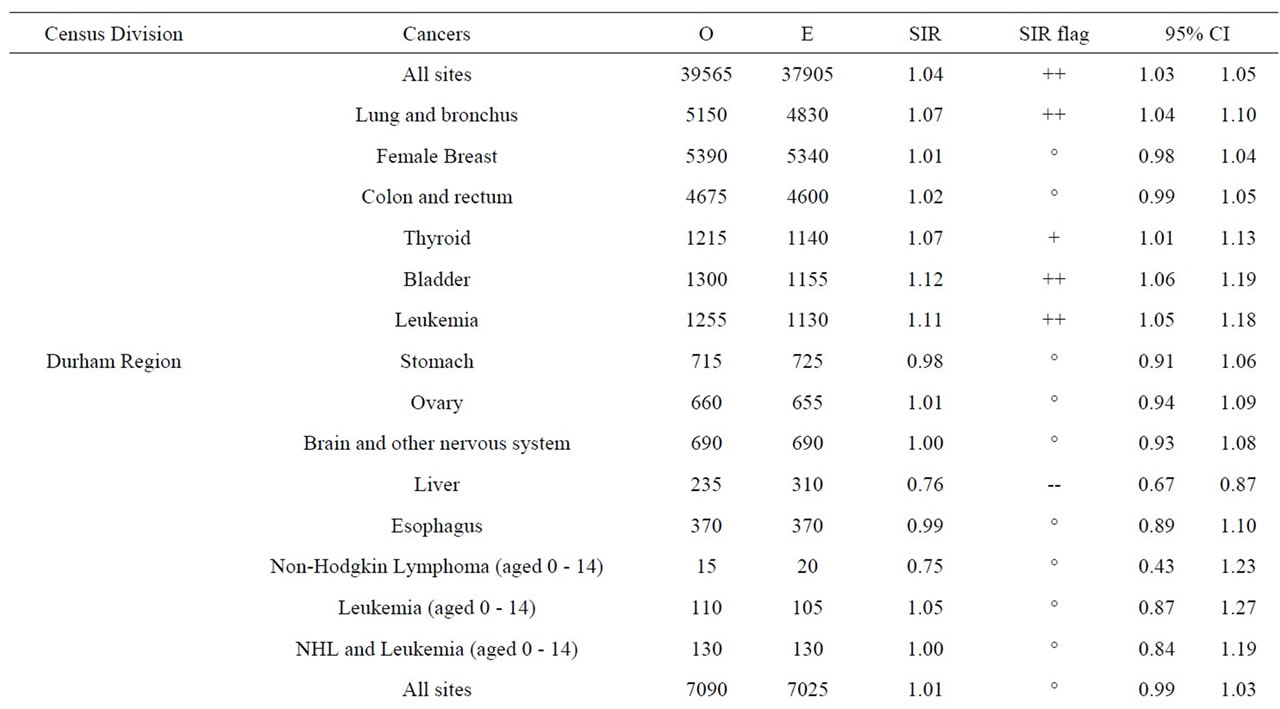
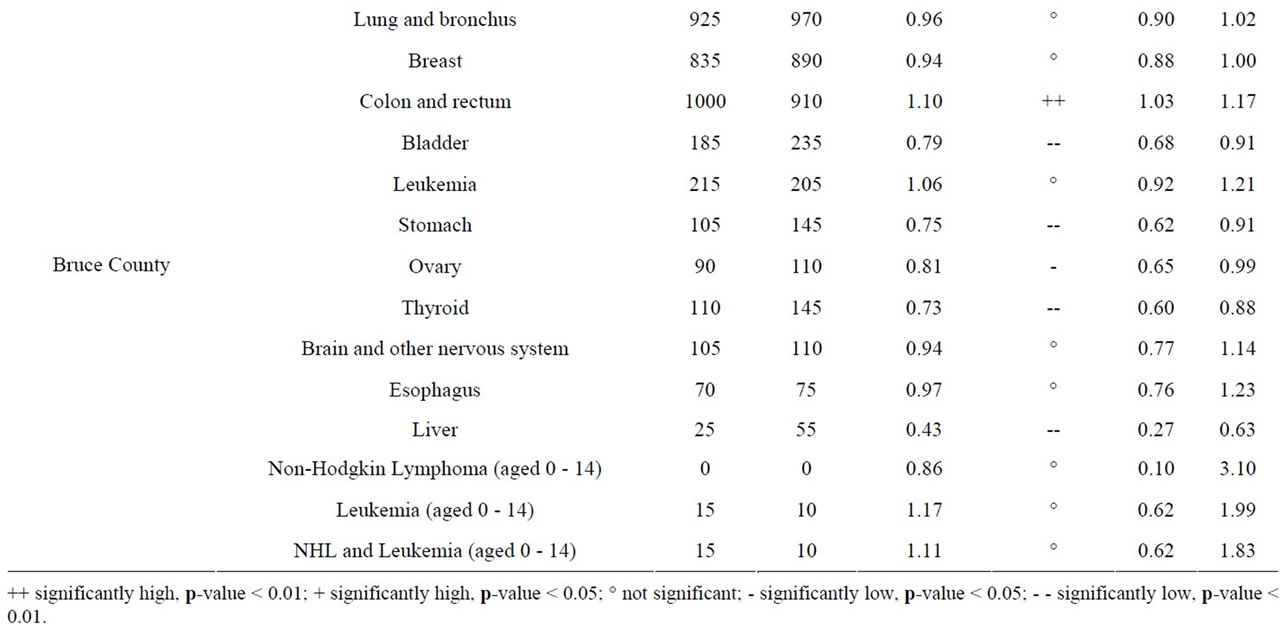
Table 11. Cancer incidence, Ontario by 2006 census division, all ages (0-85+) unless otherwise specified, 1992-2010.
Cancer incidence was statistically significantly higher than expected for cancer of the lung and bronchus among people living near the Darlington and Bruce NPPs. Cancer of the lung and bronchus was significantly low near the Pickering NPP. The most important risk factor for lung cancer is tobacco smoking, with relative risks for current smokers being greater than 10- to 20-fold higher than that of non-smokers [64-66]. Cancers of the bladder, stomach, and liver have been shown to be caused by tobacco smoking [66,67]. Bladder cancer was significantly high near the Darlington NPP, but significantly low near the Pickering and Bruce NPPs. Stomach cancer was significantly high near the Pickering NPP, but was similar to the Ontario average near the Darlington and Bruce NPPs. Liver cancer was significantly high near the Pickering NPP, but was significantly low near the Darlington and Bruce NPPs. The statistically significant higher-than-expected incidence for cancer of the lung
 (a)
(a)
 (b)
(b) 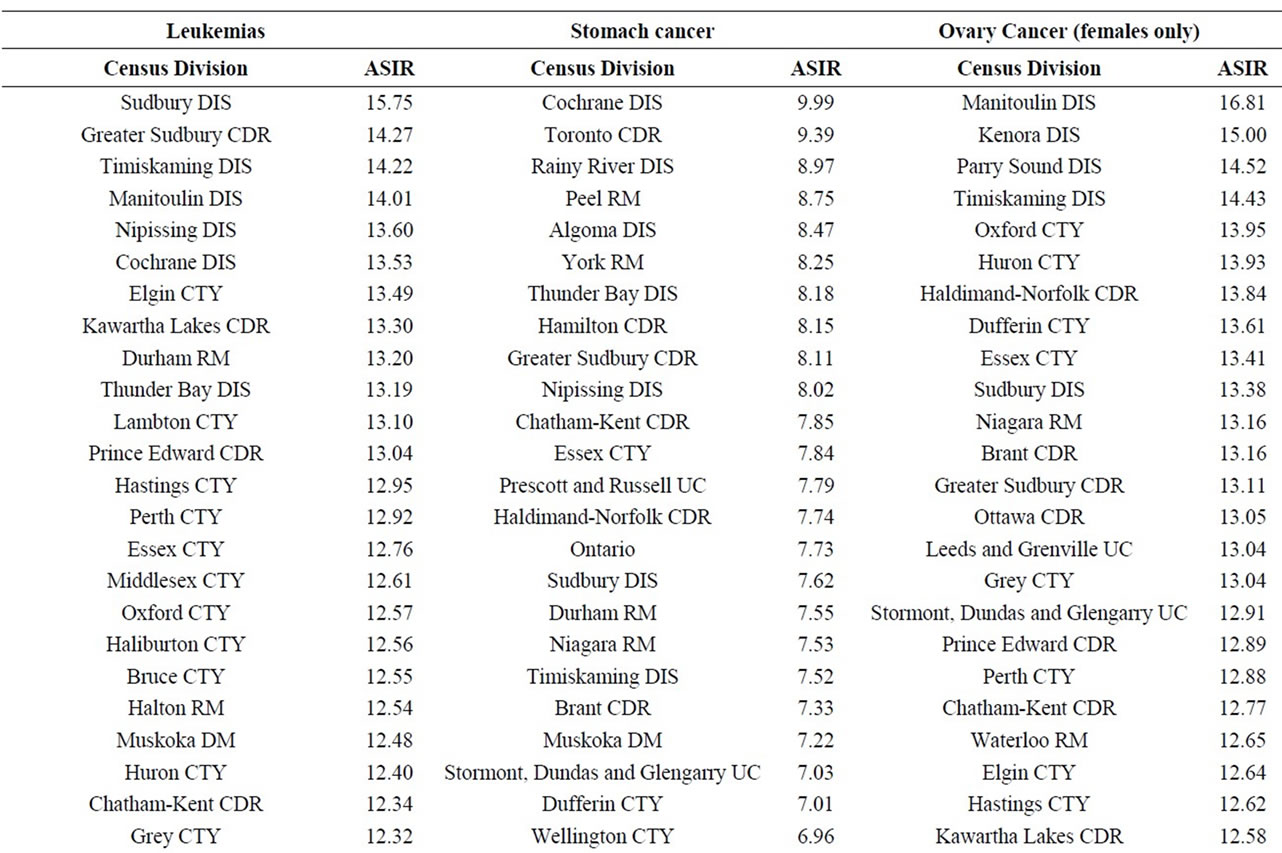
 (c)
(c)
 (d)
(d)
Table 12. Age-standardized incidence rates (ASIRs) per 100,000 population, Ontario by 2006 census division, all ages (0-85+), 1992-2010; presented from highest to lowest ASIR.
and bronchus, bladder, stomach and liver in this study suggests that tobacco smoking may be a confounding factor.
There was no consistent pattern for colon and rectum cancer near the three NPPs. Colon and rectum cancer incidence was significantly higher than expected near the Darlington and Bruce NPPs (especially among men aged 65+ years), but was significantly lower near the Pickering NPP. This is consistent with the main risk factors for colorectal cancer (e.g. age (particularly those over the age of 50) and sex (males)) [68,69].
There was no consistent pattern of thyroid cancer near all three NPPs. Thyroid cancer incidence was statistically significantly higher than expected near the Pickering and Darlington NPPs, but was similar to the Ontario population near for Bruce NPP. Exposure to large amounts of ionizing radiation, family history and iodine (high or low) in the diet are the main risk factors for thyroid cancer [68]. However, radiation risk decreases sharply with increasing age-at-exposure and there is little evidence of increased thyroid cancer rates for those exposed after age 20 [70,71]. Releases of radioactive iodine, which is the primary cause of radiation-related thyroid cancer [72], have been extremely low, or below detection limits at all three NPPs during the study period. Concentrations of radioactive iodine in weekly milk samples have remained below the limit of detection during the entire study period. Thus, exposure of the public to radiological emissions from the Pickering and Darlington NPPs is not a likely cause of excess thyroid cancer around these two NPPs.
There was no consistent pattern for leukemia near all three NPPs. Leukemia was statistically significantly higher than expected near the Darlington NPP. However, leukemia incidence for children aged 0 - 4, 0 - 14, and young adults aged 0 - 24 was either less than or similar to the general Ontario population near all three NPPs. Therefore those aged 25 - 64 are driving the significant finding near the Darlington NPP. Although high radiation doses can cause leukemia [46], the lack of significant findings among children (who are most vulnerable to radiation) suggests that other risk factors are involved, especially considering the very low doses (critical group doses ≤ 0.0067 mSv/year) found in this study.
In our study, industrial sources of radiation only contribute a small fraction of the public’s overall exposure to radiation. While the critical group doses around the three NPPs are ≤0.0067 mSv/year, natural background radiation is on the order of 1.34 mSv/year around the Pickering and Darlington NPPs and 2.02 mSv/year around the Bruce NPP. Hence, radiation doses from the three NPPs do not provide a plausible explanation for any observable increases in cancer incidence above Ontario baseline levels.
Geographic variation of cancer incidence is not uncommon [67,73-76] and as illustrated in our spatial analysis of cancer incidence at the CD level in Ontario. A study in Ontario [77] showed that most of the geographic variation in cancer rates was found to be associated with variation in known risk factors, and no broad regional effects remained after adjustment for these factors. After known risk factors were taken into account, there was no evidence of a strong difference in cancer risk in Ontario that would be expected if environmental factors (i.e., related to air or water quality) were operative at a regional scale. Another Ontario study found similar results [78]. Both of these studies cover the earlier time period of our cancer incidence data suggesting that known risk factors are a likely explanation of the variations in cancer incidence observed in our study.
5. Conclusions
The most important finding of this study is that there is no evidence of childhood cancer clusters (especially childhood leukemia) near the three Ontario NPPs studied (Pickering, Darlington and Bruce). Overall, for all ages, there is no consistent pattern of elevated cancer incidence at any of these three NPPs. Although there were some elevated cancer rates, there was no clear pattern found across age groups, sexes and NPPs. This finding is generally consistent with previous studies. Overall, the cancers are well within the natural variation of disease in Ontario.
Radiation doses to members of the public living near the three NPPs as a result of historical and current-day operations are significantly lower than natural background radiation and the public dose limit of 1 mSv/year. Therefore, on the basis of current radiation risk estimates and the supporting epidemiological literature, radiation is not a plausible explanation for any excess cancers observed within 25 km of any Ontario NPP.
6. Acknowledgements
The cancer incidence data contained in this study are provided by the Public Health Agency of Canada (PHAC) from the Canadian Cancer Registry database at Statistics Canada, with the knowledge and consent of the Ontario Cancer Registry, which supplies the data to Statistics Canada. Their cooperation, as well as the assistance received from Mr. Robert Semenciw, is gratefully acknowledged. We are also grateful for the support provided by Ms. Laura Anderson of the Canadian Nuclear Safety Commission.
REFERENCES
- C. Spix, S. Schmiedel, P. Kaatsch, R. Schulze-Rath and M. Blettner, “Case-Control Study on Childhood Cancer in the Vicinity of Nuclear Power Plants in Germany 1980- 2003,” European Journal of Cancer, Vol. 44, No. 2, 2008, pp. 275-284. doi:10.1016/j.ejca.2007.10.024
- P. Kaatsch, C. Spix, R. Schulze-Rath, S. Schmiedel and M. Blettner, “Leukemia in Young Children in the Vicinity of German Nuclear Power Plants,” International Journal of Cancer, Vol. 122, No. 4, 2008, pp. 721-726. doi:10.1002/ijc.23330
- P. Kaatsch, C. Spix, I. Jung and M. Blettner, “Childhood Leukemia in the Vicinity of Nuclear Power Plants in Germany,” Deutsches Ärzteblatt International, Vol. 105, No. 42, 2008, pp. 725-732.
- J. Michaelis, B. Keller, F. Haaf and P. Kaatsch, “Incidence of Childhood Malignancies in the Vicinity of West German Nuclear Power Plants,” Cancer Causes & Control, Vol. 3, No. 3, 1992, pp. 255-263. doi:10.1007/BF00124259
- P. Kaatsch, U. Kalersch, R. Meinert and J. Michaelis, “An Extended Study on Childhood Malignancies in the Vicinity of German Nuclear Power Plants,” Cancer Causes & Control, Vol. 9, No. 5, 1998, pp. 529-533. doi:10.1023/A:1008883530341
- Committee on Medical Aspects of Radiation in the Environment (COMARE), “Fourteenth Report, Further Consideration of the Incidence of Childhood Leukemia Around Nuclear Power Plants in Great Britain,” 2011. www.comare.org.uk/press_releases/documents/COMARE14report.pdf
- C. Sermage-Faure, D. Laurier, S. Goujon-Bellec, M. Chartier, A. Guyot-Goubin, J. Rudant, D. Hémon and J. Clavel, “Childhood Leukemia around French Nuclear Power Plants—The Geocap Study, 2002-2007,” International Journal of Cancer, Vol. 131, No. 5, 2012, pp. 769- 780. doi:10.1002/ijc.27425
- B. Grosche, “The Kinderkrebs in der Umgerbung von Kernkraftwerken Study: Results Put into Perspective,” Radiation Protection Dosimetry, Vol. 132, No. 2, 2008, pp. 198-201. doi:10.1093/rpd/ncn257
- Strahlenschutzkommission (SSK), “Assessment of the Epidemiological Study on Childhood Cancer in the Vicinity of Nuclear Power Plants (KiKK Study): Position of the Commission on Radiological Protection (SSK),” 2008.
- D. Laurier, D. Hemon and J. Clavel, “Childhood Leukemia Incidence below the Age of 5 Years near French Nuclear Power Plants,” Journal of Radiological Protection, Vol. 28, No. 3, 2008, pp. 401-403. doi:10.1088/0952-4746/28/3/N01
- J. Little, J. McLaughlin and A. Miller, “Leukaemia in Young Children Living in the Vicinity of Nuclear Power Plants,” International Journal of Cancer, Vol. 122, No. 4, 2008, pp. 10-14. doi:10.1002/ijc.23347
- J. F. Bithell, T. J. Keegan, M. E. Kroll, F. G. Murphy and T. J. Vincent, “Childhood Leukemia near British Nuclear Installations: Methodological Issues and Recent Results,” Radiation Protection Dosimetry, Vol. 132, No. 2, 2008, pp. 191-197. doi:10.1093/rpd/ncn254
- B. D. Spycher, M. Feller, M. Zwahlen, M. Röösli, N. X. von der Weid, H. Hengartner, M. Egger and C. E. Kuehni (Swiss Paediatric Oncology Group and Swiss National Cohort Study Group), “Childhood Cancer and Nuclear Power Plants in Switzerland: A Census-Based Cohort Study,” International Journal of Epidemiology, Vol. 40, No. 5, 2011, pp. 1247-1260. doi:10.1093/ije/dyr115
- S. Heinävaara, S. Toikkanen, K. Pasanen, P. K. Verkasalo, P. Kurttio and A. Auvinen, “Cancer Incidence in the Vicinity of Finnish Nuclear Power Plants: An Emphasis on Childhood Leukemia,” Cancer Causes & Control, Vol. 21, No. 4, 2010, pp. 587-595. doi:10.1007/s10552-009-9488-7
- A. S. Evrard, D. Hémon, A. Morin, D. Laurier, M. Tirmarche, J. C. Backe, M. Chartier and J. Clavel, “Childhood Leukemia Incidence around French Nuclear Installations Using Geographic Zoning Based on Gaseous Discharge Dose Estimates,” British Journal of Cancer, Vol. 94, No. 9, 2006, pp. 1342-1347. doi:10.1038/sj.bjc.6603111
- J. R. McLaughlin, E. A. Clarke, E. D. Nishri and T. W. Anderson, “Childhood Leukemia in the Vicinity of Canadian Nuclear Facilities,” Cancer Causes & Control, Vol. 4, No. 1, 1993, pp. 51-58. doi:10.1007/BF00051714
- Durham Region Health Department, “Radiation and Health in Durham Region,” Durham Region, 2007. http://www.durham.ca/departments/health/health_statistics/radiationHealthReport2007.pdf
- Durham Region Health Department, “Radiation and Health in Durham Region,” Durham Region, 1996.
- Bruce Power, “Annual Summary and Assessment of Environmental Radiological Data for 2001: B-REP-03419- 00001-R00,” 2002.
- Bruce Power, “Annual Summary and Assessment of Environmental Radiological Data for 2002: B-REP-03419- 00002-R00,” 2003. www.brucepower.com/wp-content/uploads/2011/04/Annual-Summary-and-Assessment-of-Environmental-Radiological-Data-Report-2002.pdf
- Bruce Power, “Annual Summary and Assessment of Environmental Radiological Data for 2003: B-REP-03419- 00003-R00,” 2004. www.brucepower.com/wp-content/uploads/2011/04/Annual-Summary-and-Assessment-of-Environmental-Radiological-Data-Report-2003.pdf
- Bruce Power, “Annual Summary and Assessment of Environmental Radiological Data for 2004: B-REP-03419- 00003-R00,” 2005. www.brucepower.com/wp-content/uploads/2011/04/Annual-Summary-and-Assessment-of-Environmental-Radiological-Data-Report-2004.pdf
- Bruce Power, “Annual Summary and Assessment of Environmental Radiological Data for 2005: B-REP-03419- 00005 R001,” 2006. www.brucepower.com/wp-content/uploads/2011/04/2005-Annual-Summary-and-Assessment-of-Environmental-Radiological-Data.pdf
- Bruce Power, “Annual Summary and Assessment of Environmental Radiological Data for 2006: B-REP-03419- 00007,” 2007. www.brucepower.com/wp-content/uploads/2011/04/2006-Annual-Summary-and-Assessment-of-Environmental-Radiological-Data.pdf
- Bruce Power, “Annual Summary and Assessment of Environmental Radiological Data for 2007: B-REP-03419- 00008 R000,” 2008. www.brucepower.com/wp-content/uploads/2011/04/Annual-Summary-and-Assessment-of-Environmental-Radiological-Data-for-2007.pdf
- Bruce Power, “Annual Summary and Assessment of Environmental Radiological Data for 2008: B-REP-03419- 00009 R001,” 2009. www.brucepower.com/wp-content/uploads/2011/04/B-REP-03419-00009-R12.pdf
- Ontario Power Generation, “Annual Summary and Assessment of Environmental Radiological Data for 2001: N-REP-03419-10002-R00,” 2002.
- Ontario Power Generation, “Annual Summary and Assessment of Environmental Radiological Data for 2002: N-REP-03419-10003-R00,” 2003.
- Ontario Power Generation, “Annual Summary and Assessment of Environmental Radiological Data for 2003: N-REP-03481-10002-R00,” 2004.
- Ontario Power Generation, “Annual Summary and Assessment of Environmental Radiological Data for 2004: N-REP-03481-10003-R01,” 2005.
- Ontario Power Generation, “Annual Summary and Assessment of Environmental Radiological Data for 2005: N-REP-03481-10004-R01,” 2006.
- Ontario Power Generation, “2006 Results of Radiological Environmental Monitoring Programs: N-REP-03481- 10005-R001,” 2007.
- Ontario Power Generation, “2007 Results of Radiological Environmental Monitoring Programs: N-REP-03481- 10006-R000,” 2008.
- Ontario Power Generation, “2008 Results of Radiological Environmental Monitoring Programs: N-REP-03481- 10007-R000,” 2009.
- Canadian Standards Association, “CSA Standard N288.1- M87: Guidelines for Calculating Derived Release Limits for Radioactive Materials in Airborne and Liquid Effluents for Normal Operation of Nuclear Facilities,” Canadian Standards Association, Toronto, 1987.
- Canadian Standards Association, “CSA Standard N288.1- 08: Guidelines for Calculating Derived Release Limits for Radioactive Materials in Airborne and Liquid Effluents for Normal Operation of Nuclear Facilities,” Canadian Standards Association, Mississauga, 2008.
- Canadian Standards Association, “CSA Standard N288.1- 08: Guidelines for Calculating Derived Release Limits for Radioactive Materials in Airborne and Liquid Effluents for Normal Operation of Nuclear Facilities-Update No. 1,” Canadian Standards Association, Mississauga, 2011.
- EcoMetrix, “Environmental IMPACTTM User Manual (Ver. 5.4.0): Integrated Model for the Probabilistic Assessment of Contaminant Transport,” 2009.
- Bruce Power, “Derived Release Limits and Action Levels for Bruce Nuclear Generating Station A: NK-21-REP- 03482-00002 R001,” Bruce Power, Tiverton, 2013.
- Bruce Power, “Derived Release Limits and Action Levels for Bruce Nuclear Generating Station B: NK-29-REP- 03482-00003 R001,” Bruce Power, Tiverton, 2013.
- Ontario Power Generation, “Derived Release Limits for the Darlington Nuclear Generation Station: NK38-REP- 03482-10001-R00,” 2003.
- Ontario Power Generation, “Derived Release Limits and Environmental Action Levels for Pickering Nuclear Generating Station A: NA44-REP-03482-00001-R002,” 2010.
- Ontario Power Generation, “Derived Release Limits and Environmental Action Levels for Pickering Nuclear Generating Station B: NK30-REP-03482-00001-R002,” 2010.
- Cancer Care Ontario (CCO), “Incidence and Mortality in Ontario,” 2011. www.cancercare.on.ca/ocs/csurv/stats/ontario/
- Statistics Canada, “Canadian Cancer Registry,” CCR, 2012. http://www23.statcan.gc.ca/imdb/p2SV.pl?Function=getSurvey&SDDS=3207&Item_Id=1633&lang
- United Nations Scientific Committee on the Effects of Atomic Radiation (UNSCEAR), “2006 Report to the General Assembly, with Scientific Annexes. Effects of Ionizing Radiation,” Vol. I, Scientific Annex A, Epidemiological Studies of Radiation and Cancer, United Nations, New York, 2008.
- J. D. Boice Jr., “Ionizing Radiation Cancer Epidemiology and Prevention” 3rd Edition, Oxford University Press, New York, 2006.
- National Research Council (NRC), “Health Risks from Exposure to Low Levels of Ionizing Radiation: BEIR VII Phase 2,” The National Academies Press, Washington DC, 2006.
- WHO (World Health Organization), “International Classification of Diseases for Oncology, 3rd Edition (ICDO-3),” 2000. www.who.int/classifications/icd/adaptations/oncology/en/index.html
- Statistics Canada, “Overview of the Census,” 2011. http://www12.statcan.gc.ca/census-recensement/2011/ref/overview-apercu/index-eng.cfm
- E. J. Holowaty, V. Moravan, G. Lee, N. Chong and D. Dale, “A Reabstraction Study to Estimate the Completeness and Accuracy of Data Elements in the Ontario Cancer Registry,” Cancer Bureau, Health Canada, Final Report Contract H4078-3-C098, Ottawa, 1996.
- K. H. Rothman, S. Greenland and T. L. Lash, “Modern Epidemiology” 3rd Edition, Lippincott Williams & Wikins, Philadelphia, 2008.
- N. E. Breslow and N. E. Day, “Statistical Methods in Cancer Research Vol II The Design and Analysis of Cohort Studies,” International Agency for Research on Cancer, 1987. www.iarc.fr/en/publications/pdfs-online/stat/sp82/SP82.pdf
- P. D. Ellis, “The Essential Guide to Effect Sizes: An Introduction to Statistical Power, Meta-Analysis and the Interpretation of Research Results,” Cambridge University Press, Cambridge, 2010. doi:10.1017/CBO9780511761676
- Canadian Cancer Society, “Canadian Cancer Statistics 2013,” Toronto, ON, Canadian Cancer Society’s Steering Committee on Cancer Statistics, 2013.
- J. S. Mausner and A. K. Bahn, “Epidemiology—An Introductory Text,” 2nd Edition, WB Saunders Company, Philadelphia, 1985.
- Durham Region, “Durham Region Nuclear Emergency Evacuation Information: Annex B—Durham Region Nuclear Emergency Response Plan,” Durham Region, 2008.
- Durham Region, “Durham Region Nuclear Emergency Response Plan (DRNERP): Part II—Durham Region Emergency Master Plan,” Durham Region, 2011. http://www.durham.ca/departments/demo/DRNERPApr2011.pdf
- D. Laurier, S. Jacob, M. O. Bernier, K. Leuraud, C. Metz, E. Samson and P. Laloi, “Epidemiological Studies of Leukemia in Children and Young Adults around Nuclear Facilities: A Critical Review,” Radiation Protection Dosimetry, Vol. 132, No. 2, 2008, pp. 182-190. doi:10.1093/rpd/ncn262
- [61] D. Laurier and D. Bard, “Epidemiologic Studies of Leukemia among Persons under 25 Years of Age Living near Nuclear Sites,” Epidemiologic Reviews, Vol. 21, No. 2, 1999, pp. 188-206. doi:10.1093/oxfordjournals.epirev.a017996
- [62] D. Laurier, B. Grosche and P. Hall, “Risk of Childhood Leukemia in the Vicinity of Nuclear Installations—Findings and Recent Controversies,” Acta Oncologica, Vol. 41, No. 1, 2002, pp. 14-24. doi:10.1080/028418602317314019
- [63] A. Koushik, W. D. King and J. R. McLaughlin, “An Ecologic Study of Childhood Leukemia and Population Mixing in Ontario, Canada,” Cancer Causes & Control, Vol. 12, No. 6, 2001, 483-490. doi:10.1023/A:1011266413087
- [64] L. Kinlen, “Evidence for an Infectious Cause of Childhood Leukemia: Comparison of a Scottish New Town with Nuclear Reprocessing Sites in Britain,” The Lancet, Vol. 332, No. 8624, 1988, pp. 1323-1327. doi:10.1016/S0140-6736(88)90867-7
- [65] R. Doll and A. B. Hill, “The Mortality of Doctors in Relation to Their Smoking Habits: A Preliminary Report. 1954,” British Medical Journal, Vol. 328, No. 7455, 2004, pp. 1529-1533. doi:10.1136/bmj.328.7455.1529
- [66] United States Department of Health and Human Services, “The Health Consequences of Smoking: A Report of the Surgeon General,” 2004.
- [67] International Agency for Research on Cancer (IARC), “IARC Monographs on the Evaluation of Carcinogenic Risks to Humans: Tobacco Smoke and Involuntary Smoking,” 2004.
- [68] S. D. Walter, S. E. Birnie, L. D. Marrett, S. M. Taylor, D. Reynolds, J. Davies, J. J. Drake and M. Hayes, “The Geographic Variation of Cancer Incidence in Ontario,” American Journal of Public Health, Vol. 84, No. 3, 1994, pp. 367-376. doi:10.2105/AJPH.84.3.367
- [69] Public Health Agency of Canada, 2012. http://www.phac-aspc.gc.ca
- [70] National Cancer Institute at the National Institutes of Health, “What You Need To Know About TM Cancer Index,” 2012. http://www.cancer.gov/cancertopics/wyntk/
- [71] K. Furukawa, D. Preston, S. Funamoto, S. Yonehara, M. Ito, S. Tokuoka, H. Sugiyama, M. Soda, K. Ozasa and K. Mabuchi, “Long-Term Trend of Thyroid Cancer Risk among Japanese Atomic-Bomb Survivors: 60 Years after Exposure,” International Journal of Cancer, Vol. 132, No. 5, 2013, pp. 1222-1226. doi:10.1002/ijc.27749
- [72] P. W. Dickman, L. E. Holm, G. Lundell, J. D. Boice Jr. and P. Hall. “Thyroid Cancer Risk after Thyroid Examination with 131I: A Population-Based Cohort Study in Sweden,” International Journal of Cancer, Vol. 106, No. 4, 2003, pp. 580-587. doi:10.1002/ijc.11258
- [73] United Nations Scientific Committee on the Effects of Atomic Radiation (UNSCEAR), “2008 Report to the General Assembly, with Scientific Annexes, Vol. II, Scientific Annex D, Health Effects Due to Radiation from the Chernobyl Accident,” United Nations, New York, 2011.
- [74] A. J. Alberg and J. Nonemaker, “Who Is at High Risk for Lung Cancer? Population-Level and Individual-Level Perspectives,” Seminars in Respiratory and Critical Care Medicine, Vol. 29, No. 3, 2008, pp. 223-232. doi:10.1055/s-2008-1076742
- [75] A. Jemal, S. Devesa, M. Kulldorff, R. Hayes and J. Fraumeni, “Geographic Variation in Prostate Cancer Mortality Rates among White Males in the United States,” Annals of Epidemiology, Vol. 10, No. 7, 2000, p. 470. doi:10.1016/S1047-2797(00)00094-6
- [76] S. S. Devesa, D. J. Grauman, W. J. Blot and J. F. Fraumeni Jr., “Cancer Surveillance Series: Changing Geographic Patterns of Lung Cancer Mortality in the United States, 1950 through 1994,” Journal of the National Cancer Institute, Vol. 91, No. 12, 1999, pp. 1040-1050. doi:10.1093/jnci/91.12.1040
- [77] W. J. Blot, “Esophageal Cancer Trends and Risk Factors,” Seminars in Oncology, Vol. 21, No. 4, 1994, pp. 403-410.
- [78] S. D. Walter, L. D. Marrett, S. M. Taylor and D. King, “An Analysis of the Geographic Variation in Cancer Incidence and Its Determinants in Ontario,” Canadian Journal of Public Health, Vol. 90, No. 2, 1999, pp. 104-108.
- [79] C. A. Altmayer, B. G. Hutchison, V. L. Torrance-Rynard, J. Hurley, S. Birch and J. D. Eyles, “Geographic Disparity in Premature Mortality in Ontario, 1992-1996,” International Journal of Health Geographics, Vol. 2, No. 1, 2003, p. 7. doi:10.1186/1476-072X-2-7
NOTES
*Corresponding author.