Journal of Environmental Protection
Vol.4 No.5A(2013), Article ID:31895,10 pages DOI:10.4236/jep.2013.45A003
Assessment of Pollutants in Wet and Dry Depositions in a Suburban Area around a Waste-to-Energy Plant (WEP) in Northern Italy
![]()
Department of Agricultural Science, Alma Mater Studiorum-University of Bologna, Bologna, Italy.
Email: livia.vittori@unibo.it
Copyright © 2013 Livia Vittori Antisari et al. This is an open access article distributed under the Creative Commons Attribution License, which permits unrestricted use, distribution, and reproduction in any medium, provided the original work is properly cited.
Received March 14th, 2013; revised May 16th, 2013; accepted May 13th, 2013
Keywords: Waste-to-Energy-Plant; Atmospheric Deposition; Heavy Metals; Pollutants; Rain Water
ABSTRACT
Atmospheric concentrations of many trace elements are significantly affected by human activities, and their quantification in atmospheric deposition can be useful to ascribe to different sources of pollution. An important source of pollution, which creates concern in the inhabitants of neighboring areas, are waste-to-energy-plants, that nonetheless are necessary in the actual management of municipal solid waste. For this reason the waste-to-energy (WEP) plant of Bologna (Italy) was monitored from 2006 to 2008, collecting rainfall water in 6 sites around it. Moreover, dry deposition of pollutants was determined after leaching from leaves, with four samples collected during 2007. Trace elements were analyzed using spectrometry, deposition and fluxes were calculated. Results show that there is a large variability of concentrations of trace elements both in time and space. Moreover, the pollution in the area is quite diffused, with no clear determination of the role of the WEP. As a general remark, elements and trace elements found both in rainfall water and in leaching water from leaves showed a diffused pollution in all the monitored sites, probably due to the WEP but also to industrial/commercial area, large constructions and high traffic roads. In any case the values found in the area are comparable to values detected in similar area all over the world.
1. Introduction
Atmospheric concentrations of many trace elements are significantly affected by human activities. The quantifycation of trace elements in atmospheric deposition and their attribution to different sources of pollution is an important step to determine whether heavy metals can be considered as tracers of different types of pollution [1-3].
The pollutant concentrations in rainwater define their soluble component and can help to understand the relative contribution of different sources of emission into the atmosphere [4]. In fact, the pattern of pollutant concentration in rainwater describes the solubilization and transport phenomena, and the environmental quality control can be performed at macroand micro-scale.
The main sources of air pollution are associated with high-temperature combustion (e.g. burning of oil and gas, mineral smelting, waste incineration and cement production) and residence times and concentrations in air are related to atmospheric deposition, both wet and dry [5]. An incineration process still represents a necessary step in the field of municipal solid waste integrated management, in view of an energetic valorisation of materials and a reduction of hazardousness, mass and volume, before final disposal. However, because of the potential adverse effects of toxic emissions, waste incinerators are still an important cause of concern for the public. A general evaluation of the environmental impacts that derive from the processes of incineration is therefore necessary, both in qualitative and quantitative terms, while looking at the advantages and the negative aspects at the same time. Concentration limits of pollutants in gaseous emissions from incineration plants have recently been revised by Italian law [6], in order to better protect the natural environment. But the mere law observance is not sufficient to predict the extent of a contamination source environmental impact [7,8].
Aim of this work was to assess the pollutants load during three years around the waste-to-energy (WEP) plant of Bologna (Italy). The same plant was monitored for heavy metals [7,9], finding that their concentration trends in soil and vegetation reflected the behaviour of their fluxes from incinerator stack, during the examined years (from 1997 to 1999). The incinerator was modernized and technologically upgraded starting from 2001, and began working in the new form in 2006. For this reason a new monitoring period was decided, from 2006 to 2008. Two small industrial areas and a heavy traffic road (103 - 104 vehicle per day, [10]) may add pollutants to the atmosphere around the WEP, contributing to the deterioration of the environmental quality. For this reason, rain water samples were collected in different stations identified in the commercial, industrial and agricultural area suburbs of Bologna and around the incinerator plant. Moreover, dry deposition of pollutants are intercepted by tree leaves, then the determinations of trace elements concentrations in leaching tests on leaves were compared with those found in rain water. The distribution in space of metals determined in both kind of samples is useful to highlight the pollutants sources.
2. Material and Methods
2.1. Study Area
The study area is located in the suburbs of Bologna (Northern Italy) within a radius of three kilometres from the Municipal waste-to-energy plant “Frullo” (FEA Administrator, Bologna, Italy) as reported in Figure 1. The pluviometers used to collect precipitation samples were placed in the Agricultural Faculty of the University of Bologna (from now referred as site A) and in five different sites located around the Frullo waste-to-energy plant. Details on the sites are in Figure 1, sites were selected according to or perpendicular to the predominant winds direction. The climate of the area is continental, with mean annual temperature of 13.6˚C and an elevate daily temperature range. The mean annual rainfall amount is 740 mm with mostly events in spring and autumn (all climatological information in [11]). Wind data from two stations in the area (Bologna Borgo Panigale, lat. 44.53; long. 11.30; 36 m a.s.l., and San Pietro Capofiume, lat. 44.65; long. 11.62; 11 m a.s.l.) were used to assess prevailing wind direction. The area is in the Padana Plain, so it is a flatland and no orography contribute to change the wind direction between the considered sites. The wind dataset were available from ARPA-Simc Emilia Romagna, and both are 15 years long (1991-2005).
2.2. Sampling and Laboratory Analysis
The Precipitation water was sampled every two weeks or more, depending on rain events, from 03/13/2006 to 7/23/2008. The amount of rain water was measured and collected from pluviometers placed in the six different sites. The year 2007 was used, as the only complete year, for the calculation of fluxes and other yearly data elaboration. On the whole, 302 samples of rain water were collected, filtered, acidified with HNO3 suprapure (Merck, Germany) and then frozen.
Leaf washing water was obtained sampling leaves of hardwood and small branches of conifers, four times during the study period (January, May, July, September 2007) according to Vittori Antisari et al. [12]. In particular, 50 g of tree leaves, sampled, put in polyethylene bags and stored at 4˚C, were washed with 500 mL of acidulated water (pH ~ 5.5 with HCl diluted), shaking for few minutes. The water was reduced in volume to 100 mL, filtered and then acidified with HNO3 suprapur (Merck, Germany). The major and trace elements in rain and washing leaf water samples were determined by Spectros (Circular Optical System CIR.O.S.CCD) Inductive Coupled Plasma Optical Emission Spectrometry (ICP-OES). The ICP-OES setting followed multi-standard solutions (CPIInternational-Amsterdam) that reproduce the matrix effect present in samples and allow the lowering of detection limits (DL).
Instrument response was assessed by measuring a standard sample (CRM 609- Community Bureau of Reference—BCR). The analytical method was validated by repeating the measures of concentrations present in the different standards used for ICP-OES setting. In this work Al, Ba, Cd, Cu, Fe, Mn, Ni, Pb and Zn are discussed. Some values in rain water of Cd, Ni and Pb was less than instrumental detection limit (BDL). Therefore, in this paper we considered only the values exceeding the DL.
2.3. Data Elaboration
Pollutants concentration in rainfall was transformed first in total deposition per sample, using the total amount of the corresponding rainfall, per event and per site, then in total flux. This was calculated using concentration, rainfall quantity and number of days deployed, obtaining a value in kg·km–2·year–1 [13].
The deposition rate on leaves was calculated from the average amount of soluble trace elements in leaching test and the average leaf area (5.3 m2·kg–1 fresh weight) as approximated by the investigations of [14].
In order to understand the origin of the found elements, and discriminate a geogenic or man-made origin, the enrichment factor (EF) was calculated. The crustal enrichment factor is often used to compare the composition of rain water and atmospheric particles with the composition
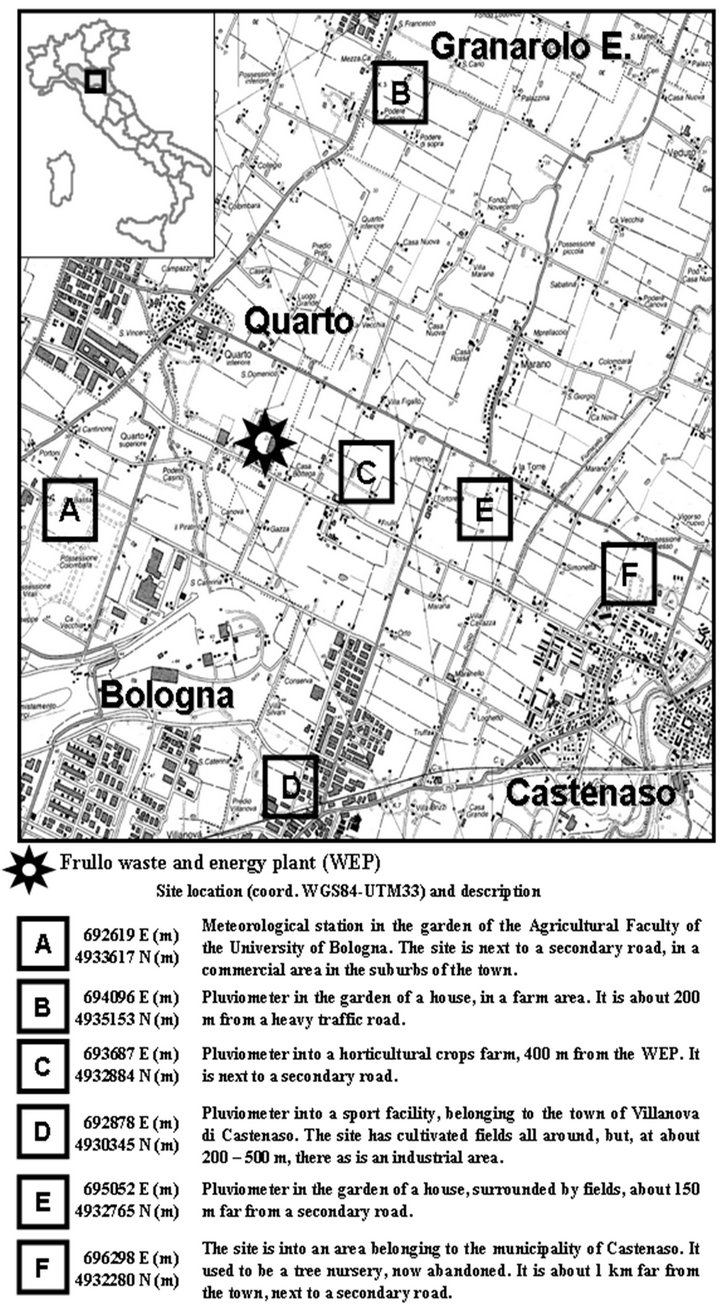
Figure 1. Six sampling sites, located within three kilometres of radius from Frullo Waste and Energy Plant (star). A, C, E and F are according to the predominant winds direction (E-W), B and D are perpendicular to it. A is into the University of Bologna agronomical garden.
of the continental crust and may be a first approximation of a possible origin (geogenic or anthropogenic). However, it should be remembered the uncertainty of these calculations, that is due to reactions and chemical transformations that can occur during transport in the atmosphere, to the choice of the reference element or to analytical error [1,15]. Aluminium is normally used as an indicator of crustal origin, as other metals such as Fe and Mn may have important anthropogenic contributions. In this work, instead of using the general value of crustal abundance of literature [16] it was decided to use the soil enrichment referred to the area of investigation, in accordance with the following Equation (1):
EF= ([X]/[Al])rainfall/([X]/[Al])soil
where [X] and [Al] are the concentrations of the metal (X) and the indicator (Al) in rain and average land area of investigation. The metals with EF < 10 are considered as crustal, 10 < EF < 100 indicate moderate anthropogenic enrichment, while a contribution highly anthropogenic for rainwater has EF > 500 [3,17,18]. Poissant et al. [19] define rather a moderate enrichment up to a value of EF = 500, highly enriched with EF > 500.
3. Results and Discussion
3.1. Meteorological Data
The precipitation quantities gathered in the six sampling sites were quite similar in all cases, as shown in Figure 2. The total amount in the study period was 1256 mm as an average of the sites, with a coefficient of variation equal to 0.03 among the stations.
Prevailing winds from the two dataset analyzed showed the same results, with a East-West preferential direction.
For this reason sampling sites were chosen as in Figure 1, with sites A, C, E and F downwind, and sites B and D perpendicular to the wind preferential direction. This should ensure that there is a low influence of WEP in the findings of these two stations.
3.2. Analytical Data
Table 1 shows a descriptive statistical summary of the concentrations of the trace elements in rainwater, collected at sites located around the WEP. The range of standard deviation of the measured values shows that the concentration of metals is extremely variable. Some of them, namely Al, Ba and Fe, have maximum values 600 times higher than the minimum. This type of variability is frequently observed and often is attributed to the origin (geogenic or anthropogenic) of atmospheric trace elements [20,21].
The average values found in the outskirts of Bologna are lower for the concentrations of the natural elements, Al and Fe, and higher for the contaminants, such as Ni, Cu, Pb, Cd and Zn, than those found by other authors (for example on the Greek Islands [22].
The Bologna values are higher by a factor of 10 when compared to those measured in Nam Co, 4700 m a.s.l. in Tibet [23], while the averages are of the same magnitude of those measured in urban areas around the world, such as Mexico City [24], Singapore [25] Mesin in Turkey [26], and of some rural areas in Jordan [3].
Figure 3 shows the total contribution, expressed as the
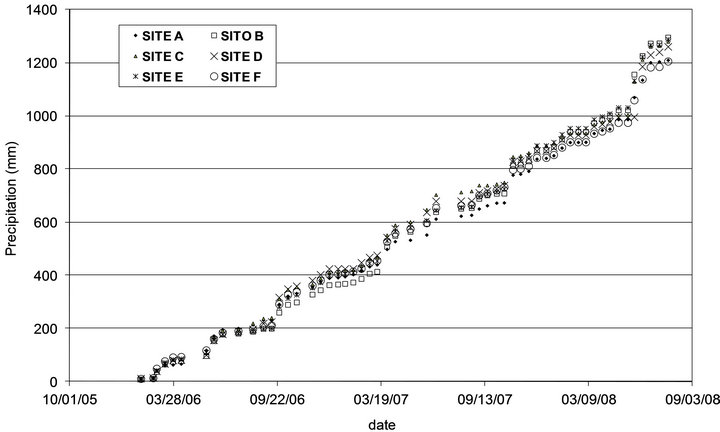
Figure 2. Cumulate amount of precipitation during the study period in the six sampling sites.
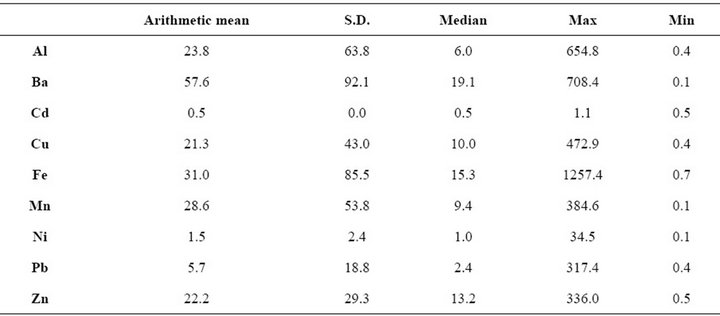
Table 1. Descriptive statistics of concentrations of pollutants in rainwater samples collected from 2006 to 2008 (302 samples) around an incinerator plant (expressed as µg·L–1). The minimum values of Ni, Cd and Pb were calculated on higher below detection limit (BDL), in particular the BDL of these elements were 0.01, 0.07 and 0.1 µg·L–1, respectively.

Figure 3. Sum of pollutants in rain water in the six sites studied.
sum of the concentration of the pollutants considered, as a function of the sites.
In particular, the higher total concentration is at the site of the Faculty of Agriculture (A), primarily due to Al and Ba. The second site in order of magnitudes of pollutants is F, the former trees nursery, where higher values are due to Cu. The third site is C, that shows high values of Mn and Ni. All these sites are downwind WEP, but the data do not indicate a clear relationship between the concentration of pollutants and the emission sources. The lower data were found in site B and D, that are perpendicular to prevailing wind (Figure 1). Regarding site A, as a partial explanation, during the period of monitoring, excavations for building a new shopping district occurred near the Department of Agricultural Science of Bologna University, and this may explain the results.
The climate of the Po Valley is characterized by spring and fall as rainy seasons, compared to drier summer and winter. The distribution of the rainfall measured in the six sites shows this trend, as in Figure 4. The average contribution of trace elements to the monthly rainfall doesn’t follow the typical dilution effect since the highest concentrations are found in January, April, July and August, showing no relation with the amount of rainfall. Precipitation washed the atmosphere, more after long periods of drought, resulting in having in solution many metals present in atmospheric dust. Moreover, the local high concentrations of dissolved metals may be attributed to the distribution of fog and winds typical of the Po Valley [27]. The variation of the concentrations of these metals in rainwater samples can be related to different sources of the emission of pollutants [28]. For example, Ni is used as an indicator of emissions from combustion of fuel and therefore is related to vehicular traffic.
The major source of Cu in rainfall comes from burning fossil fuels, metallurgical industrial processes and incin-
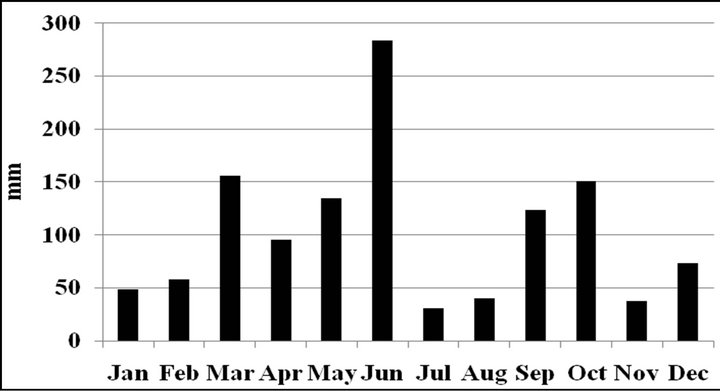
Figure 4. The monthly rainfall in the study area during the period (2006-2008).
eration of solid waste. Zn can be derived from the same sources or from traffic [29]. Pb can be due to emission from metallurgical industries or to the presence of contaminated soil particles suspended in the air [26,30].
Table 2 shows the correlation coefficients between trace elements dissolved in the rain and the amount of precipitation. Cadmium is the only element significantly correlated with the amount of rain, as values above the detection limit are related to the type of event and to the dry spell length. All elements are related to each other except Ba, which is correlated only with Al, Pb and Cu. In particular, a strong relationship between Ba and Pb was also detected in other monitoring matrix (e.g. soil, plants and mosses) and Ba is to be ascribed to vehicular traffic [31].
The pollutants concentration in rain water depends on many factors (such as proximity of sources pollutants, precipitation amount and direction of air masses) and therefore it is subject to a spatial and temporal variability [1,32].
To better understand these correlations, the enrichment factor (EF) was calculated, normalizing at Al concentrations. The reference value of soil used is the average concentration of each trace element in the topsoil of the area. Figure 5 shows the average EF found in the survey for trace elements.
EF values in the range 1 to 10 indicate soil dust as the dominant source, while enrichment factors in the range of 10 - 100 are related to different pollution sources [23]. In this study EF of Fe in rainwater is geogenic (EF < 10) the values of EF for Mn and Ni are well below 100, all the others are in the range between 200 and 700, with Cadmium with a value greater than 4000, indicating a large presence of this element in the environment. In the case of our study, Mn and Ni are mainly of crustal origin.
This finding implies a severe contamination of the area investigated by Cd, caused by human activities. The enrichment factor value for Cd ranges between 1236 and 14,235, as shown in Table 3. It is easy to see that the highest values of Cd are in the site exposed to road traffic
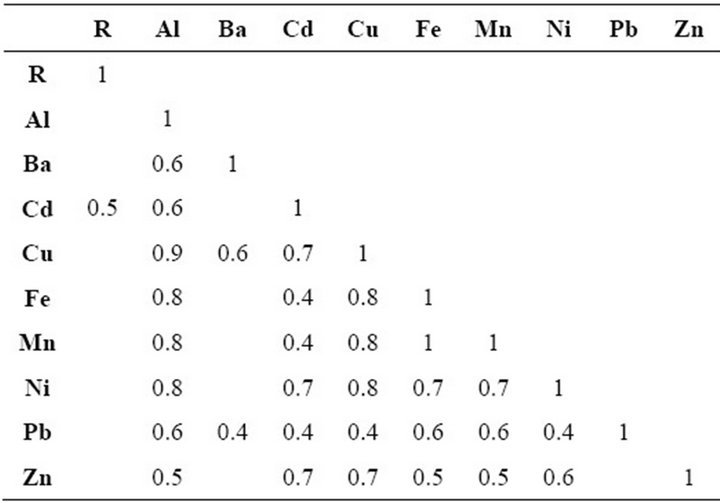
Table 2. Correlation matrix of dissolved trace elements (µg·L–1) and precipitation amount of (R) rainfall (mm).
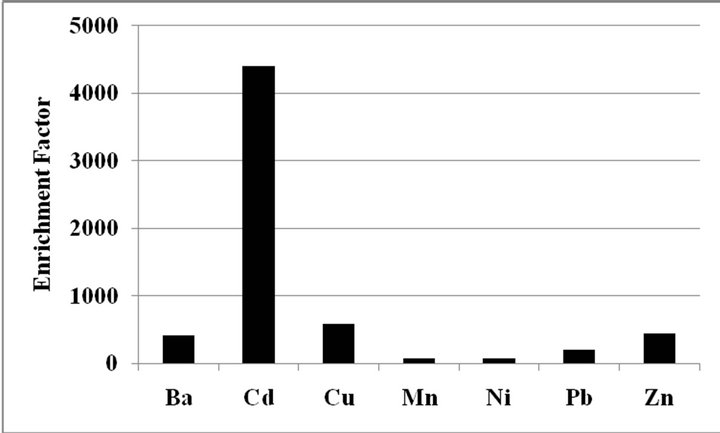
Figure 5. The average enrichment factors (EF) calculated according to Cong et al. [23] for dissolved trace elements. The element concentration s normalized to Al concentration in rainwater and at denominator the element concentration, normalized to Al concentration referred to mean amount of topsoil of study area.
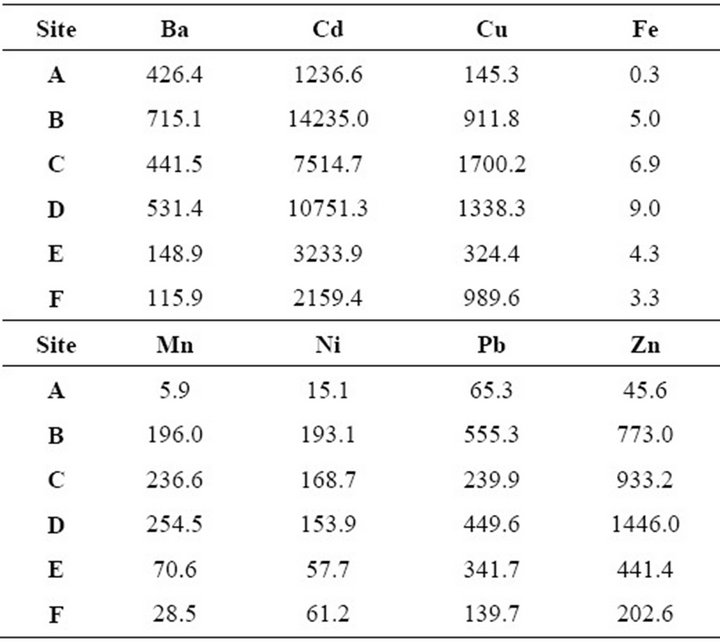
Table 3. Enrichment factors calculated in rain water, according to Cong et al. [23] in different sites.
(about 103 - 104 vehicle per day) and in the site next to the industrial area, perpendicular to the preferential wind direction from the incinerator. The sites downwind to the WEP show lower values of EF for Cd. Regarding to other elements, Ba, Cu, Fe, Mn, Ni, Pb and Zn, the sites C, D and E have EF higher than the other sites. The sites exposed to secondary roads show values 5 to 10 times lower.
The concentration values found in rainfall for the year 2007 were converted into flux of elements dissolved in rain water (kg·km–2·year–1), Table 4 shows the average values of pollutants concentrations. The wet deposition flux of each element was calculated on the basis of the sum of the loads (element concentration multiplied by each precipitation volume) in the precipitation collected for the whole year (2007). Note the different fluxes in different sites: in particular, sites D and F have a deposition of elements higher than the other sites. Regarding trace elements, site A has high levels of Al and Ba (13.5 and 45.3 kg·km–2·year–1, respectively), site C of Mn and Zn (21.0 and 26.2 kg·km–2·year–1, respectively), while D and F have values of the same magnitude for all the elements.
The local data collected during 2007 show that there is a quite large spatial variability and flows are affected by emission sources. The flows on the Mediterranean area of Pb and Zn are calculated as 1.46 and 12.1 kg·km–2·year–1, respectively [33], and they are very close to the average found in our survey area (1.5 and 14.0 kg·km–2·year–1, respectively for Pb and Zn).
The maximum flow of these elements is found in sites D, E and F (0.3, 2.3 and 26.2 kg·km–2·year–1, respectively for Cd, Pb and Zn,) but they are lower than the one

Table 4. Average flux of trace elements expressed as kg·km–2·year–1 for the year 2007 determined in rain water, and their distribution in different sites.
estimated close to a foundry plant [34], and 10 km from the plant itself (4.8, 35, 2000 kg·km–2·year–1, respectively for Cd, Pb and Zn). In the same sites, together with rain water quality, particles deposited on the leaves were analyzed, after washing the vegetation with acidulated water.
Table 5 shows the summary of the statistics data of the amount of soluble pollutants fractions in deposition on the leaves. These values are higher than those found in rain waters. The concentrations of Al, Fe, Mn and Zn, expressed in mg·L–1, emphasizing that the deposits on the leaves are mainly formed by these elements. The average content of other elements decreases as follows: Cu > Ba > Pb > Ni and Cd. As seen for the rainwater, variability of trace elements concentrations found in the leaching test waters is very high, indicating a different deposition, function of sites and exposure.
Figure 5 highlights how the concentration of the soluble fraction of metals in the deposition on the leaves is higher than that in rainwater. The different order of magnitude of pollutants concentrations in rainwater and in airborne deposition on leaves is probably due to different atmospheric processes.
Furthermore, Figure 6 shows the different distribution of both quantitative and qualitative factors in the deposition on leaves as a function of the exposure sites and the amount of trace elements in the depositions is within a range of 8 and 35 mg·L–1.
Site D is the site that has the higher concentration (35 mg·L–1) of elements in the foliar leaching waters, followed by site A and F (12 mg·L–1), B (11 mg·L–1), C (10 mg·L–1) and E (8 mg·L–1).
As in the rainfall case, the enrichment factor (EF) was calculated normalizing to the Al concentration and to the
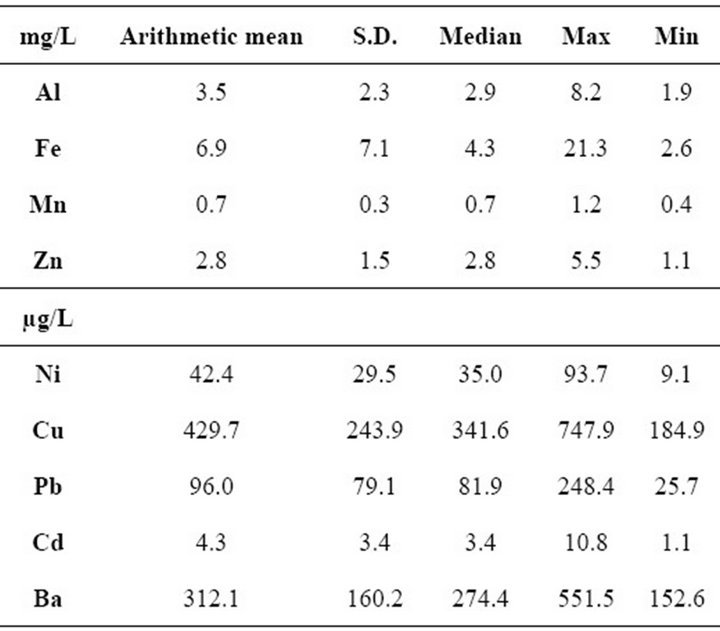
Table 5. Descriptive statistics of amount of main pollutants in soluble pool of atmospheric deposition on tree leaves.
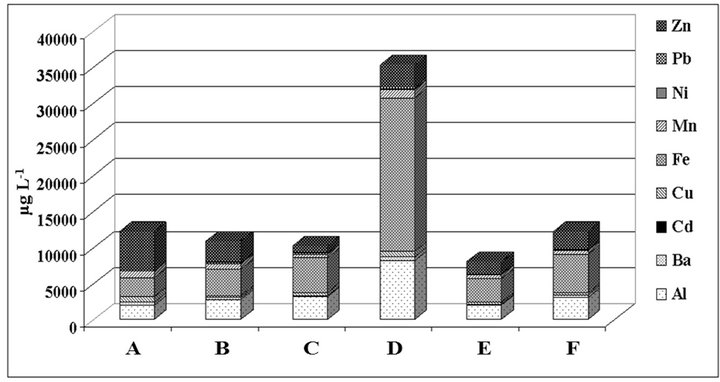
Figure 6. Sum of pollutants concentrations to different exposition of sites in water after leaching test on leaves.
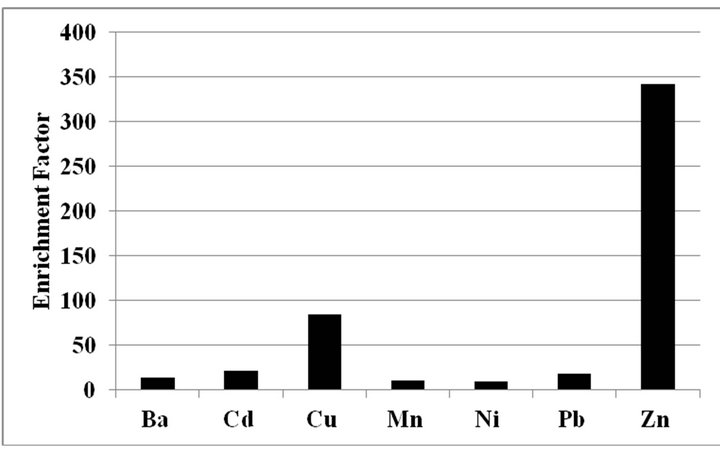
Figure 7. Average enrichment factors for trace elements dissolved by leaching leaves samples. The element concentration is normalized to Al concentration in rainwater, at denominator the element concentration, normalized to Al concentration referred to mean amount of topsoil in the study area.
soil of the area (Figure 7). The average EF is quite different from that of rainfall, with the highest value for Zn (EF = 342) followed by Cu, Cd and Pb (EF = 85, 21 and 18, respectively).
The airborne determined by the leaching test is less enriched when compared to rainfalls, referring both the values to the average composition of the soil. This phenomenon could be attributed to the higher amount of soil particles. The concentration of pollutants in rainwater depends on phenomena of flow and washout of atmosphere. The site that has the higher EF in foliar deposits is the Faculty of Agriculture (Table 6), followed by sites B, E, F and then D and C.
The load flow (kg·km–2) deposited on the canopy for trace elements in presented in Table 7.
The average flow of elements as a function of leaf area shows that the deposition on leaves is characterized mainly by Al, Fe and Zn. The flow of Al and Fe found on the leaves is greater than that in water. This may be attributed to the solubility of these elements in water and

Table 6. Enrichment factors calculated on soluble pool of atmospheric deposition on leaves in different sites.
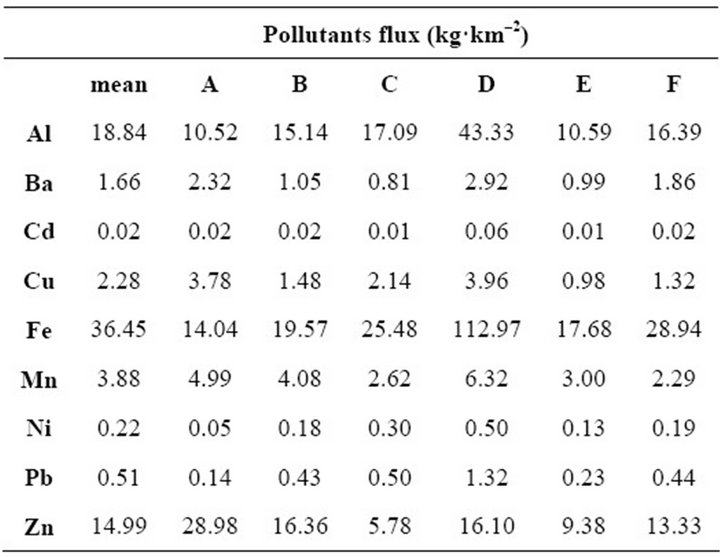
Table 7. Average flux of trace elements expressed as kg·km–2 for the year 2007, determined on leaching water of leaves, and their distribution in different sites.
their readiness to form stable compounds.
The pollutant fluxes calculated for precipitation are higher than those determined with the estimate of the depositions on leaves. Figure 8 shows the linear correlation (R2 = 0.84, p < 0.001) between flux of trace elements in
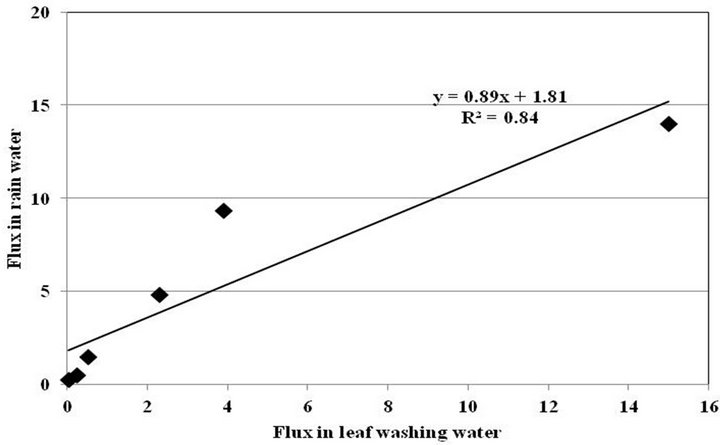
Figure 8. Linear correlation between flux of trace elements (Cd, Cu, Ni, Pb, Mn, Zn) determined in rain water and leaf washing water.
rainfall and on leaves.
This relationship is found for all elements except Al, Fe, Zn and Ba. The flux of Ba calculated for rainwater concentration is greater than one for deposition on the leaves.
Ba is abundant in the earth’s crust but the human activities contribute significantly to the enrichment of atmosphere [31] and many of the compounds released during the industrial process are readily soluble in water. On the other hand, the high concentration of Al and Fe and Zn in airborne deposition is due to soil dust. Consequently, only the concentration of pollutants in trace shows a relationship between both fluxes.
4. Acknowledgements
This work was realized with the financial support of the Provincia di Bologna.
REFERENCES
- T. Berg, O. Røyset and E. Steinnes, “Trace Elements in Atmospheric Precipitation at Norweigan Background Stations (1989-1990) Measured by ICP-MS,” Atmospheric Environment, Vol. 28, No. 21, 1994, pp. 3519-3536. doi:10.1016/1352-2310(94)90009-4
- O. Atteia, “Major and Trace Elements in Precipitation on Western Switzerland,” Atmospheric Environment, Vol. 28, No. 22, 1994, pp. 3617-3624.
- I. F. Al-Momani, “Trace Elements in Atmospheric Precipitation at Northern Jordan Measured by ICP-MS: Acidity and Possible Sources,” Atmospheric Environment, Vol. 37, No. 32, 2003, pp. 4507-4515. doi:10.1016/S1352-2310(03)00562-4
- U. C. Kulshrestha, M. J. Kulshrestha, R. Sekar, G. S. R. Sastry and M.Vairamani, “Chemical Characteristics of Rainwater at an Urban Site of South-Central India,” Atmospheric Environment, Vol. 37, No. 32, 2003, pp. 3019- 3026.
- I. F. Al-Momani, A.-R. A. Ya’quob and B. M. Al-Bataineh, “Atmospheric Deposition of Major Ions and Trace Metals near an Industrial Area, Jordan,” Journal of. Environment Monitoring, Vol. 4, No. 6, 2002, pp. 985-989. doi:10.1039/b208697b
- Legislative Decree Number 152 of the 3rd of March, 2006.
- L. Morselli, F. Passarini and M. Bartoli, “The Environmental Fate of Heavy Metals Arising from a MSW Incineration Plant,” Waste Management, Vol. 22, No. 8, 2002, pp. 875-881. doi:10.1016/S0956-053X(02)00073-9
- P. A. Valberg, P. J. Drivas, S. McCarthy and A. Y. Watson, “Evaluating the Health Impacts of Incinerator Emissions,” Journal of Hazard Material, Vol. 47, No. 1-3, 1996, pp. 205-227. doi:10.1016/0304-3894(96)82225-4
- L. Morselli, P. Olivieri, B. Brusori and F. Passarini, “Soluble and Insoluble Fractions of Heavy Metals in Wet and Dry Atmospheric Depositions in Bologna, Italy,” Environmental Pollution, Vol. 124, No. 3, 2003, pp. 457- 469. doi:10.1016/S0269-7491(03)00013-7
- L. Pieri, P. Martzeneller, N. Gaspari, I. Marotti, G. Dinelli and P. Rossi, “Bulk Atmospheric Deposition in the Southern Po Valley (Northern Italy),” Water, Air, and Soil Pollution, Vol. 210, No. 1-4, 2010, pp. 155-169. doi:10.1007/s11270-009-0238-y
- P. Matzneller, F. Ventura, N. Gaspari and P. R. Pisa, “Analysis of Trends in a Long Term Agrometeorological Data Set in Bologna (Italy),” Climatic Change, Vol. 100, No. 3-4, 2010, pp. 717-731. doi:10.1007/s10584-009-9686-z
- L. V. Antisari, S. Carbone, C. Ferronato, A. Simoni and G. Vianello, “Leaf Washing as an Assessment Tool to Characterize dry Atmospheric Deposition,” European Quilt Association, Vol. 9, 2012, pp. 37-50.
- R. Huston, Y. C. T. Chana Gardner, G. Shaw and H. Chapman, “Characterization of Atmospheric Deposition as a Source of Contaminants in Urban Rainwater Tanks,” Water Research, Vol. 43, No. 6, 2009, pp. 1630-1640. doi:10.1016/j.watres.2008.12.045
- A. P. Rutter, J. J. Schauer, M. M. Shafer, J. E. Creswell, M. R. Olson, M. Robinson, R. M. Collins, A. M. Parman, T. L. Katzman and J. L. Mallek, “ Dry Deposition of Gaseous Elemental Mercury to Plants and Soils Using Mercury Stable Isotopes in a Controlled Environment,” Atmospheric Environment, Vol. 45, No. 4, 2011, pp. 848- 855. doi:10.1016/j.atmosenv.2010.11.025
- B. Lim and T. D. Jickells, “Dissolved, Particulate and Acid-Leachable Trace Metal Concentrations in North Atlantic Precipitation Collected on the Global Change Expedition,” Global Biogeochemical Cycles, Vol. 4, No. 4, 1990, pp. 445-458. doi:10.1029/GB004i004p00445
- M.-C. Cheng, C.-F. You, F.-J. Lin, K.-F. Huang and C.-H. Chung, “Sources of Cu, Zn, Cd and Pb in Rainwater at a Subtropical Islet Offshore Northern Taiwan” Atmospheric Environment, Vol. 45, No. 11, 2011, pp. 1919-1928. doi:10.1016/j.atmosenv.2011.01.034
- S. Guerzoni, E. Molinaroli and R. Chester, “Saharan Dust Inputs to the Western Mediterranean Sea: Depositional Patterns, Geochemistry and Sedimentological Implications,” Deep-Sea Research. Part II, Topical Studies in Oceanography, Vol. 44, No. 3-4, 1997, pp. 631-654. doi:10.1016/S0967-0645(96)00096-3
- G. Kim and T. M. Church, “Wet Deposition of Trace Elements and Radon Daughter Systematic in the South and Equatorial Atlantic Atmosphere,” Global Biogeochemical Cycles, Vol. 16, 2002, pp. 19.1-19.8.
- L. Poissant, J. P. Schmit and P. Béron, “Trace Inorganic Elements in Rainfall in the Montreal Island,” Atmospheric Environment, Vol. 28, No. 2, 1994, pp. 339-346. doi:10.1016/1352-2310(94)90109-0
- C. Guieu, R. Chester, M. Nimmo, J. M. Martin, S. Guerzoni and E. Nicolas, “Atmospheric Input of Dissolved and Particulate Metals to the Northwestern Mediterranean,” Deep-Sea Research. Part II, Topical Studies in Oceanography, Vol. 44, No. 3-4, 1997, pp. 655-674. doi:10.1016/S0967-0645(97)88508-6
- S. Guerzoni, E. Molinaroli, P. Rossini, G. Rampazzo, G. Quarantotto and G. De Falco, “Role of Desert Aerosol in Metal Fluxes in the Mediterranean Area,” Chemosphere, Vol. 39, No. 2, 1999, pp. 229-246. doi:10.1016/S0045-6535(99)00105-8
- M. Koulousaris, M. Aloupi and M. O. Angelidis “Total Metal Concentrations in Atmospheric Precipitation from the Northern Aegean Sea,” Water Air Soil Pollution, Vol. 201, No. 1-4, 2009, pp. 389-403. doi:10.1007/s11270-008-9952-0
- Z. Cong, S. Kang Y. Zhang and X. Li, “Atmospheric Wet Deposition of Trace Elements to Central Tibet Plateau” Applied Geochemistry, Vol. 25, No. 9, 2010, pp. 1415- 1421. doi:10.1016/j.apgeochem.2010.06.011
- A. Báez, R. Belmont, R. García, H. Padilla and M. C. Torres “Chemical Composition of Rainwater Collected at a Southwest Site of Mexico City, Mexico,” Atmospheric Research, Vol. 86, No. 1, 2007, pp. 61-75. doi:10.1016/j.atmosres.2007.03.005
- G. P. Hu and R. Balasubramanian, “Wet Deposition of Trace Metals in Singapore” Water Air Soil Pollution, Vol. 144, No. 1-4, 2003, pp. 285-300. doi:10.1023/A:1022921418383
- T. Ozsoy and S. Ornektekin, “Trace Elements in Urban and Suburban Rainfall, Mersin, Norteastern Mediterranean” Atmospheric Research, Vol. 94, No. 2, 2009, pp. 203-219. doi:10.1016/j.atmosres.2009.05.017
- L. Mariani, “Fog in the Po Valley: Some Meteo-Climatic Aspects,” Italian Journal of Agrometeorology, Vol. 14, No. 3, 2009, pp. 35-44.
- O. A. Al-Khashman, “Ionic Composition of wet Precipitation in the Petra Region, Jordan,” Atmospheric Research, Vol. 78, No. 1-2, 2005, pp. 1-12. doi:10.1016/j.atmosres.2005.02.003
- K. Adachi and Y. Tainosho, “Characterizations of Heavy Metal Particles Embedded in Trie Dust,” Environment International, Vol. 30, No. 8, 2004, pp. 1009-1017. doi:10.1016/j.envint.2004.04.004
- J. R. McConnel and R. Edwards, “Coal Burning Leaves Toxic Heavy Metal Legacy in the Artic,” Proceedings of the National Academy of Science of America United States, Vol. 105, No. 34, 2008, pp. 12140-12144.
- F. Monaci, F. Moni, E. Lanciotti, D. Grechi and R. Bargagli, “Biomonitoring of Airborne Metals in Urban Environments: New Tracers of Vehicle Emission, in Place of Lead,” Environmental Pollution, Vol. 107, No. 3, 2000, pp. 321-327. doi:10.1016/S0269-7491(99)00175-X
- O. A. Al-Khashman, “Study of Chemical Composition in Wet Atmospheric Precipitation in Eshidiya Area, Jordan,” Atmospheric Environment, Vol. 39, No. 33, 2005, pp. 6175-6183. doi:10.1016/j.atmosenv.2005.06.056
- G Guieu, C. M.-D. Loÿe-Pilot, L. Benyahya and A. Dufour “Spatial Variability of Atmospheric Fluxes of Metals (Al, Fe, Cd, Zn and Pb) and Phosphorus over the Whole Mediterranean from a one Year Monitoring Experiment: Biogeochemical Implications,” Marine Chemistry, Vol. 120, No. 1-4, 2010, pp. 164-178. doi:10.1016/j.marchem.2009.02.004
- C. A. Lu, J. F. Zhang, H. M. Jiang, J. C. Yang, J. T. Zhang, J. Z. Wang and H. X. Shan, “Assessment of Soil Contamination with Cd, Pb and Zn and Source Identification in the Area around the Huludao Zinc Plant,” Journal of Hazardous Materials, Vol. 182, No. 1-3, 2010, pp. 743- 748. doi:10.1016/j.jhazmat.2010.06.097