Journal of Environmental Protection
Vol.4 No.1(2013), Article ID:27174,5 pages DOI:10.4236/jep.2013.41003
Physico-Chemical Characteristics of the Products Derived from the Thermolysis of Waste Abies alba Mill. Wood
![]()
1Centro Nacional de Investigaciones Metalúrgicas, Consejo Superior de Investigaciones Científicas, Madrid, Spain; 2Instituto Nacional del Carbón, Consejo Superior de Investigaciones Científicas, Oviedo, Spain.
Email: *flopez@cenim.csic.es
Received November 5th, 2012; revised November 30th, 2012; accepted December 31st, 2012
Keywords: Thrermolysis; Abies alba Mill.; Bio-Oil; Biochar
ABSTRACT
This paper reports the physico-chemical characteristics of the products derived from the thermolysis (thermolytic distillation) of waste silver fir (Abies alba Mill.) wood at different temperatures (400˚C - 600˚C) in a pilot scale plant. Depending on the thermolysis temperature, the procedure yielded 45 - 53 wt% pyroligneous acid with a high water content (80 - 86 wt%) and pH ≈ 3.6. The process also produced a carbonaceous solid or biochar (23 - 26 wt%), its properties strongly dependent on the thermolysis temperature. Gases (20 - 31 wt%) were also produced; these were transformed into electrical energy via a gas turbine. The pyroligneous acid was centrifuged to isolate a subfraction composed mostly of phenols (phenol, mequinol and furfural) with a total C content of 68 - 74 wt%. The remainder was subjected to fractionated distillation at laboratory scale, and the distillate subjected to liquid-liquid extraction using diethyl ether in two stages to obtain a bio-oil composed mainly of acetic acid (≈47%), aldehydes, ketones and alcohols (≈31%), phenols (≈18%) and aliphatic alcohols. The characteristics of the bio-oil depended on the thermolysis temperature.
1. Introduction
Lignocellulose biomass is the only renewable source of fixed carbon that can be converted into liquid, solid and gaseous fuels with no contribution to net CO2 emissions. The pyrolysis of biomass is a promising method of producing solid (charcoal), liquid (tar and other organic compounds) and gaseous products [1-3] that could provide alternative sources of fuel and chemicals [4]. The liquids produced during biomass pyrolysis, widely known as pyroligneous acids (PAs), are complex mixtures of oxygenated aliphatic and aromatic compounds [5], including CH3OH, C2H5O, C3H6O, phenols, and water. CH3OH arises from the methoxyl groups of uronic acid and from the breakdown of methyl esters and/or ethers generated during the decomposition of pectin-like compounds. C2H5O is derived from the acetyl groups of hemicelluloses. Tars contain native resins, intermediate carbohydrates, phenols, aromatic compounds, aldehydes, their condensation products, and other derivatives. Pyrolysis gas is mainly composed of CO2, CO, CH4, H2, C2H6, C2H4, minor amounts of higher gaseous organics, and water vapor [6]. The pyrolysis products are mainly generated between 300˚C and 600˚C, their composition being highly dependent on the temperature. The aim of the present work was to study the influence of temperature (400˚C - 600˚C) on the distribution and physico-chemical characteristics of the products obtained from the thermolysis of waste silver fir (Abies alba Mill.) wood. This tree species is one of the most commonly cultivated in Europe.
2. Materials and Methods
2.1. Materials
The silver fir wood used in the present work came from the clearing of forests in the Catalan Pyrenees in Spain’s northeast. All wood was reduced to a size of 250 × 100 × 50 mm before thermolysis. Proximate and ultimate analysis of this waste wood (WW) was performed using a LECO TGA 701 analyser and a LECO CHNS 923 analyser respectively. Its higher heating value (HHV) was estimated using an IKAWEEME C4000 automatic bomb calorimeter. The lignin content was determined using the Tappi method T22 [7]. The cellulose content was determined using the Kushner procedure [8]. Table 1 shows the main characteristics of this WW; Table 2 reports its lignocellulose composition.
Table 1. Main characteristics of the waste wood before thermolysis.
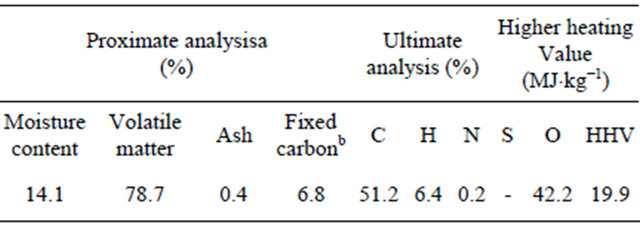
aWeight percentage (in terms of dry mass); bBy difference.
Table 2. Lignocellulose composition of the waste wood.
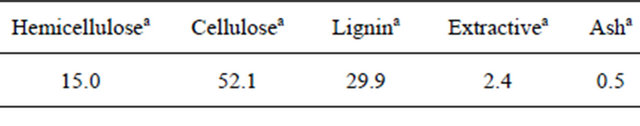
aWeight percentage (in terms of dry mass).
2.2. Experiments
Figure 1 shows a diagram of the procedure for the production of biochar and bio-oil. Thermolysis (thermolytic distillation) (1) was performed in a pilot plant making use of GRAUTHERMIC-CSIC technology [9]. The gases produced were condensed using a system of cryogenically cooled condensers, giving rise to a pyroligneous acid (PA) fraction (2).
The non-condensed gases were filtered and the gas led to a TOTEM (Total Energy Module) turbine (3) for the production of electricity. Batches of WW were heated for 4 h (treatment capacity 18 kg×h−1) at 400˚C, 500˚C and 600˚C. After completing the thermolytic process, the reactors were cooled for 4 h, opened, and the biochar removed by aspiration. The composition and yield (by weight) of the PA and biochar fractions were then determined; the difference between the weight of the initial WW sample and the combined weights of the PA and biochar is equal to the weight of the gas produced. The PA (2) was then centrifuged, producing a heavier tar fraction (4) and a lighter fraction (5). The latter fraction was separated into its components in a Vitreux fractionated distillation column. The residue left over (7) was added to the tar fraction obtained by centrifugation (4) to produce a combined fraction (8). The distillate from the fractionated distillation process (6) was extracted with diethyl ether (proportion 1:3 by volume) in two stages to obtain an aqueous (9) and an organic fraction (10). The organic fraction was evaporated in a rotary evaporator at 42˚C to recover the ether and obtain a final bio-oil (11).
2.3. Characterization of the Pyroligneous Acid, Bio-Char, Gases and Bio-Oil
The proximate and ultimate compositions of the PAs, bio-chars and bio-oils produced at each thermolysis temperature were determined using an automated LECO CHNS 923 analyser. Their HHV was determined using an IKAWEEME C4000 automatic bomb calorimeter. The water content of these products was determined by KarlFischer titration using Hydranal Composite 5K [Fluka] and employing a Karl-Fischer MKS-520 Moisture Titrator apparatus. The total acid number (TAN) was determined in a KEM Mod. AT-500N automated potentiometric titrator with two electrodes (glass and reference). The titration agent was a standard solution of KOH (F = 1). The bio-oils were also analysed by gas chromatography/mass spectroscopy (GC/MS) using a SHIMADZU GCMS-QP2010-Plus apparatus equipped with a 10 m × 0.1 mm × 0.1 µm TRB-5MS TEKNOKROMA capillary column (95% dimethyl-5% diphenyl polysiloxane). Samples of the gases produced at each thermolysis temperature were collected from the uncondensed gas exit tube after having passed through water, activated carbon and lead carbonate solution filters; all samples were captured in TEDLAR® bags. The samples were then analysed by gas chromatography using a HEWLETT-PACKARD 5890 gas chromatograph equipped with a Porapak N and Molecular Sieve multicolumn system, a thermal conductivity detector (TCD) and a flame ionisation detector (FID). The porous characteristics of the chars were determined using a Beckman Coulter SA1100 automatic adsorption analyser. Their surface areas were determined using the BET equation in the p/p0 range 0.015 - 0.15 (r2 > 0.9999).
3. Results and Discussion
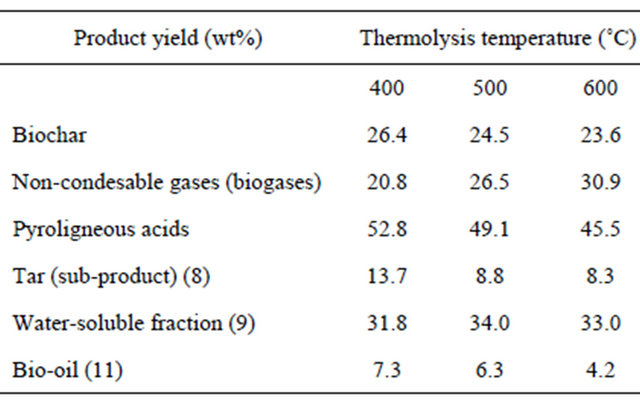
Table 3 shows the product yields from the thermolysis of the WW in relation to the thermolysis temperatures. The biochar yield fell slightly with temperature, the opposite seen for the non-condensable gases. The PA yield represented about 50 wt% of the thermolytic products, falling slightly with temperature. The light fraction obtained following PA centrifugation (5) was composed mainly of water; the water content increased slightly with the thermolysis temperature (81 wt% at 400˚C and 83 wt% at 600˚C).
The TAN for this light fraction remained practically constant at around 13 g/l. The pH also remained constant at approximately 3.6. Fractionated distillation of the light fraction and subsequent extraction showed water soluble compounds to be the major component (9). The tar (8) and bio-oil (11) yields fell with increasing thermolysis temperature.
The yield of biochar decreased with increasing thermolysis temperature, due either to the greater primary decomposition of the biomass at higher temperature, or secondary decomposition of the char residue. Such secondary decomposition at higher temperatures may also
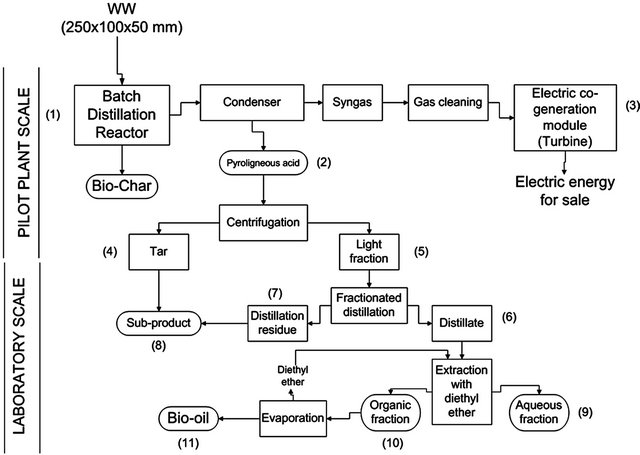
Figure 1. Flow chart showing the thermolytic process.
Table 3. Effect of temperature on product distribution.
have given rise to some non-condensable gaseous products that contributed to an increasing gas yield with the thermolysis temperature.
Table 4 summarizes the chemical composition of the combustible gases, their HHVs, and the amount of electricity produced from them with respect to the thermolysis temperature. The gases produced were rich in CH4, H2, CO2 and CO, and contained small quantities of C2H4, C2H6, C3H6, C3H8, C4H8, nC4H10 and isoC4H10. The percentage volume of CO and CO2 increased remarkably with temperature, while those of H2 and CH4 decreased. The total gas volume (η) also increased with temperature (100 Nm3×t−1 at 400˚C and 150 Nm3×t−1 at 600˚C). The HHV of the gases fell with the thermolysis temperature
Table 4. Effect of thermolysis temperature on gas composition (vol%) and properties.
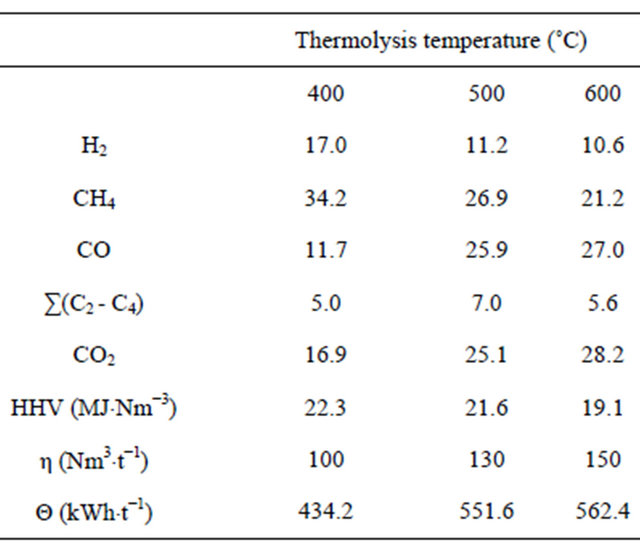
a consequence of a reduction in H2 and CH4. However, the electrical energy production (Θ) via the gas turbine increased with temperature (range 434 - 562 kWh×t−1), a consequence of the relatively greater CO volume. The mean yield of the turbine was 70%.
Table 5 reports the change in the biochar composition with thermolysis temperature. The volatile material content decreased with increasing temperature, corresponding to an increment in the fixed carbon content. The biochar obtained at 600˚C had high fixed carbon content:
Table 5. Main characteristics of the biochar produced at different thermolysis temperatures.
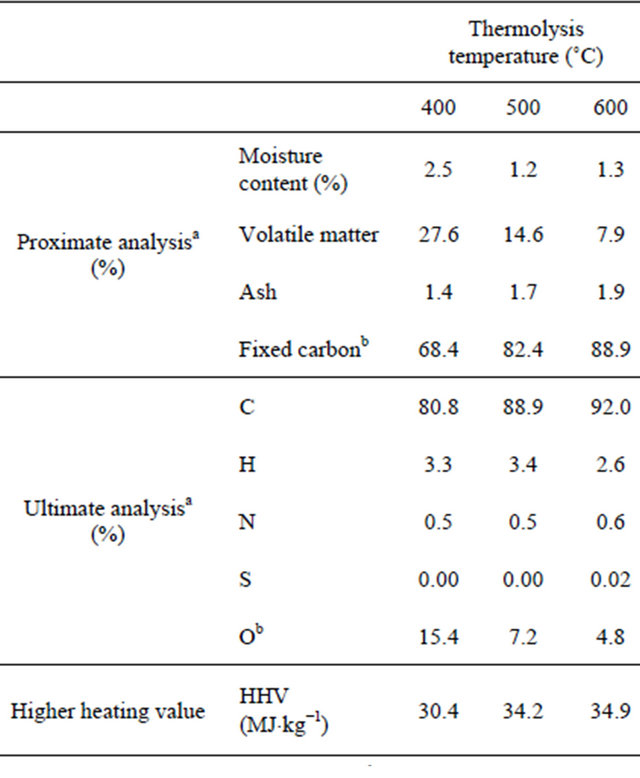
aWeight percentage (in terms of dry mass); bBy difference.
88.9%. This corresponds to a very high C content (92%).
The biochars had essentially a macroporous structure (Table 6). The total pore volume increased with the thermolysis temperature from 0.05 cm3×g−1 at 400˚C to 0.17 cm3×g−1 at 600˚C). The mean pore size fell from 2 nm at 400˚C to 0.82 nm at 600˚C; however, the BET area increased from 124 m2×g−1 at 400˚C to 405 m2×g−1 at 600˚C.
Table 7 shows the variation in the chemical composition of the heavy hydrocarbon (tar) and bio-oil fractions with respect to thermolysis temperature. The tar fraction was composed mainly of phenols, acetones, aldehydes (derivatives of ethanone, propanone, pentanone, cyclopeantanone and benzofuranone) and alcohols (mequinol, eugenol, glycerine and hydroquinone).
The bio-oil was composed mostly of carboxylic acids (acetic acid ≈ 40% [in terms of the area of the gas chromatography peak], propanoic acid ≈ 4%, and butanoic acid ≈ 2%) derived from plus aldehydes and ketones (furfural, 2-propanone 1-hydroxy and 2-cyclopenta-1-one) derived from the breakage of the cellulose bonds. Phenols (phenol,2-methoxy phenol and 1,2 2-methoxy-5- methylphenol) produced by the depolymerisation of lignin and alcohols (mequinol and glycerine) were present in smaller proportions. The quantity of aldehydes and ketones fell with increasing thermolysis temperature (39% at 400˚C compared to 30% at 600˚C). The content in carboxylic acids and phenols did not vary significantly, remaining at around 44% and 17% respectively. The alco
Table 6. Surface area and pore volume of biochars.
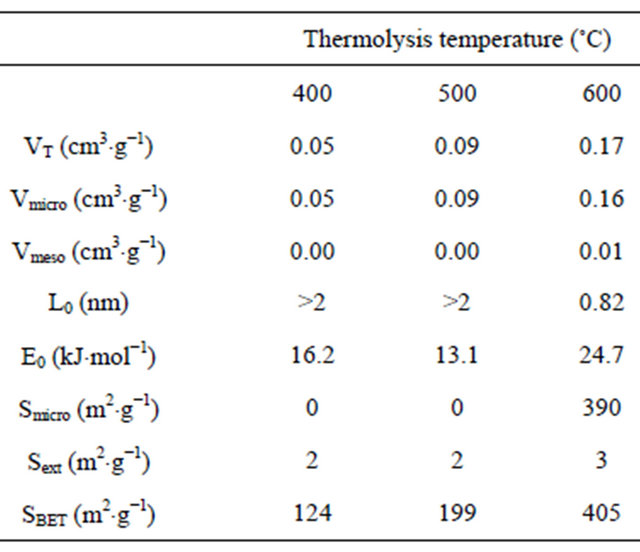
VT: Total pore volume estimated at P/P0 = 0.95 (cm3/g); V micro: Micropore volume (cm3/g); Vmeso: Mesopore volume (cm3/g); L0: Average width of the micropores (nm); Smicro: Micropore surface area (m2/g); Sext: External surface area (m2/g); SBET: BET surface area determined by N2 adsorption at 77 K (m2/g).
Table 7. Main characteristics of residual tar and bio-oils.
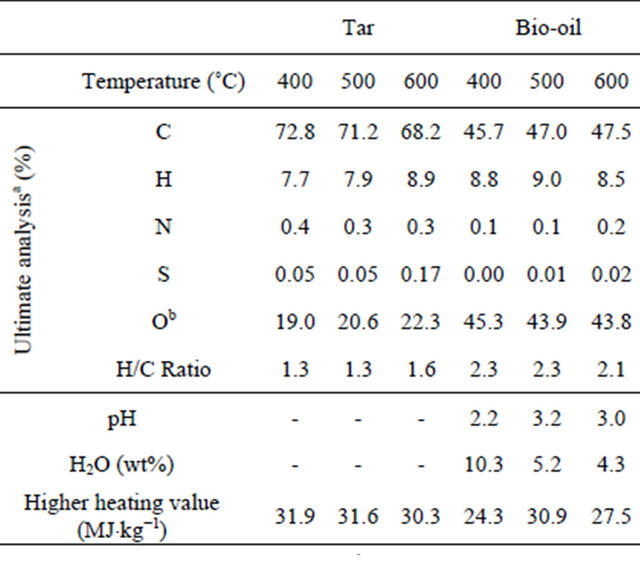
aWeight percentage (in terms of dry mass); bBy difference.
hol content rose slightly with temperature from 1% at 400˚C to 4% at 600˚C. The bio-oils obtained at the different temperatures had pH and density values, O and H contents and HHVs similar to those of other pyrolytic bio-oils, though their C content was slightly lower [10].
4. Conclusion
This work focuses on the valorisation of waste silver fir wood via a simple thermolysis process. Its success lies mainly in the large amount of energy recovered from the gases generated. The biochars produced show great aptitude for CO2 capture, and could be used as activated compounds in animal feed for the removal of toxins from the intestinal tract. However, unlike that seen with other pyrolytic techniques, the present procedure produces large quantities of pyroligneous acids, the transformation of which into bio-oils is poor in terms of yield. Nonetheless, the properties of the bio-oils thus obtained are similar to those obtained by other pyrolytic techniques.
5. Acknowledgements
Dr. O. Rodríguez is the recipient of contract JAEDoc_ 09-00121 (CSIC), co-funded under the FSE 2007-2013 Multiregional Adaptability and Employment Operational Programme. The experimental work undertaken was performed with the financial support of ENRECO 2000 Ltd.
REFERENCES
- M. Amutio, G. Lopez, R. Aguado, M. Artetxe, J. Bilbao and M. Olazar, “Effect of Vacuum on Lignocellulosic Biomass Flash Pyrolysis in a Conical Spouted Bed Reactor,” Energy & Fuels, Vol. 25, No. 9, 2011, pp. 3950-3960. doi:10.1021/ef200712h
- A. V. Bridgwater, “Review of Fast Pyrolysis of Biomass and Product Upgrading,” Biomass and Bioenergy, Vol. 38, No. 3, 2012, pp. 68-94. doi:10.1016/j.biombioe.2011.01.048
- M. Balat, “An Overview of the Properties and Applications of Biomass Pyrolysis Oils,” Energy Sources Part A: Recovery Utilization and Environmental Effects, Vol. 33, No. 7, 2011, pp. 674-689.
- A. Demirbas, “Recovery of Oily Products from Organic Fraction of Black Liquor via Pyrolysis,” Energy Sources Part A: Recovery Utilization and Environmental Effects, Vol. 30, No. 20, 2008, pp. 849-855. doi:10.1080/15567030701457368
- N. A. T. K. Prakash, “Advances in Modeling and Simulation of Biomass Pyrolysis,” Asian Journal of Scientific Research, Vol. 2, No. 1, 2009, pp. 1-27. doi:10.3923/ajsr.2009.1.27
- P. T. Williams and A. R. Reed, “Pre-Formed Activated Carbon Matting Derived from the Pyrolysis of Biomass Natural Fibre Textile Waste,” Journal of Analytical and Applied Pyrolysis, Vol. 70, No. 2, 2003, pp. 563-577. doi:10.1016/S0165-2370(03)00026-3
- C. W. Dence. “The Determination of Lignin,” In: C. W. Dence, Ed., Methods in Lignin Chemistry, Springer-Verlag, Berlin, 1992, pp. 33-40.
- A. V. Obolenskaya, Z. P. Elnitskaya and A. A. Leonovitch, “Laboratory Works in Wood Cellulose Chemistry,” Ecologya, Moscow, 1991, pp. 176-179.
- F. A. Lopez, T. A. Centeno, F. J. Alguacil and B. Lobato, “Distillation of Granulated Scrap Tires in a Pilot Plant,” Journal of Hazardous Materials, Vol. 190, No. 1-3, 2011, pp. 285-292. doi:10.1016/j.jhazmat.2011.03.039
- Q. Zhang, J. Chang, T. Wang and Y. Xu, “Review of Biomass Pyrolysis Oil Properties and Upgrading Research,” Energy Conversion and Management, Vol. 48, No. 1, 2007, pp. 87-92. doi:10.1016/j.enconman.2006.05.010
NOTES
*Corresponding author.