Journal of Environmental Protection
Vol. 3 No. 8A (2012) , Article ID: 21789 , 14 pages DOI:10.4236/jep.2012.328096
Impacts of Land Use, Fertilizer and Manure Application on the Stream Nutrient Loadings in the Salmon River Watershed, South-Central British Columbia, Canada
![]()
1Water & Aquatic Sciences Research Program, Department of Biology, University of Victoria, Victoria, Canada; 2Kamloops Range Research Station, Agriculture and Agri-Food Canada, Kamloops, Canada.
Email: *zzhu@uvic.ca
Received May 20th, 2012; revised June 21st, 2012; accepted July 18th, 2012
Keywords: Model; Landuse; Nitrogen; Phosphorus; Fertilizer; Manure
ABSTRACT
Manure and fertilizer applications can increase soil productivity and land economic values, but the controversial result can be a decline of water quality due to the increased nutrient exports from soils to the streams. The impacts of landuse, manure and fertilizer application on nutrient exports from soils to the streams were analyzed using the SWAT (Soil Water Assessment Tool) model for the Salmon River watershed in south-central British Columbia, Canada. The results showed that the animal farms had the highest rates of nutrient exports from soils to the streams and the natural forested lands had the lowest. It was estimated that the whole Salmon River watershed would export approximately 11.52 t∙yr−1 of organic nitrogen (ON), 8.05 t∙yr−1 of nitrate nitrogen (NO3-N), 2.30 t∙yr−1 of organic phosphorus (OP) and 1.36 t∙yr−1 of soluble reactive phosphorus (SRP) if the whole watershed was covered by natural vegetation without human disturbance. Current landuse changes, by converting natural vegetation lands to agriculture and animal farms and associated manure and fertilizer applications, have increased approximately 53.30 t∙yr−1 of ON, 9.68 t∙yr−1 of NO3-N, 22.69 t∙y−1 of OP and 6.23 t∙y−1 of SRP exports to the streams in the whole watershed. The SWAT model predicted that a daily 100 kg∙ha−1 of fresh manure deposit from grazing cows during grazing season from later spring to later fall could increase 2.57 kg∙ha−1∙yr−1 of ON, 0.39 kg∙ha−1∙yr−1 of NO3-N, 2.35 kg∙ha−1∙yr−1 of OP and 0.48 kg∙ha−1∙yr−1 of SRP export to the streams. Fertilization could increase 1.57 kg∙ha−1∙yr−1 of ON and 4.02 kg∙ha−1∙yr−1 of NO3-N export to the streams if 100 kg∙ha−1∙yr−1 of nitrogen (NH4NO3) fertilizer was applied in spring. Also fertilization could increase 1.18 kg∙ha−1∙yr−1 of OP and 0.20 kg∙ha−1∙yr−1 of SRP export to the streams if 100 kg∙ha−1 phosphorus (P2O5) fertilizer was applied in spring.
1. Introduction
The United States and many other countries have rapidly changed their landuse through the conversions of natural forested lands to agriculture and urban lands [1-6]. This has also occurred in British Columbia (BC), Canada. The quality of stream water generally declines as a result of intensive agricultural management with increasing fertilizer and manure applications [4,7-10]. In BC, as in some other provinces of Canada, water from streams and lakes are the main source of water supply. Eighty percent of the population in BC obtains its drinking water from small rivers and lakes while the remaining 20% draws water from large lakes, rivers and aquifers [11]. To investigate the impacts of agriculture on water quality, the environment and community health, Agriculture and Agri-Food Canada (AAFC) initiated a program called the Canada’s National Environmental Farm Planning (EFP). The EFP goals include: 1) helping the agricultural industry to identify its impacts on the environment; 2) assuring agricultural resources are managed in a sustainable fashion and 3) helping to brand Canada in the global market as a source of safe, high-quality food produced in an environmentally responsible manner. As a part of this program through Greencover Canada, the national Watershed Evaluation of Beneficial Management Practices (WEBs) program was established in 2004. The WEBs program provides technical supports for agricultural producers, land managers and policy makers for agricultural watersheds. The national WEBs project has been conducted in the nine research watersheds, including the Salmon River watershed, across Canada since 2004. The project focuses on the research of Beneficial Management Practices (BMPs), which is defined as watershed management practices that minimize point and non-point sources of pollutions (e.g. chemicals and bacteria) while maximizing land economic income for farmers [12]. The Salmon River watershed drains into Shuswap Lake at Salmon Arm in south-central BC and is within the Fraser River Basin. Intensive landuses including agriculture with its increased fertilizer and manure applications have resulted in a negative response of water quality that has become a concern for the communities along the river and downstream [13,14]. The WEBs’ study in the Salmon River watershed included field experiment and modeling. The field experiment was designed to evaluate riparian fencing and the supplying of off-stream water for cattle. The impacts of cattle access to the Salmon River were being evaluated by comparing the corresponding water quality data from the reaches along the river that had cattle exclusion fencing and the areas where cattle had direct access and were unfenced. The modeling work provided supports for the field experiment by filling the data gaps that were difficult to measure by field experiment.
The objectives of this study were to: 1) calibrate and validate the SWAT model [15] for the Salmon River watershed; 2) estimate nitrogen and phosphorous exports from different site types to the streams, a site type is an unique combination of a landuse type and a soil type and also called Hydrological Response Unit (HRU) in the SWAT model; 3) analyze the impacts of current landuse changes on the stream nutrient loadings and 4) estimate the stream N and P loadings in response to the different amounts of manure and fertilizer applications.
2. Materials and Methods
2.1. Outline of the Research Procedure
This research used the SWAT model as an analysis tool to determine how landuse, fertilizer and manure application affect nitrogen (N) and phosphorus (P) exports from soils to the stream in each site type or HRU. The research procedure is outlined as the following steps. In step 1, watershed landuse, soil and digital elevation (or called digital elevation model, DEM) data were collected and used to set up the SWAT model and climate date to run the model. In step 2, field measured stream flow, N and P loading data were used to calibrate and validate the SWAT model. In step 3, the calibrated SWAT model was used to estimate N and P export rates from different site types to the streams. In step 4, the SWAT model was used to predict the stream N and P loadings in response to the amounts of fertilizer and manure applications.
2.2. Watershed Description
The Salmon River watershed is located at the latitude of 50˚29' north and longitude of 119˚35' west. The river’s length is approximately 120 km. The watershed covers around 1500 km2. The elevation ranges from 400 to 2100 m above sea level. The Salmon River flows from east to west from its headwaters to Glenemma and from south to north from Glenemma to its outlet at Salmon Arm (Figure 1(a)). Average annual water flow amounts to 1.17 × 10⁸ m3∙yr−1, with maximum and minimum daily stream flow of 2.33 × 10⁶ and 4.75 × 10⁴ m3, respectively.
The climate is continental climate characterized by a warm and dry summer, a fairly long growing season and a cool winter. The watershed lies in the rain shadow created on the leeward side of topographic barriers that include the Coast, Cascade and Columbia Mountains blocking the prevailing easterly flowing air from Pacific Ocean and is the main factor controlling the climate. Mean annual temperature is 1.6˚C. There are 3 - 5 winter months with monthly average temperature below 0˚C and
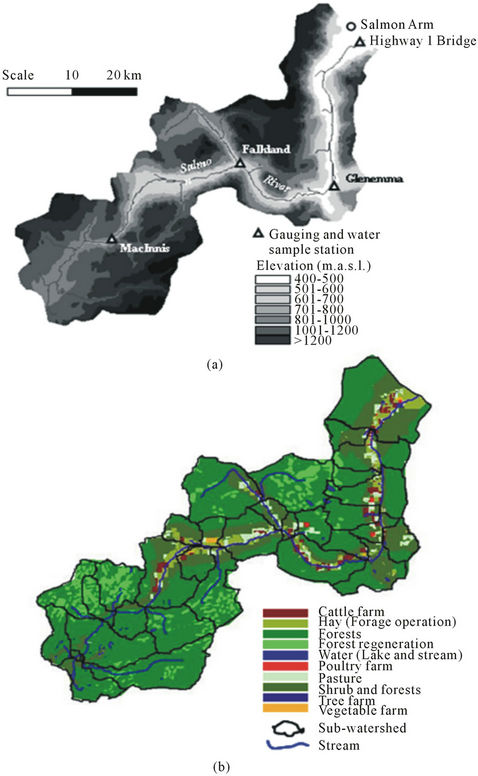
Figure 1. (a) The Salmon River watershed topography and monitoring stations and (b) The Salmon River watershed landuse.
3 - 5 summer months above 10˚C. The mean annual precipitation is around 300 mm with approximate 50% of the precipitation falling as snow. Substantial growing season moisture deficit is common in summer and frost can occur at any time at the higher elevation.
The Salmon River watershed is a mixed forest and agriculture watershed. Approximately 91.2% of the watershed is forested lands, 8.3% agriculture lands, and remainder 0.5% water (Table 1, Figure 1(b)). Forage production, pasture grazing, cattle and poultry farms are the major agricultural activities. The agricultural lands are mostly located at the lower elevations from 400 to 600 m in the valley bottom along the river and forested lands are located above 800 m. Area from 600 to 800 m elevation is characterized by steep slopes and covered with lower density forests and shrubs.
According to the Canadian Soil Classification System [16], the soils in the watershed consist of 23% of Eluviated Eutric Brunisols (E.EB) located in the elevation from 900 to 1100 m, 24% Eluviated Dystric Brunisols (E.DYB) from 1100 to 1300 m, 19% Orthic Eutric Brunisols (O.EB) from 900 to 1100 m, 15% Orthic Ferro-Humic Podzols (O.HFP) from 600 to 900 m, 12% Orthic Gray Luvisol (O.GL) from 400 to 700 m, 4% Orthic Dystric Brunisols (O.DYB) from 1600 to 1700 m and 2% Orthic Regosols (O.R) from 400 to 600 m. The O.GL, O.HFP and O.R soils support most of the agriculture lands while the other soil types sustain forests and the other natural vegetation lands.
2.3. Outline of the SWAT
The SWAT is a process-based ecosystem model and simulates hydrology and nutrient cycles and transfers from soils to the streams. It operates on GIS platform, spatially at watershed scale, and temporally at daily, monthly and yearly scales [15]. The SWAT model divides a watershed into sub-watersheds according to stream network and watershed elevation. Each sub-watershed is further divided into a series of HRUs. Each HRU is a basic simulation unit. Hydrology, vegetation growth and nutrient cycle are independently simulated for each HRU and then aggregated for the sub-watershed. Outflow water and its associated nutrient exports through surface runoff and lateral flow from each HRU are directly routed to the river reaches.
The hydrology is simulated based on the water balance equation:
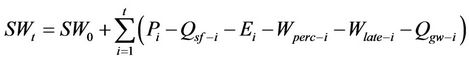 (1)
(1)
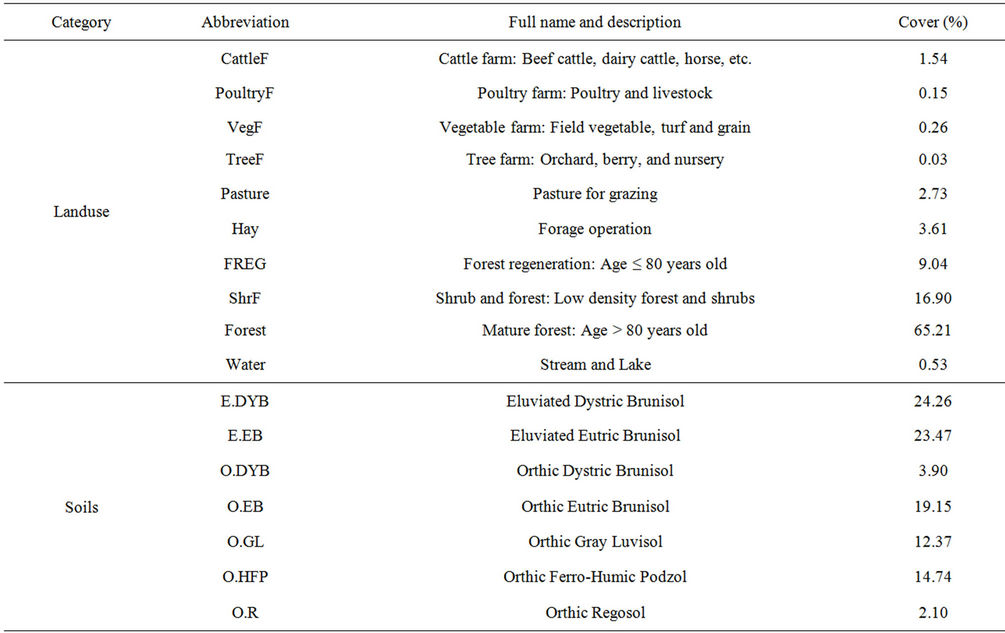
Table 1. Landuse and soil classification in the Salmon River watershed.
where SWt is the final soil water content, SW0 is the initial soil water content, i is the time step, Pi is the amount of precipitation, Qsf-i is the amount of surface runoff, Ei is the amount of evapotranspiration, Wperc-i is the amount of percolation exiting the soil, Wlate-i is soil lateral flow and Qgw-i is the amount of return flow from groundwater. The stream flow consists of surface runoff, lateral flow and groundwater return flow.
The SWAT simulates N and P biogeochemical cycling. The three major forms of N in mineral soils are ON associated with humus, mineral forms of N held on the soil colloids and mineral forms of N in the soil solution. Nitrogen is added to the soils by fertilizer and manure application and biological fixation. Nitrogen is removed from the soils by plant uptake, volatilization, denitrification and exports with water through surface runoff, lateral flow and leaching. The SWAT monitors five different pools of N in the soil. Two pools are inorganic forms of N, ammonia-N (NH4-N) and NO3-N, while the other three pools are ON that includes fresh ON associated with crop residue and microbial biomass, active ON associated with soil humus available to mineralization and stable ON pool associated with the soil humus not available to mineralization.
The three major forms of P in mineral soils are OP associated with humus, insoluble forms of mineral P and plant-available P in soil solution. Phosphorus is added to the soil by chemical fertilizer and manure application. Phosphorus is removed from the soil through plant uptake and the outflow of water by surface runoff, lateral flow and leaching. The SWAT model monitors six different pools of P in the soil. Three pools are inorganic forms of P while the other three pools are organic forms. Fresh OP is associated with crop residue and microbial biomass while the active and stable organic P pools are associated with the soil humus. Like ON associated with humus, OP associated with humus is partitioned into two pools to explain for the variation in the availability of humic substances to mineralization. Soil inorganic P is divided into solution, active and stable pools. The solution pool is in rapid equilibrium with the active pool while the active pool is in slow equilibrium with the stable pool.
The stream nutrient loading mainly comes from soil surface runoff and lateral flow. It is calculated by
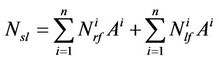 (2)
(2)
where Nsl is the stream nutrient loading during a time period (kg),  represents the rate of nutrient transfer from soil to the stream by soil surface runoff in the HRU i (kg∙ha−1),
  represents the rate of nutrient transfer from soil to the stream by lateral flow (kg∙ha−1) and
  is the area of each HRU (ha)
The rate of NO3-N transfer from soil to the stream by surface runoff is calculated by
 (3)
(3)
where NO3rf is the rate of NO3-N transfer from soil to the stream by surface runoff during a time period (kg∙ha−1),  is the concentration of NO3-N in the soil surface water (kg∙mm−1), Qsf is the rate of surface runoff (mm∙ha−1).
The rate of NO3-N transfer from soil to the stream by lateral flow is calculated by
 (4)
(4)
where NO3lf is the rate of NO3-N transfer from soil to the stream by lateral flow during a time period (kg∙ha−1),  is the concentration of NO3-N in the soil water (kg∙mm−1), and Qlf is the lateral flow rate of soil water to the stream (mm∙ha−1).
It is assumed that soil ON is attached to the soil particles, so the transfer from soil to the stream is along with soil sediments. It is calculated by
 (5)
(5)
where orgNss is the rate of ON transfer from soil to the stream during a time period (kg∙ha−1), conorgN is the ON concentration in the sediment (kg∙ton−1), Ssed is the sediment amount (ton∙ha−1), and εN_sed is a parameter representing the impact of soil particle size on the concentration of ON in the sediments (dimensionless).
The SRP and OP transfers from soils to the streams are calculated similar to NO3-N and ON. The detailed theories and mathematical equations that quantify water and nutrient cycling can be found in the SWAT model user manual [15].
2.4. Data Collection
The data required for running the SWAT model were obtained from different sources. The digital elevation model with 1:50,000 of resolution, forest cover and stream network maps were obtained from the Natural Resource Canada. The agriculture landuse map was obtained from the BC Ministry of Agriculture and Lands, Canada. The map of soil type distribution and soil properties of each soil type were obtained from the Canadian Soil Information System managed by Agriculture and Agri-Food Canada. Climate conditions were recorded at the weather station near Salmon Arm by Environment Canada and the data were obtained from the National Climate Data and Information Archive of Environment Canada. Stream flow and water quality were monitored at a number of locations along the Salmon River from its headwaters near McInnis down to the outlet near Salmon Arm by the bridge at the Highway 1 by the British Columbia and Yukon Environmental Monitoring Networks of Environment Canada (Figure 1(a)). Climate, stream discharge and water quality data covered the period from 1996 to 2006.
2.5. SWAT Model Set up, Calibration and Validation
The SWAT model set up: The model was set up by: 1) loading the DEM and stream network GIS map files into the SWAT model; 2) delineating the Salmon River watershed into sub-watersheds according to the DEM and stream network; 3) overlaying landuse and soil GIS map files into each sub-watershed to determine the HRUs; 4) setting up initial soil chemical and physical properties for each HRU and 5) setting up current management conditions for each HRU, including tillage method, the time and amount of fertilizer and manure application, irrigation time and amount of water and the starting and ending time of cattle grazing on the pasture lands. The current watershed management conditions were summarized as: 1) Cattle farms (CattleF, see Table 1 for landuse classification) have cattle or large animals on farms from October to the end of next May and produce 50 kg∙ha−1∙ day−1 of fresh manure; 2) Poultry farms (PoultryF) have poultry on farms year round and produced 50 kg∙ha−1∙ day−1 of fresh manure; 3) vegetation farms have 50 kg∙ ha−1∙day−1 N fertilizer (NH4NO3) application annually with the tillage operation in May; 4) Pasture lands have cattle grazing from later spring to later fall and a 50 kg∙ha−1∙day−1 of fresh manure being deposited by the grazers; 5) Hay farms apply 50 kg∙ha−1∙day−1 of N fertilizer and 50 kg∙ha−1∙day−1 of phosphorus fertilizer (P2O5) in May as a top-dressing operation. Haying and silage operations occur near the end of the growing season, early October and 6) the other landuses such as forests have no management operations. Typical nutrient contents of the various manures were based on the data from the BC Ministry of Agriculture and Lands, Canada. Total N content is 4.2 kg∙t−1 for cattle manure at a 68% of moisture content, 27.2 kg∙t−1 for poultry manure with a 38% of moisture content, phosphorus (P2O5) 4.8 kg∙t−1 for cattle manure and 26 kg∙t−1 for poultry manure. The Salmon River watershed was divided into 33 sub-watersheds and 34 HRUs (Figure 1(b)). The initial conditions of soil physical and chemical properties were summarized in Table 2. The temperature and precipitation data that drive the model are shown in Figure 2.
The SWAT model calibration and validation: The SWAT model was calibrated and validated using the field data collected from the sites at the Highway 1 Bridge, Glenemma, Falkland, and McInnis (Figure 1(a)).
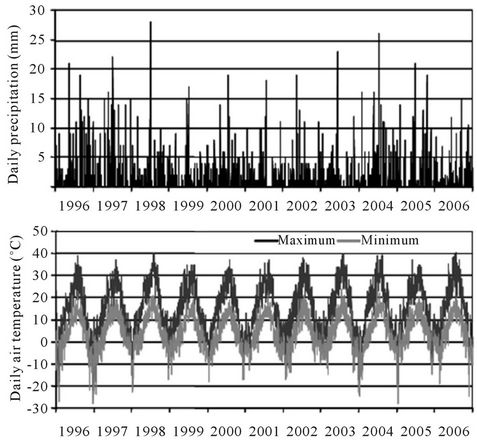
Figure 2. Salmon River watershed daily precipitation and air temperature.
A standard split sample calibration-validation procedure was used for the SWAT model calibration and validation in this study [17-19]. The SWAT model was calibrated using the field data from 1996 to 2000 and validated using the field data from 2001 to 2006. The calibration followed the standard procedures described in the user’s manual [15] by first calibrating hydrology and then nutrients. The hydrology was first calibrated for annual stream flows and then shifted to monthly stream flows by 1) adjusting the runoff curve numbers that are used to determine surface runoff amount according to precipitation for each HRU until surface runoff is acceptable, 2) then calibrating subsurface flows by adjusting the parameters that control the water exchange between soil zone and groundwater according to the measured and simulated values of stream base flows and 3) last calibrating temporal stream flows by adjusting the parameters controlling the rate of snow accumulation and melt. The stream nutrient loadings were calibrated by 1) verifying the initial concentrations of nutrients in the soils, the amount of fertilizer applications and tillage operations and 2) adjusting the parameters controlling nutrient biogeochemical cycles until the simulated and field measured stream nutrient loadings match well. The model performance was evaluated by the Nash-Sutcliffe coefficient of efficiency (COE). The COE is calculated using the model simulated and measured stream flows, N and P loadings from 1996 to 2000 for calibrations and from 2001 to 2006 for validations [20]. The COE is commonly used in the evaluation of process-based models regarding time series data [21,22] and is mathematically expressed as
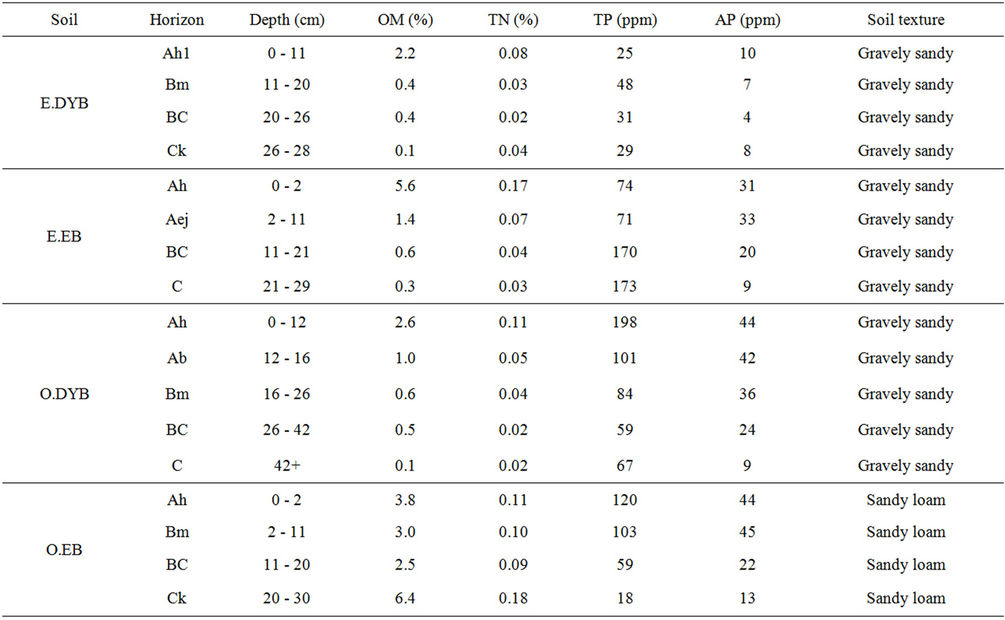
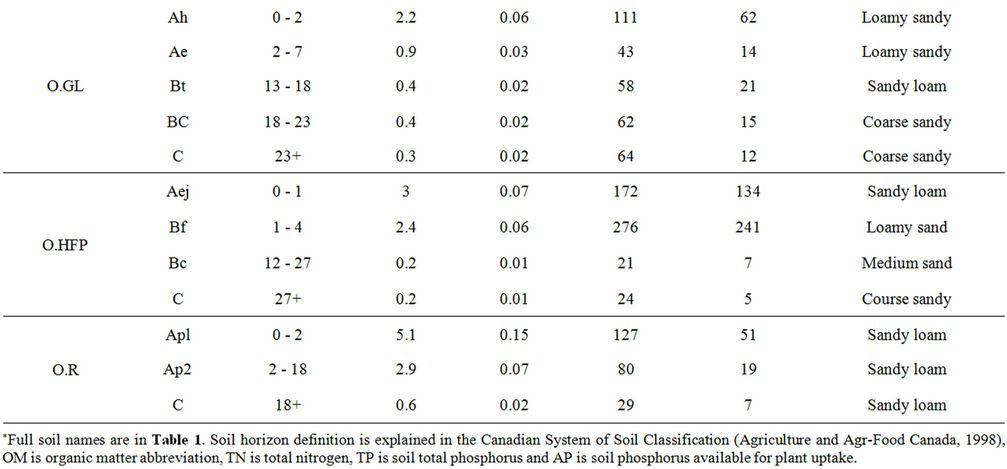
Table 2. Soil properties in the Salmon River watershed*.
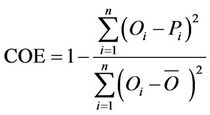 (6)
(6)
where  is the mean of the measured values, Pi and Oi are the predicted and observed values, respectively, and n is the number of values considered. A zero value for the COE indicates that the model predictions represent the average value of the observations. A negative value for the COE indicates that the variance between model predictions and observations is larger than the variance of observations itself and the COE is then inferior to the average. In contrast, a value between 0 and 1 for the COE indicates that the model prediction is closer to the observations than the average. The COE is then superior to the average. The model prediction perfectly matches the observation if the COE value is equal to 1 [22]. The SWAT hydrology calibration for the Salmon River watershed was evaluated by comparing measured and simulated monthly stream flows. Nutrient calibration was evaluated by comparing the measured and simulated monthly stream ON, NO3-N, OP and SRP loading. The calibrations were processed by reiteratively running the model from 1996 to 2000, comparing the model-predicted monthly stream flows, N and P loadings against field-measured values, calculating COE values and adjusting the parameters until the model-predicted stream flows, N and P loadings matched the field-measured values well (e.g., the highest COE value for each item). The SWAT model validation was processed by running the model, comparing the model-predicted and fieldmeasured stream flows, N and P loadings and calculating the COE values using the climate, landuse and management data from 2001 to 2006 and the model parameters set up during the calibration.
2.6. Estimations of N and P Exports from Different Site Types to the Streams and in Response to the Amounts of Fertilizer and Manure Application
The nutrient exports from each site type to the stream were analyzed based on the Equations (2)-(5). The analyses of N and P exports to the streams from different site types in response to the amounts of fertilizer application and manure deposition by grazing cattle were carried out on three scenarios of fertilizer application and three scenarios of manure deposition using the calibrated and validated SWAT model. The three scenarios of fertilizer application are that 50, 100 and 150 kg∙ha−1∙yr−1 of nitrogen (NH4NO3) and phosphorus (P2O5) fertilizer, respectively, are applied to the hay production lands at the beginning of growing season in May. The three scenarios of manure deposition are that the grazing cattle deposit 50, 100, 150 kg∙ha−1∙day−1 of fresh manure on pasture lands during the grazing season from later spring to later fall. The SWAT model was then reset to the three fertilizer and manure application amounts after it was calibrated and validated. The SWAT was run again under the reset fertilizer and manure application amounts and its outputs were used to estimate the stream nutrient loadings in response to the different amounts of fertilizer and manure application.
3. Results
3.1. Model Calibration and Validation Results
Using the COE values to evaluate the SWAT model performance based on the calibration and validation on monthly time step, the results showed that the COE values ranged from 0.62 to 0.87 for the calibration and from 0.61 to 0.88 for the validation (Table 3). The COE values demonstrated that the SWAT model simulated monthly stream flows, ON, NO3-N, OP and SRP loadings well in both calibrations and validations for the Salmon River watershed. The comparisons of the SWAT simulated and measured monthly stream flows, ON, NO3-N, OP and SRP loadings are shown in Figure 3 for the Highway 1 Bridge site. The SWAT predictions were close to the individual observations. The simulated values of monthly stream flows, ON, NO3-N, OP and SRP loadings were generally in good agreement with observed values in terms of temporal synchronicity and magnitude. Comparing our COE values of the SWAT model calibrations and validations with similar studies by Grizzetti et al. [21] and Meixner et al. [22], the SWAT model was well calibrated and validated. So the SWAT model was reliable to be used in predicting N and P exports from different site types and in response to the amounts of manure and fertilizer application in the Salmon River watershed.
3.2. Nitrogen and P Exports from Different Site Types
The ON, NO3-N, OP and SRP exports from different site types (or HRUs) to the streams were predicted by the
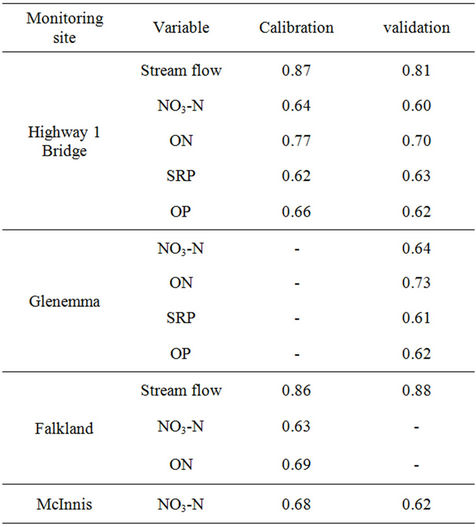
Table 3. Nash-Sutcliffe coefficient (COE) for the SWAT calibration and validation.
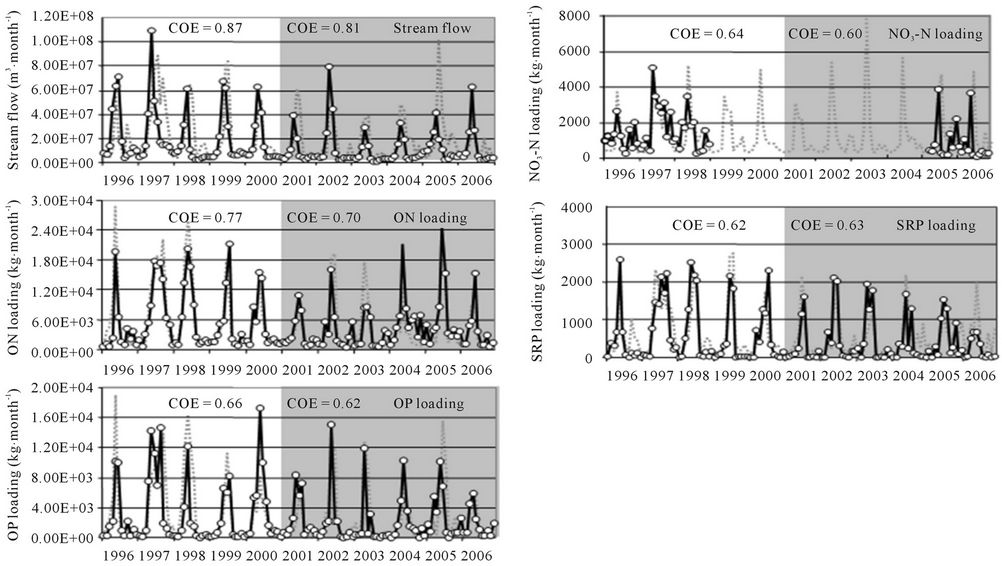
Figure 3. Comparisons of the SWAT model simulated (dash line) and field measured (solid line) stream flow, nitrate nitrogen (NO3-N), organic nitrogen (ON), organic phosphorus (OP) and soluble reactive phosphorus (SRP) loading for the calibration period from 1996 to 2000 (unshaded area) and validation period from 2001 to 2006 (shaded area) using the field data from the site at Highway 1 bridge near Salmon Arm.
SWAT model based on the Equations (2)-(5) and summarized in Table 4. The results showed that the current mean annual ON export from different site types to the streams, weighted by the areas of each landuse and soil cover, was 0.54 kg∙ha−1∙yr−1 for the whole Salmon River watershed. The poultry farms exported the largest ON to the stream with an average of 18.78 kg∙ha−1∙yr−1 ranging from 10.68 to 25.92 kg∙ha−1∙yr−1. Low density forested lands and shrubs had the lowest ON export rate to the stream with an average of 0.05 kg∙ha−1∙yr−1 ranging from 0.02 to 0.11 kg∙ha−1∙yr−1. The landuses such as vegetation and pasture had the medium rates of ON exports to the streams.
The average of annual NO3-N exports from different site types to the streams was 0.15 kg∙ha−1∙yr−1 for the whole watershed. The hay production lands had the highest NO3-N export rates with an average of 1.87 kg∙ha−1∙yr−1 ranging from 1.24 to 2.29 kg∙ha−1∙yr−1 and forest regeneration lands had the lowest with an average of 0.02 kg∙ha−1∙yr−1 ranging from 0.01 to 0.02 kg∙ha−1∙yr−1.
The average of annual OP exports from different site types to the streams was 0.21 kg∙ha−1∙yr−1 for the whole watershed. Vegetable farms had the highest OP export rate with an average of 4.33 kg∙ha−1∙yr−1 ranging from 2.27 to 6.39 kg∙ha−1∙yr−1 and the forested lands had the lowest with an average of 0.02 kg∙ha−1∙yr−1 ranging from 0.01 to 0.02 kg∙ha−1∙yr−1.
The average of annual SRP exports from different site types to the streams was 0.06 kg∙ha−1∙yr−1 for the whole watershed. The cattle farms had the highest SRP export rate with an average of 2.25 kg∙ha−1∙yr−1 ranging from 1.66 to 3.28 kg∙ha−1∙yr−1 and the forested lands had the lowest with an average of 0.01 kg∙ha−1∙yr−1.
3.3. Nitrogen and P Export Rates in Response to the Amounts of Manure Deposition
The analysis of N and P exports from pasture grazing lands to the streams in response to the amounts of fresh manure deposited by grazing cattle was carried out using the SWAT model according to the three amounts of manure deposition described in Section 2.6. The results are shown in Table 5. The SWAT model predicted that N and P exports from the pasture grazing lands to the streams increase as the manure deposition increases. The mean annual ON export to the stream increases 1.53 kg∙ha−1∙yr−1 ranging from 0.04 to 3.50 kg∙ha−1∙yr−1, NO3-N 0.12 kg∙ha−1∙yr−11 ranging from 0.01 to 0.33 kg∙ ha−1∙yr−1, OP 0.61 kg∙ha−1∙yr−1 ranging from 0.01 to 2.13 kg∙ha−1∙yr−1 and SRP 0.15 kg∙ha−1∙yr−1 ranging from 0.04 to 0.50 kg∙ha−1∙yr−1 in response to a daily 50 kg∙ha−1∙yr−1
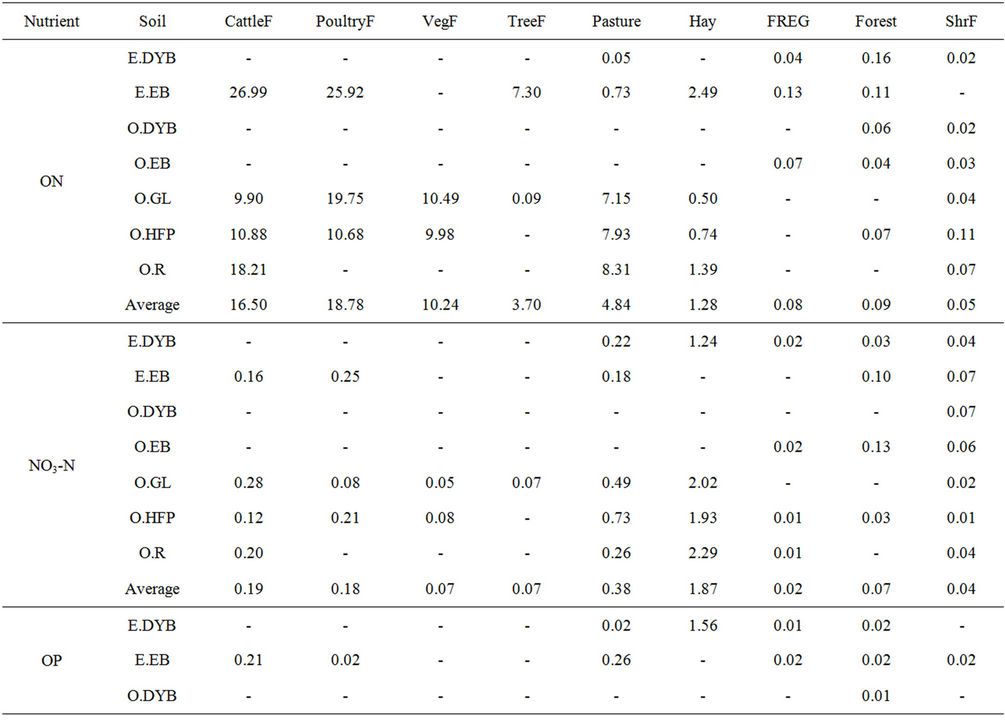
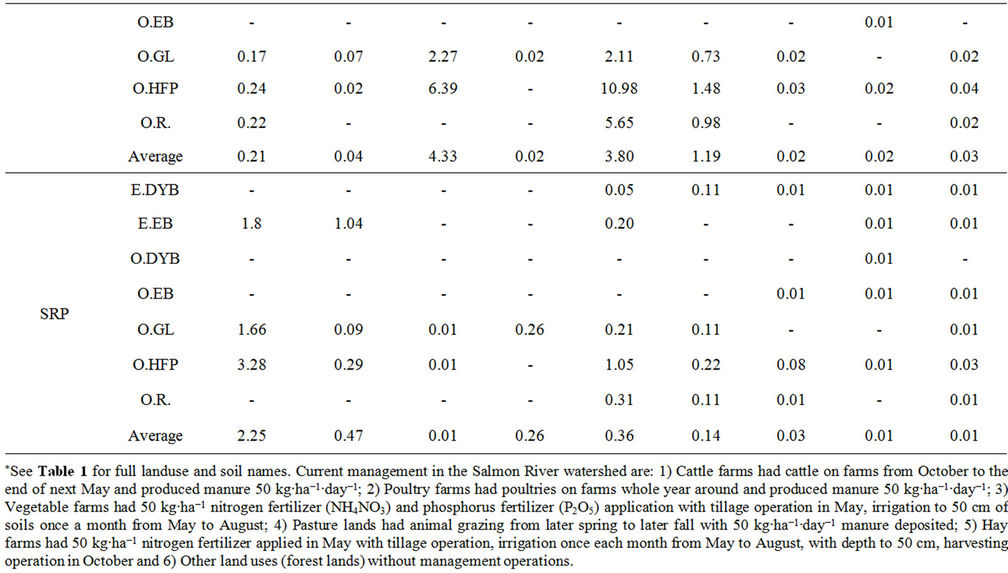
Table 4. Nutrient export rates (kg∙ha−1∙yr−1) from different site types (or HRUs) to the stream in the Salmon River watershed*.
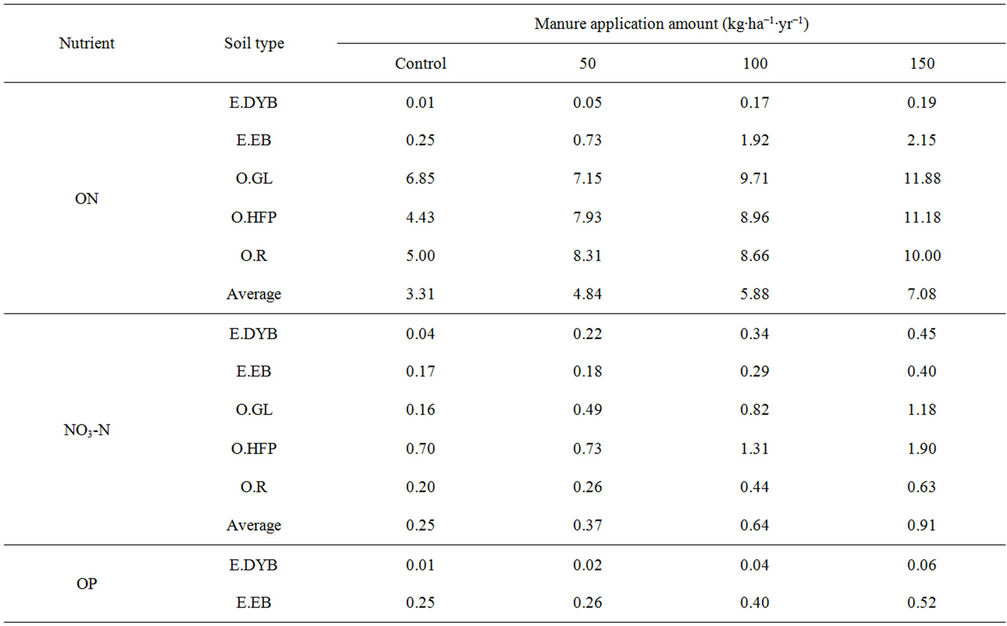
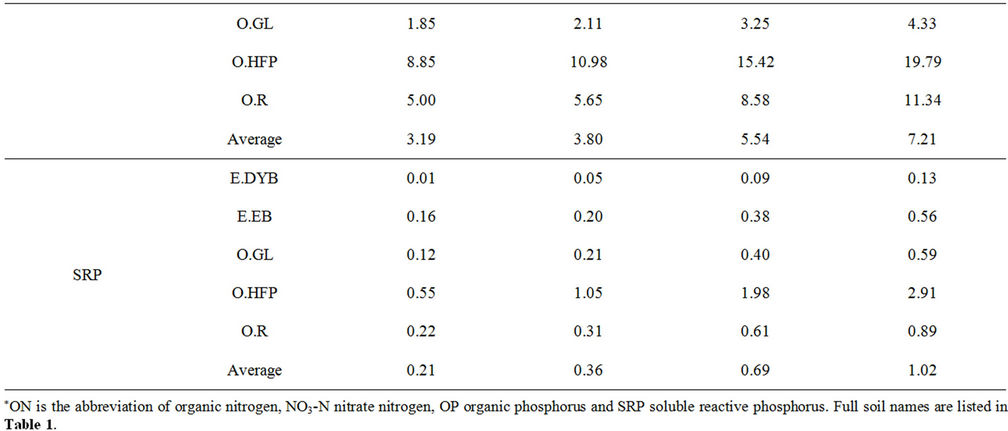
Table 5. The Rates of nitrogen and phosphorus export to the stream in response to the amounts of fresh manure deposition in pasture lands*.
of fresh manure deposition from grazing cows during grazing season from later spring to later fall. The mean annual ON export to the stream increases 2.57 kg∙ha−1∙ yr−1 ranging from 0.16 to 4.54 kg∙ha−1∙yr−1, NO3-N 0.39 kg∙ha−1∙yr−1 ranging from 0.12 to 0.66 kg∙ha−1∙yr−1, OP 2.35 kg∙ha−1∙yr−1 ranging from 0.03 to 6.57 kg∙ha−1∙yr−1 and SRP 0.48 kg∙ha−1∙yr−1 ranging from 0.08 to 1.44 kg∙ ha−1∙yr−1 in response to a daily 100 kg∙ha−1∙yr−1 of fresh manure deposition during grazing season. The mean annual ON export to the stream increases 3.77 kg∙ha−1∙yr−1 ranging from 0.18 to 6.76 kg∙ha−1∙yr−1, NO3-N 0.66 kg∙ ha−1∙yr−1 ranging from 0.23 to 1.20 kg∙ha−1∙yr−1, OP 4.02 kg∙ha−1∙yr−1 ranging from 0.05 to 10.94 kg∙ha−1∙yr−1 and SRP 0.80 kg∙ha−1∙yr−1 ranging from 0.12 to 2.36 kg∙ha−1 in response to a daily 150 kg∙ha−1 of fresh manure deposition during grazing season. Although the manure deposition on the pasture lands during grazing season increases stream N and P loading, it does not reach significant level.
3.4. Nitrogen and P Export Rates in Response to the Amounts of Fertilizer Application
The SWAT model predicted that the increasing fertilizer application in hay production lands can increase nutrient exports to the streams (Table 6). The mean annual ON export to the stream increases 1.20 kg∙ha−1∙yr−1 ranging from 0.46 to 2.38 kg∙ha−1∙yr−1 and NO3-N increases 1.83 kg∙ha−1∙yr−1 ranging from 1.17 to 2.25 kg∙ha−1∙yr−1 in response to a 50 kg∙ha−1 of N fertilizer application at the beginning of growing season in May. The mean annual ON export to the stream increases 1.57 kg∙ha−1∙yr−1 ranging from 0.51 to 2.74 kg∙ha−1∙yr−1 and NO3-N increases 4.02 kg∙ha−1∙yr−1 ranging from 2.73 to 4.68 kg∙ha−1∙yr−1 in response to a 100 kg∙ha−1 of N fertilizer application. The mean annual ON export to the stream increases 1.71 kg∙ha−1∙yr−1 ranging from 0.54 to 2.68 kg∙ha−1∙yr−1 and NO3-N increases 6.43 kg∙ha−1∙yr−1 ranging from 4.56 to 7.26 kg∙ha−1∙yr−1 in response to a 150 kg∙ha−1 of N fertilizer application. The N fertilizer application increases the stream NO3-N loading significantly at p < 0.01.
The mean annual OP export to the stream increases 1.09 kg∙ha−1∙yr−1 ranging from 0.68 to 1.53 kg∙ha−1∙yr−1 and SRP increases 0.12 kg∙ha−1∙yr−1 ranging from 0.01 to 0.18 kg∙ha−1∙yr−1 in response to a 50 kg∙ha−1∙yr−1 of P fertilizer application at the beginning of growing season in May. The mean annual OP export to the stream increases 1.18 kg∙ha−1∙yr−1 ranging from 0.60 to 1.53 kg∙ ha−1∙yr−1 and SRP increases 0.20 kg∙ha−1∙yr−1 ranging
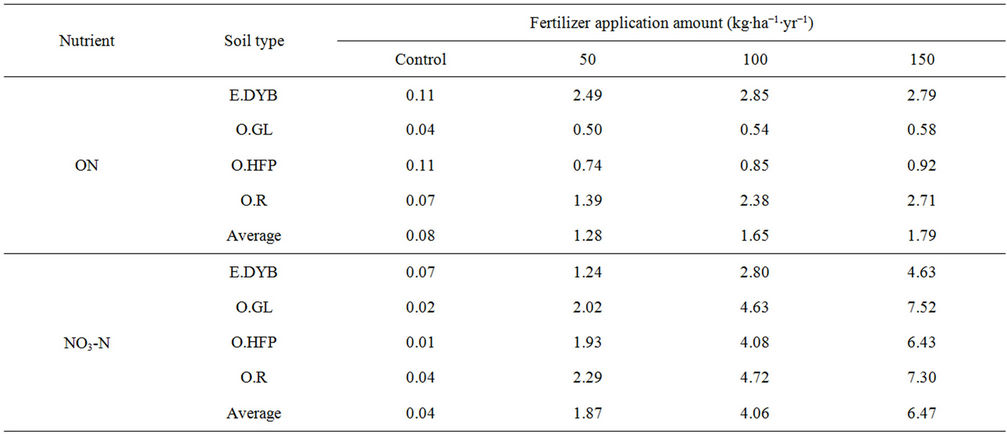
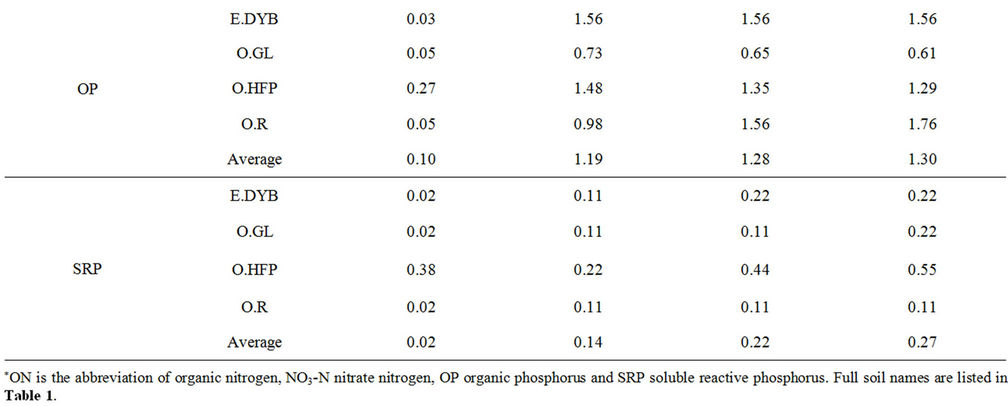
Table 6. The rates of nitrogen and phosphorus export to the stream in response to the amounts of fertilizer application in hay production lands.
from 0.09 to 0.40 kg∙ha−1∙yr−1 in response to a 100 kg∙ha−1 of P fertilizer application. The mean annual OP export to the stream increases 1.20 kg∙ha−1∙yr−1 ranging from 0.56 to 1.53 kg∙ha−1∙yr−1 and SRP increases 0.25 kg∙ ha−1∙yr−1 ranging from 0.09 to 0.51 kg∙ha−1∙yr−1 in response to a 150 kg∙ha−1 of P fertilizer application.
4. Discussions
4.1. Impacts of Current Landuse Changes on the Stream N and P Loadings
To analyze the impacts of current landsue changes on N and P exports to the stream in a watershed, it is needed to construct the base case of landuse, which is defined as the natural lands without human disturbances. The natural vegetation lands such as forest and shrub lands were treated as natural lands and their nutrient exports were treated as the base case in the Salmon River watershed. The differences of N and P exports between current landuse and base case were used to assess the impacts of current agriculture and animal farming on N and P exports to the streams. By converting current agriculture and animal farm lands into forest and shrub lands, the whole Salmon River watershed was covered by 82.57% of forests, 16.90% of low density forest and shrub and 0.53% of water for the base case according to Table 1. As a result, the entire Salmon River watershed exported approximately 11.52 t∙yr−1 of ON, 8.05 t∙yr−1 of NO3-N, 2.30 t∙yr−1 of OP and 1.36 t∙yr−1 of SRP annually in the base case, which were calculated based on Table 4. The current Salmon River watershed exports 64.82 t∙yr−1 of ON, 17.73 t∙yr−1 of NO3-N, 24.99 t∙yr−1 of OP and 7.59 t∙yr−1 of SRP. As a result, the current landuse changes through converting natural vegetation lands to agriculture and animal farms have increased about 53.30 t∙yr−1 of ON, 9.68 t∙yr−1 of NO3-N, 22.69 t∙yr−1 of OP and 6.23 t∙yr−1 of SRP exports to the streams in the Salmon River watershed based on Tables 1 and 4.
4.2. Uncertainties in This Study
This study used the SWAT model in 1) determining the rates of N and P export from the different site types or HRUs to the streams and 2) analyzing the stream nutrient loading in response to the landuse changes and the amounts of manure and fertilizer application in the Salmon River watershed after the model was calibrated and validated.
Although the SWAT model simulated stream flows and nutrient loadings well, there are still a number of uncertainties in this study. First, there is an uncertainty of the SWAT model landuse input file. The SWAT model was run from 1996 to 2006, so the detailed annual landuse information for this period should be taken into account. Unfortunately, only the detailed information of landuse for 1997 and 2003 exists for the Salmon River watershed. The average information of landuse in 1997 and 2003 was used as the annual landuse information for the study period from 1996 to 2006. Looking at the composition of landuse categories (Table 1 and Figure 1(b)), the natural forests cover the majority of the land in the Salmon River watershed. Therefore it can be assumed that the uncertainty from landuse information affected the accuracy of the SWAT model simulation, but not at a significant level.
Second, an uncertainty originates from the SWAT model’s routing procedure. The SWAT model divides a watershed into sub-watersheds and then into the HRUs [15]. Hydrology and nutrient cycling were separately simulated for each HRU. The water and associated nutrient transfers from surface runoff and lateral flow to the streams were directly routed from each HRU to the river’s reach and not through adjacent HRUs towards the reach. The movements and interactions of water and N and P between different HRUs were therefore not taken into account in the model. In many cases, some N and P exported from a HRU may be absorbed by another HRU when they transfer through them, especially in properly functioning buffer strips [23,24].
Third, the rates of N and P exports from fertilizer and manure applications are annual-based calculations, so that proper time management of fertilizer and manure applications may change the rates of N and P exports. For example, an application of fertilizer and manure during the flooding season would increase more nutrient exports to the streams [25]. Changes in nutrient exports are also subject to the changes of the weather conditions, especially to the precipitation in the watershed. An application of fertilizer or manure during the growing season may reduce nutrient exports because of nutrients uptake by plant growth. The amount of fertilizer and manure applied each time may also affect nutrient exports. The same amount of annul fertilizer application may produce a different nutrient export rate if it is applied many times during growing season.
5. Conclusions
The SWAT model was calibrated and validated, spatially using stream flow and N and P export data collected from four sites along the Salmon River from its headwaters at McInnis to the outlet at Highway 1 Bridge and temporally using monthly data from 1996 to 2006. The results of calibration and validation showed that the SWAT simulated the field measured stream flows, N and P loadings well.
The mean annual export rate of ON was 0.54 kg∙ha−1∙ yr−1, NO3-N 0.15 kg∙ha−1∙yr−1, OP 0.21 kg∙ha−1∙yr−1 and SRP 0.06 kg∙ha−1∙yr−1 for the whole Salmon River watershed. Poultry farms had the highest ON export rate while low density forest and shrub lands had the lowest according to the SWAT model predictions. The cattle farms had the second high ON export rate. The lands producing hay had the highest NO3-N export rate and the regenerated forest lands had the lowest. The vegetable lands exported the highest OP to the streams and the forested lands exported the lowest. The cattle farms exported the highest SRP to the streams and the forested lands exported the lowest.
The SWAT model predicted that manure deposition by grazing cows from spring to fall increases stream nutrient loadings. A daily 100 kg∙ha−1 of fresh manure deposition during grazing season increases 2.57 kg∙ha−1∙yr−1 of ON, 0.39 kg∙ha−1∙yr−1 of NO3-N, 2.35 kg∙ha−1∙yr−1 of OP and 0.48 kg∙ha−1∙yr−1 of SRP exports to the stream. A 100 kg ha-1 nitrogen fertilizer (NH4NO3) applied at the beginning of forage growth season increases 4.02 kg∙ha−1∙yr−1 of NO3-N and 1.57 kg∙ha−1∙yr−1 of ON exports to the stream. As well, a 100 kg∙ha−1 of phosphorus fertilizer (P2O5) application increases 1.18 kg∙ha−1∙yr−1 of OP and 0.20 kg∙ha−1∙yr−1 of SPR exports to the stream.
The current landuse changes have increased 53.30 t∙yr−1 of ON, 9.68 t∙yr−1 of NO3-N, 22.69 t∙yr−1 of OP and 6.23 t∙yr−1 of SRP export to the streams in the entire Salmon River watershed.
6. Acknowledgements
The authors would like to thank Agriculture and AgriFood Canada (AAFC)’s Greencover Canada for funding the project of the Watershed Evaluation of Beneficial Management Practices (WEBs) at the Salmon River watershed to AM, to Environment Canada for providing climate and stream flow data and to Environment Canada and BC Ministry of Environment for the water quality data. Thanks to Natural Resource Canada for providing GIS files (digital elevation, landuse, and stream network) and AAFC for soil information. We also thank Mrs Jocelyn Gile for English edition.
REFERENCES
- K. C. Abbaspour, J. Yang, I. Maximov, K. B. Siber, J. Mieleitner, J. Zobrist and R. Srinivasan, “Modelling Hydrology and Water Quality in the Pre-Alpine/Alpine Thur Watershed Using SWAT,” Journal of Hydrology, Vol. 333, No. 2-4, 2007, pp. 413-430. doi:10.1016/j.jhydrol.2006.09.014
- E. W. Boyer, C. L. Goodale, N. A. Jaworski and R. W. Howarth, “Anthropogenic Nitrogen Sources and Relationships to Riverine Nitrogen Export in Northeastern USA,” Biogeochemistry, Vol. 57-58, No. 1, 2002, pp. 137-169. doi:10.1023/A:1015709302073
- J. E. Schoonover and B. G. Lockaby, “Land Cover Impacts on Stream Nutrients and Fecal Coliform in the Lower Piedmont of West Georgia,” Journal of Hydrology, Vol. 331, No. 3-4, 2006, pp. 371-382. doi:10.1016/j.jhydrol.2006.05.031
- V. Smil, “Nitrogen in Crop Production: An Account of Global Flows,” Global Biogeochemical Cycles, Vol. 13, No. 2, 1999, pp. 647-662. doi:10.1029/1999GB900015
- S. R. Carpenter, N. F. Caraco, D. L. Correll, R. W. Howarth, A. N. Sharpley and V. H. Smith, “Nonpoint Pollution of Surface Waters with P and Nitrogen,” Ecological Applications, Vol. 8, No. 3, 1998, pp. 559-568. doi:10.1890/1051-0761(1998)008[0559:NPOSWW]2.0.CO;2
- R. W. Howarth, G. Billen, D. Swaeny, A. Townsend, N. Jaworski, K. Lajtha, J. A. Downing, R. Elmgern, N. Caraco, T. Jordan, F. Berendse, J. Freney, V. Kudeyarov, P. Murdoch and Z. Zaho-Lina, “Regional Nitrogen Budgets and Riverine N & P Fluxes for the Drainages to the North Atlantic Ocean: Nature and Human Influences,” Biogeochemistry, Vol. 35, No. 1, 1996, pp. 75-139. doi:10.1007/BF02179825
- Z. Zhu, K, Broersma and A. Mazumder, “Model Assessment of Cattle and Climate Change Impacts on Stream Fecal Coliform Pollution in the Salmon River Watershed, British Columbia, Canada,” Water, Air, & Soil Pollution, Vol. 215, No. 1-4, 2011, pp. 155-176. doi:10.1007/s11270-010-0467-0
- L. Fewtrell, “Drinking-Water Nitrate, Methemoglobinemia, and Global Burden of Disease: A Discussion,” Environmental Health Perspectives, Vol. 112, No. 9, 2004, pp. 1371-1374.
- D. W. Schindler, “The Cumulative Effects of Climate Warming and Other Human Stresses on Canadian Freshwaters in the New Millennium,” Canadian Journal of Fisheries and Aquatic Sciences, Vol. 58, No. 1, 2001, pp. 18-29. doi:10.1139/f00-179
- U. Larsson, R. Elmgren and F. Wulff, “Eutro-Phication and the Baltic Sea: Causes and Consequences,” Ambio, Vol. 14, No. 1, 1985, pp. 9-14.
- J. Meidinger and J. Pojar, “Ecosystems of British Columbia, Special Report Series 6,” BC Ministry of Forests PO BOX 9049 STN, Victoria, BC, Canada V8W 9E2, 1991.
- K. S. Bracmort, M. Arabi, J. R. Frankenberger, B. A. Engel and J. G. Arnold, “Modeling Long-Term Water Quality Impacts of Structural BMPs,” Transactions of the ASABE, Vol. 42, No. 2, 2006, pp. 367-374.
- Environment Canada, BC Ministry of Environment and Yukon Department of Environment, “British Columbia and Yukon Territory Water Quality Report (2001-2004), an Application of the Canadian Water Quality Index,” Environment Canada, 10 Wellington, Gatineau, QC, Canada K1A 0H3, 2007.
- S. Gwanikar, S. Cross, D. MacDonald, J. R. Brown, D. Q. Tao and T. Berger, “Salmon River: Water Quality Assessment and Recommended Objectives, Technical Appendix-Volume I, Prepared for Environment Canada,” Aquametrix Research Ltd., 204-2527 Beacon Avenue, Sidney, BC, Canada V8L 1Y1, 1998.
- S. L. Neitsch, J. G. Arnold, J. R. Kiniry, R. Srinivasan and J. R. Williams, “Soil and Water Assessment Tool User’s Manual,” Grassland, Soil & Water Research Laboratory, Temple, Texas, GSWRL Report 02-02, 2002.
- Agriculture and Agri-Food Canada, “Canadian System of Soil Classification,” Third Edition, NRC Research Press, 1200 Montreal Rd, Bldg M-55, Ottawa, ON, Canada K1A 0R6, 1998.
- N. Kannan, S. M. White and M. J. Whelan, “Predicting Diffuse-Source Transfers of Surfactants to Surface Water Using SWAT,” Chemosphere, Vol. 66, No. 7, 2007, pp. 1336-1345. doi:10.1016/j.chemosphere.2006.07.005
- M. B. Beck, “Water Quality Modelling: A Review of the Analysis of Uncertainty,” Water Resources Research, Vol. 23, No. 8, 1987, pp. 1393-1442. doi:10.1029/WR023i008p01393
- V. Klemeš, “Operational Testing of Hydrological Simulation Models,” Hydrological Sciences Journal, Vol. 31, No. 1, 1986, pp. 13-24. doi:10.1080/02626668609491024
- J. E. Nash and J. V. Sutcliffe, “River Flow Forezcasting through Conceptual Models Part I—A Discussion of Principles,” Journal of Hydrology, Vol. 10, No. 4, 1970, pp. 282-290. doi:10.1016/0022-1694(70)90255-6
- B. Grizzetti, F. Bouraoui, K. Granlund, S. Rekolainen and G. Bidoglio, “Modelling Diffuse Emission and Retention of Nutrients in the Van-taanjoki Watershed (Finland) Using the SWAT Model,” Ecological Modelling, Vol. 169, No., 2003, pp. 25-38.
- T. Meixner, C. Gutmann, R. Bales, A. Ley-decker, J. Sickman, J. Melack and J. McConnell, “Multidecadal Hydrological Response of a Sierra Nevada Watershed: Sensitivity to Weathering Rate and Change in Deposition,” Journal of Hydrology, Vol. 285, No. 1-4, 2004, pp. 272-285. doi:10.1016/j.jhydrol.2003.09.005
- R. Lowrance and J. M. Sheridan, “Surface Runoff Water Quality in a Managed Three Zone Riparian Buffer,” Journal of Environmental Quality, Vol. 34, No. 5, 2005, pp. 1851-1859. doi:10.2134/jeq2004.0291
- A. Bedard-Haughn, K. W. Tate and C. van Kessel, “Using Nitrogen-15 to Quantify Vegetation Buffer Effectiveness for Sequestering Nitrogen in Runoff,” Journal of Environmental Quality, Vol. 33, No. 6, 2004, pp. 2252- 2262. doi:10.2134/jeq2004.2252
- D. B. Jaynes, T. S. Colvin, D. L. Karlen, C. A. Cambardella and D. W. Meek, “Nitrate Loss in Subsurface Drainage as Affected by Nitrogen Fertilizer Rate,” Journal of Environmental Quality, Vol. 30, No. 4, 2001, pp. 1305-1314. doi:10.2134/jeq2001.3041305x
NOTES
*Corresponding author.