Journal of Environmental Protection
Vol. 3 No. 2 (2012) , Article ID: 17441 , 14 pages DOI:10.4236/jep.2012.32019
Sequential Remediation Processes for a Low Level Pesticide Wastewater
![]()
Department of Process Engineering and Applied Sciences, Faculty of Engineering, Dalhousie University, Halifax, Canada.
Email: abdel.ghaly@dal.ca
Received December 12th, 2011; revised January 16th, 2012; accepted February 6th, 2012
Keywords: Pesticide; Captan; Soybeans; Hay; Absorption; Immobilization; Degradation; Composting
ABSTRACT
The aim of this study was to develop a remediation system for the treatment of a low-level pesticide wastewater that uses available onfarm organic matter as an absorption media, is capable of reducing the concentration of the pesticide to a safe level and is economically viable for implementation by farmers. The absorption capacity of chopped hay and soybean to the fungicide captan was evaluated under batch conditions and the effectiveness of the composting process in depredating captan in contaminated organic materials was evaluated. The results showed that both hay and soybean plant residues were very effective in absorbing 99.2% and 98.5% of captan form the wastewater after 4 hours, respectively. Because of its availability, hay can be used in an onfarm pesticide immobilization system that consists of shallow reinforced concrete pit (filled with hay) with steel bars across the top for machinery to roll onto and be washed. The wastewater can be retained for 24 hours which is a sufficient time for hay to absorb the captan. The contaminated hay can then be composted. The addition of used cooking oil raised the temperature of the composting mixture to 63˚C. Small reductions in moisture content (from 60% to 58.9%) and C:N ratio (from 30:1 to 28:1) were observed while reductions of 18.92%, 15.56% and 4.8% in the volatile solids, total carbon total Kjeldahl nitrogen were achieved after 10 d of composting, respectively. About 92.4% of the captan was degraded in the first 4 days of composting. Most of captan (92.4%) was degraded during the mesophilic stage (first 3 days). The degradation rate constant for the mesophilic stage (0.724 d–1) was 2.74 times the degradation rate constant for the thermophilic stage (0.264 d–1). An onfarm windrow composting process would be very effective in degrading captan contaminated hay. The captan contaminated hay could be mixed with equal amount poultry manure or dairy manure to provide the required bioavailable carbon and nutrients for the composting process. Some used cooking oil could also be added to maintain higher temperature within the compost matrix. The windrows should be mixed on a daily basis to provide sufficient oxygen for the composting microorganisms.
1. Introduction
Pesticides provide the primary means for controlling organisms/pests (fungi, bacteria, insects and weeds) that compete with man for food and fibre or cause injury to man, livestock and crops. They are classified based on the pest they control as shown in Table 1. Their use has dramatically increased since the second world war [1]. Pesticides played a vital role in increasing agricultural production and permitting the economic production of wide ranges of vegetable, fruit, cereal, forage, fibre and oil crops which now constitute a large part of a successful agricultural industry in many countries. They lower crop losses and cost of production per unit output and increase revenue to farmers because of the additional marketable yield obtained with their use. Other benefits include: 1) reduced uncertainty of crop loss from pests, 2) increased profit to farm input suppliers (machinery, fertilizer, chemicals and seed companies) from increased sale, 3) benefit to consumers through decreased price of raw foods or improved quality of food products and 4) benefit to society as whole (farmers, consumers, farm suppliers, food processors) from increased employment opportunities and expanded export of food products [2,3]. As such, society attempts to put a monetary value on these benefits through benefit/cost analysis. Pesticide expenditures account for 13% - 22% of total costs of production per hector. The benefit/cost ratio vary from 4 to 33 (for every dollar spent on pesticide farmers receive an additional of $4 - $33 in revenue) depending upon crop rotation and year [1,4].
Canada account only for 2% of the pesticide use and the pesticide manufacturing industry in Canada is comprised of 39 companies employing 745 people [5]. How-
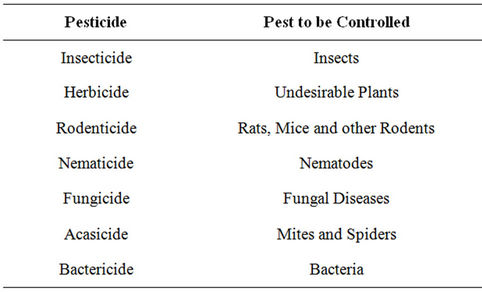
Table 1. Common types of pesticide.
ever, the extent to which pesticides are used in Canada is indicated by the fact that over 36 million kg of pesticideactive ingredients were used in 2006. This is equivalent to an average application of 0.54 kg/ha of farmland [5,6]. The total sales of these pesticides amounted to $78,054,000, or approximately $2.47 for every person in Canada in 2006 [5,7].
After pesticides are applied to target areas, pesticide residues remain in the containers and application equipment. These residues are removed from applicators by rinsing with water which results in the formation of a low level toxic wastewater. The disposal of pesticidecontaining wastewater represents a problem for many farmers [8]. Currently, disposal of pesticide wastewater is carried out haphazardly by several methods (Table 2). These include: 1) land cultivation, 2) dumping on land, in ditches, in lagoons and in soil pits, and in extreme cases in sewers and streams near the rinsing operation, 3) use of evaporation pond and 3) land filling. These methods of disposal are totally unsafe, as the surface run off will reach streams, rivers and lakes and the infiltration of the wastewater into the localsoil will eventually end up in the ground water.
Pesticides are toxic chemicals that can adversely affect people, pets, livestock, wildlife and desirable plants in addition to the pests they are intended to destroy [9-11]. The resulting ecological impact of unsafe disposal of pesticides can be severe, depending on the type of pesticide and the amount contained in the wastewater. The phenomenon of biomagnification of some pesticides has resulted in reproductive failure of some fish species [12, 13] and egg shell thinning of birds such as peregrine falcons, sparrow hawk and eagle owls [14]. Pesticide toxicity to humans include skin and eye irritation and skin cancer [15]. Therefore, great care must be exercised in the application and disposal of pesticides.
Table 3 summarizes the treatment methods currently used for pesticide containing wastewater. These include incineration, chemical treatment, physical treatment and biological treatment. These treatment methods either require land or are expensive and suffer from variability of effectiveness [16]. Thus, the development of safe, on farm disposal techniques for agricultural pesticides is necessary.
2. Objectives
The aim of this study was to design and evaluate a remediation system for the treatment of low-level pesticide wastewater. The system must 1) use available onfarm organic matter as an absorption media, 2) be capable of reducing the concentration of the pesticide to a safe level, 3) readily adaptable to on-farm use and 4) economically viable for implementation by farmers. The specific objectives of the study were: 1) to determine the pesticide absorption capacity of chopped hay and soybean plant residue to the fungicide captan under batch conditions and 2) to evaluate the effectiveness of the composting process in the degradation of captan contaminated organic materials.
3. Experimental Materials
3.1. Pesticide
The fungicide captan 80-WP (C9H8ClNO2S) was chosen for this experiment because it is one of the most heavily used pesticide in the province of Nova Scotia. The properties and structure of captan are shown in Table 4 [17,18]. Captan 80-WP is classified as a protectant eradicant fungicide and is one of the most used pesticides today due to its effectiveness in combating wide variety of fungal diseases (Table 5). The formulation of this pesticide is a microfine wettable powder containing 80% active ingredient (75.7% N-[trichloromethyl) thio]-4-cyclohexene- 1,2-dicarboaimide and 4.3% related derivatives). The balance (20%) is made of mineral dust and wetters dispersants. This formulation is preferred by many growers since it minimizes visible residue and thus provides an excellent fruit finish.
3.2. Organic Materials
The two organic materials chosen as absorption media were: 1) common hay (Timothy Grass) and 2) soybeans plant residues. Tow bales of these organic materials were obtained from a commercial farm in Annapolis Vally, Nova Scotia and were chopped in the laboratory using the chopping system (Figure 1) developed by Ghaly et al. [19]. Each bale was placed in the revolving chute of the machine and the speed and depth of cut were adjusted to 800 rpm and 39 mm, respectively. The machine delivered 1.5 kg/minute of chopped material. The average length of the chopped materials ranged from 10 to 50 mm. Some characteristics of hay residues are shown in Table 6.
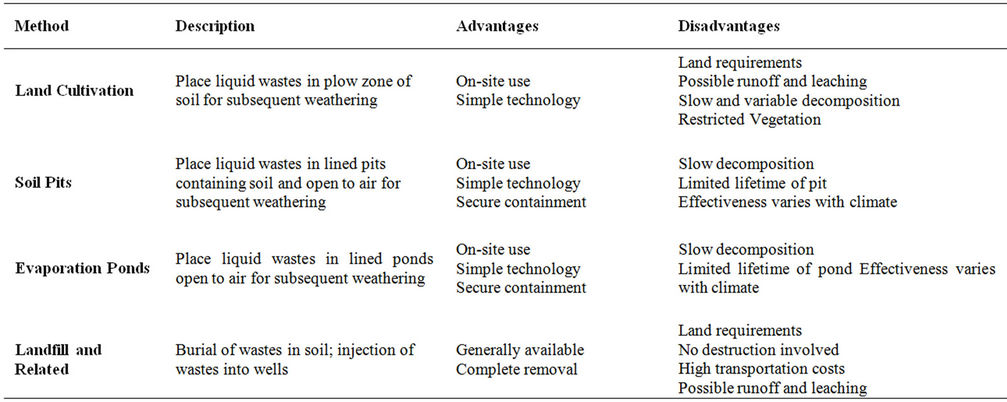
Table 2. Disposal methods of pesticide containing wastewater.
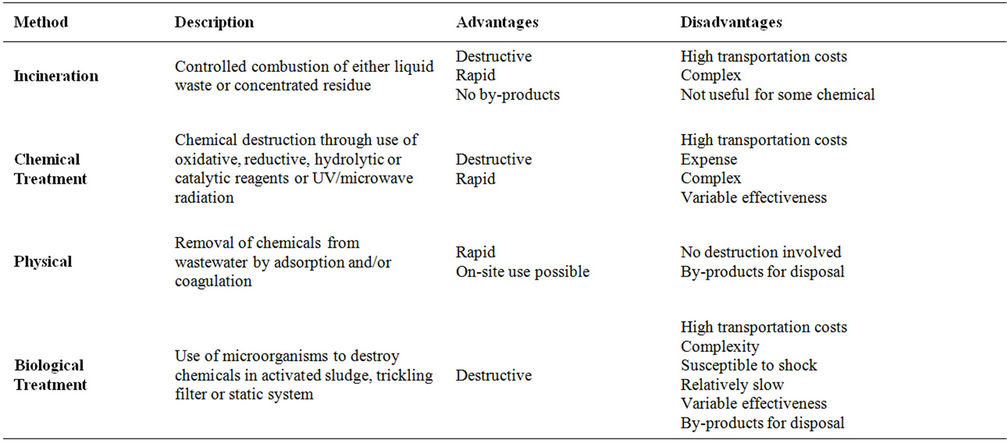
Table 3. Current treatment methods of pesticide containing wastewater.
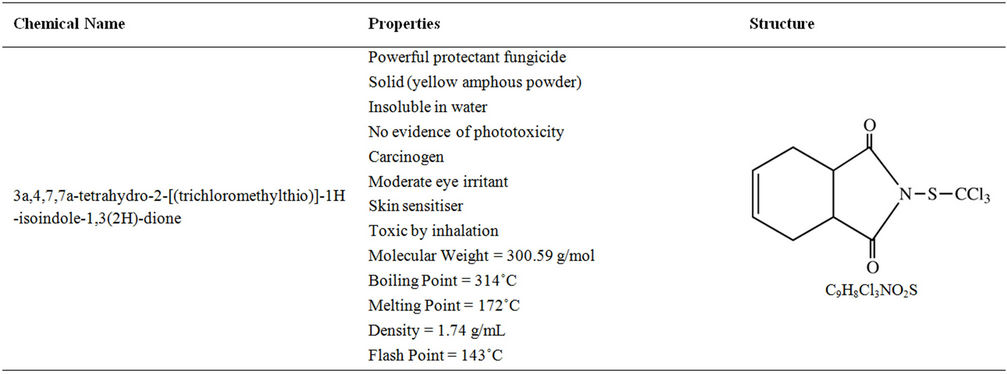
Table 4. Chemical formula and structure for captan [17,18].
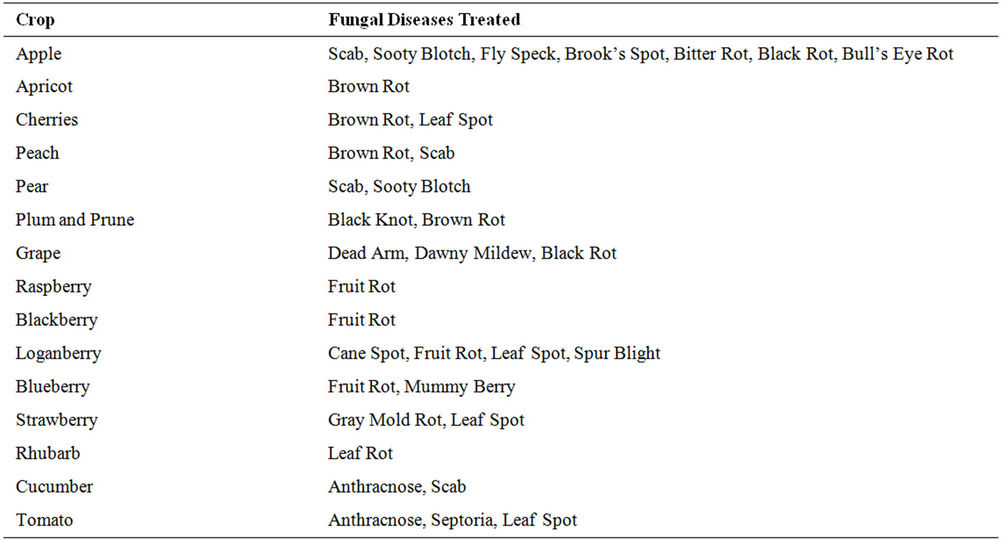
Table 5. Crops and fungal diseases registered for captan 80-WP.
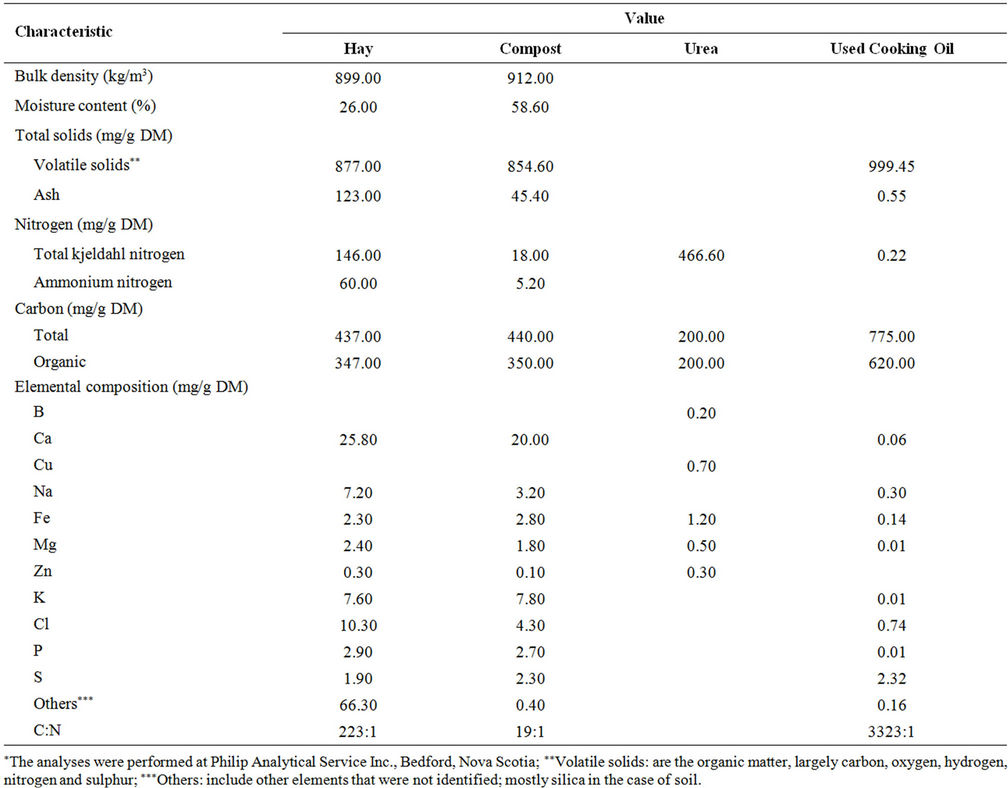
Table 6. Some characteristics* of materials used in this study.
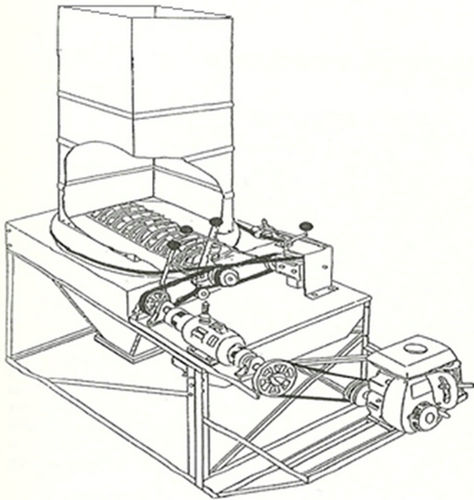
Figure 1. The chopping system.
3.3. Compost
A 15-day old municipal solid waste compost was obtained from a composting facility operated by Miller Composting Corporation, Dartmouth, Nova Scotia. Some characteristics of the compost are shown in Table 6.
3.4. Urea
Urea [CO(NH2)2] was purchased from Halifax Seed Company in Halifax, Nova Scotia. It was added as a nitrogen source to adjust the C:N ratio to 30:1. The choice of urea was based on the work by Ghaly et al. [20] which indicated that urea was an effective nitrogen source for microbial activity. Some characteristics of the urea are shown in Table 6.
3.5. Used Cooking Oil
The used cooking oil was obtained from a local restaurant in Halifax, Nova Scotia. Some characteristics of the oil are shown in Table 6.
4. Experimental Apparatus
4.1. Immobilization System
The pesticide immobilization system (Figure 2) consisted of pesticide contaminated wastewater feeding system, 3 reactors and 3 effluent collection tanks.
The wastewater feeding system consisted of storage tank and a distribution manifold with a set of four values. A l00 L plastic container was used to store the wastewater. It was fitted with a stirring paddle driven by a 1/12 HP electric motor (Model 5SCP10FG17AX, General Electric, Mississauga, Ontario) mounted on the tank cover. A feeding and ventilation ports were provided on the tank cover. A 5 cm diameter plastic fitting was threaded into the side of the tank close to the bottom and used as an outlet port. A 5 cm ball valve was connected to the fitting from one side and to the manifold from the other side. The three valves on the manifold controlled the flow into the reactors.
Each reactor was made of 1 cm thick Plexiglas cylinder of 20 cm inside diameter and 100 cm length. A circular plate of 22 cm diameter and 1 cm thickness was glued to the bottom of the cylinder. A 2.5 cm diameter plastic fitting was threaded into the center of the circular plate and used as the outlet. A 2.5 cm ball valve was connected to the fitting. A 20 cm diameter fine screen was glued onto the inside of the circular plate to avoid losing the chopped material through the outlet.
The cover was also made of a Plexiglas circular plate of 22 cm diameter and 1 cm thickness. A 2.5 cm diameter plastic fitting was threaded into the center of the circular plate and used as the inlet. The cover plate was fixed to the top collar of the cylinder using 6 blots with wing nuts. An O-ring was used under the cover plate to provide a good seal.
Three 25 L plastic Carboys (Cat. No. 02-961B fisher scientific, Montreal, Quebec) were used to collect the effluent from the reactors.
4.2. Composting System
The composting system (Figure 3) consisted of a bioreactor, a mixing unit, an aeration unit and a temperature measurement unit. The bioreactor was made of 6.4 mm thick stainless steel vessel. The sides of the vessel measured 340 × 280 mm and had a radius of 150 mm at the lower end. The top of the vessel (340 × 800 mm) was held in place by four hinges from the back side which allowed for its closing and opening. Four locking clamps were provided on the front side to ensure adequate sealing and easy locking of the top cover when the bioreactor was in operation. A rubber gasket lining was used to prevent air leakage from the bioreactor during the process. The top cover and walls of the bioreactor were insulated with 25.4 mm thick Styrofoam layer. There were three holes at the bottom of the vessel, connected to a manifold by 6.4 mm diameter rubber tubing and used for aeration. The top cover had three 60 mm holes used as sampling ports and covered during the process with rubber stoppers.
Inside the vessel, a 6.4 mm diameter solid stainless steel shaft was mounted on two bearings. There were five stainless steel collars on the shaft in which five bolts (101.6 mm long and 6.4 mm in diameter) were mounted.
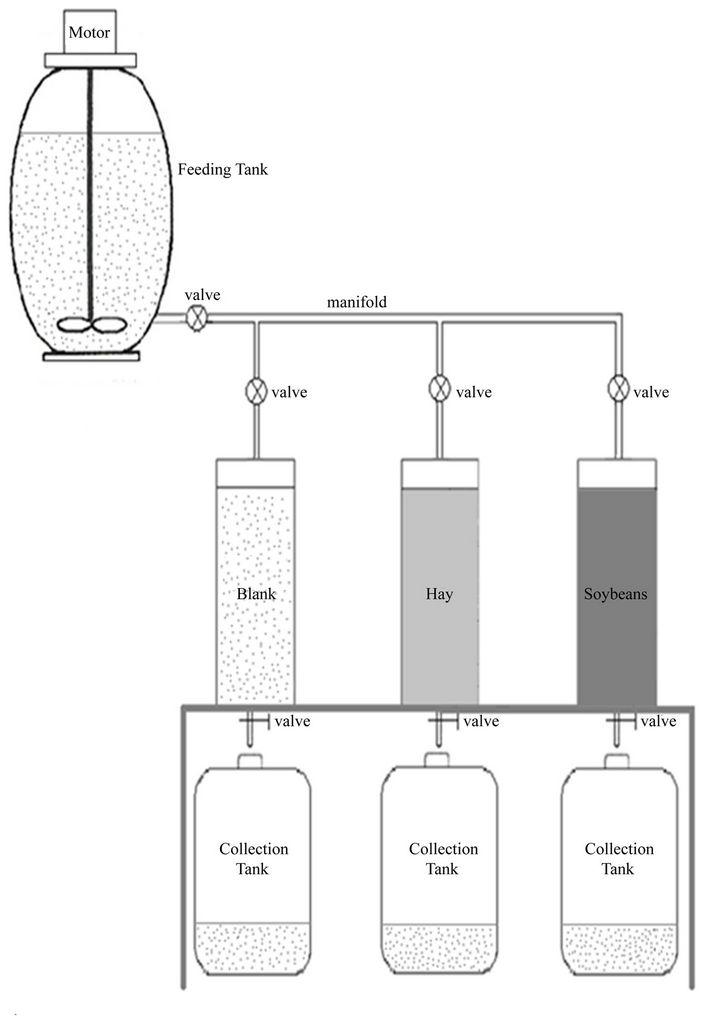
Figure 2. The chopping system.
The shaft was rotated by a permanent magnet variable speed (0 - 250 rpm) 3/4 hp electric motor (Model No. 22846, Dayton Electric MFG Co., Chicago, Illinois) directly connected to a gearbox of a 30:1 gear reduction ratio. A speed controller controlled the speed of the motor.
The air was supplied to the vessel by a 3/4 hp compressor (Model No. LGH-210-HO2, Pneumotive, Louisiana) with the airflow regulated at 2.5 L/min. The supply air was passed through a 4.38 L Plexiglas canister that was filled with a hydroscopic silica gel which allowed the air to be completely dry. The dried air was then passed through a flow meter before enteringthe vessel. The condensate from the saturated exhaust gas was collected in a 0.63 L Plexiglas water trapper. The outlet exhaust gas was then dried in another 4.38 L Plexiglas canister that was filled with hydroscopic silica gel before it was exhausted through rubber tubing into the laboratory fume hood. Two rubber septums were located on the air inlet and exhaust outlet lines to provide for gas sampling.
Temperature measurements were taken using nine
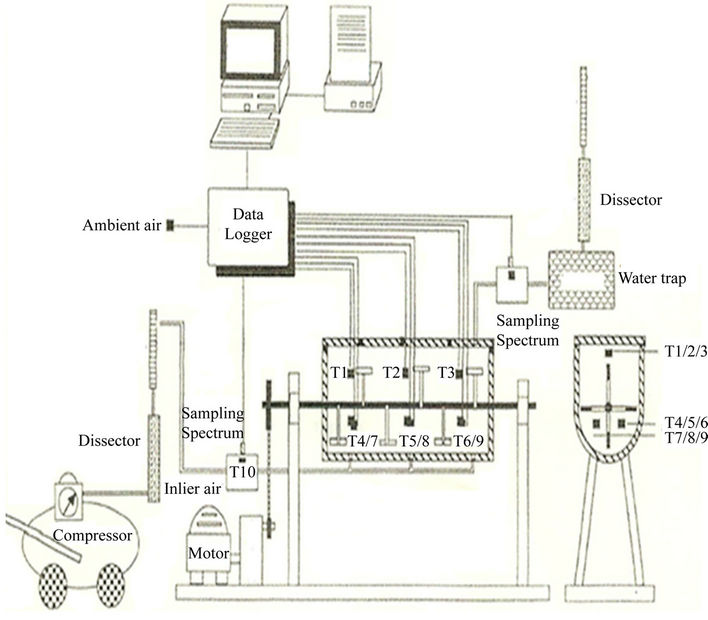
Figure 3. Bioremediation system.
thermocouples and data logger. The data were continuously recorded in the computer.
5. Experimental Procedure
5.1. Immobilization Experiment
This experiment was carried out to determine the absorption capacity of two organic materials (chopped Timothy grass and soybeans plant residues) to captan 80-WP under batch operating conditions. The initial concentration of the captan in water was 125 mg/l. This concentration was 0.1 of the recommended dosage of 1.25 kg per 1000 litres for most crops. A blank test (containing only captan in water solution) was carried out in order to test the stability of the fungicide. The first reactor was filled with well-packed chopped Timothy grass (≈28 kg), the second reactor was filled with well packed soybeans plant residue (≈28 kg) and the third reactor was used as a blank. The captan (12.5 g) was added into 100 L of water in the feeding tank and stirred vigorously for 5 minutes. The valve connecting the feeding tank to the manifold was turned on. The other 3 valves on the manifold were turned on till all the three reactors were filled with the wastewater. A 500 ml sample was taken from each reactor at 2, 4, 8, 12, 16 and 24 hours from the bottom of each reactor. The samples were immediately stored in the dark at 4˚C to avoid pesticide degradation till analyzed.
5.2. Composting Experiment
This experiment was carried out to evaluate the effectiveness of composting in degrading captan in the contaminated organic material. About 6.0 kg of municipal solid waste compost (used as a source of microbes and bioavailable carbon), one liter of phosphate buffer solution (as nutrient and pH control), the desired amounts of urea (as a source of nitrogen) and water were added to a large bucket containing 20 kg of the pesticide contaminated material. The contents were mixed thoroughly and the moisture content and C:N were adjusted to 70% and 30:1, respectively. About 25 kg of the mixture were placed into the bioreactor. Two trials were carried out, one with used cooking oil and one without. In the trial with oil, about 100 mL of used cooking oil were added every 12 h in order to compensate for heat losses and maintain the reactor temperature above 55˚C as recommended by Ghaly et al. [20]. The temperature was monitored continuously and samples were collected on a daily basis for moisture content, TKN, NH4-N, solids, total carbon and captan analyses.
6. Experimental Analyses
6.1. Analysis of Captan in Wastewater
The 500 ml pesticide samples were gravity-filtered into 1 L glass bottles. The samples were stirred on the magnetic stirrer (PC-620, Corning, New York, New York) and 50 g of sodium sulphate and 10 ml of benzene were added. The bottles were tightly capped. After stirring for 45 minutes, each sample was poured into 500 ml separation funnels and the organic phase was allowed to come to the top. The aqueous component was removed and the organic phase was collected in 25 ml centrifugal tubes and centrifuged for 5 minutes at 2000 rpm (Model No. 7500284, Thermo Scientific, Asheville, North Carolina). The upper organic phase was collected from the tubes into 10 ml centrifugal tubes. A small amount of sodium sulphate was added to the original samples in the 25 ml centrifugal tubes. These samples were centrifuged again and the organic phase collected. This was continued until the maximum amount of the organic phase had been extracted from the sample. 0.5 ml of the toluene was added to the samples and the tubes were then placed in a 60˚C water bath (Series 280 Precision, North York, Ontario). A gentle stream of nitrogen gas was used to concentrate the samples to 0.4 ml.
The samples were analysed using a gas chromatograph (GC Model No. 5890-SII, Howlett Packard, Atlanta, Georgia). The GC was calibrated by injecting 1 μl of standard captan calibration solution of known concentrations (15, 20, 25 and 30 mg/ml) onto the column. Identification of pesticide was based on GC retention time. Nitrogen gas was used as carrier at a flow and pressure rate of 80 ml/min and 220 kPa, respectively. The temperature of the injection port, column and detector were 275˚C, 350˚C and 275˚C, respectively. 0.1 ml of the concentrated sample was put in a 10 ml volumetric flask andmade up to volume. The amount injected into the GC was 1 μl for all samples.
6.2. Analyses of Compost Material
Approximately 150 gram samples were taken from the composting system every day for moisture content, TKN, NH4-N, total carbon, solids and pesticide analysis.
The moisture content was performed on the samples using oven drying methods following the ASTM D3173- 73 procedure [21]. Each sample (5 grams) was weighted using a Metller AE 200 Balance (Model No. PM 4600, Mettler Instruments AG, Greifensee, Switzerland) and the weight was recorded to the nearest 0.0001 gram. The samples were oven dried at 105˚C for 24 h in an air forced drying oven (Isotemp Oven, Model No. 655F, Fisher Scientific, Toronto, Ontario) and total solids and moisture content were determined The fixed solids were determined by burning the dried sample in a muffle furnace (Isotemp oven, Model No. 186A, Fisher Scientific, Toronto, Ontario) at 550˚C for 20 minutes and weighing the ash.
Both the Total Kjeldahl Nitrogen (TKN) and ammonium nitrogen (NH4-N) were determined using a Kjeltech Auto Analyzer (Model 1030, Part No. 1000 1773, Serial No. 2000, Tecator AB Hoganas, Sweden). One gram of the material was diluted with 20 ml distilled water for NH4-N analyses. For TKN analyses, one gram of the material was digested with 4 ml of concentrated sulphuric acid (H2SO4) for 25 minutes under a vacuumed ventilator. The analyte was then automatically titrated by the analyzer.
The total carbon analyses were determined at the Materials Engineering Center (MEC) of Dalhousie University using a Leco carbon analyzer (Model 516-000. Leco Corporation. St. Joseph, Michigan).
The captan residue in the contaminated compost mixture was determined using the GC. Approximately 10 g of compost mixture was transferred into a volumetric flask. Benzene (100 ml) was added to the flask and the mixture was shaken 15 times and then votexed for 60 seconds. The solution was then kept for 4 hours to allow for complete dissolution of captan. The solvent layer was then extracted and injected into the GC as described previously.
7. Results and Discussion
7.1. Absorption of Captan to Organic Materials
After injecting 1 μl of blank into the GC, the organic solvent peak appeared first followed by the captan peak as shown in Figure 4. The retention time for captan was 4.5 minutes. The concentration of captan in the effluent obtained from the blank, soybeans residue and hay columns are shown in Figure 5. A linear decrease in the amount of captan in the blank was observed. The amount of captan decreased from 125 to 113.6 mg/l after 24 h. The soybean plant residue and the hay were both very effective in removing the captan within the first 4 hours. The concentration of captan was decreased to 1.0 and 2.2 mg/l after 4 hours resulting in a removal efficiency of 99.2% and 98.2% for the soybean and hay, respectively. The final concentrations of captan in the effluent obtained from hay and soybean column after 24 hours were 1.4 and 0.2 mg/l, respectively.
Because of its availability on most farms, hay would be ideal for use in an onfarm pesticide immobilization system. Such a system would essentially consist of a shallow (10 m length × 4 m width × 1 m depth) reinforced concrete pit (filled with hay) with steel bars across the top for machinery to roll onto and be washed off. A drain tile should be installed at the bottom with accessible riser for the removal of decontaminated water. The wastewater collected from washing the machine will percolate through the hay and can be contained for the required retention time (4 hours) before it is allowed to
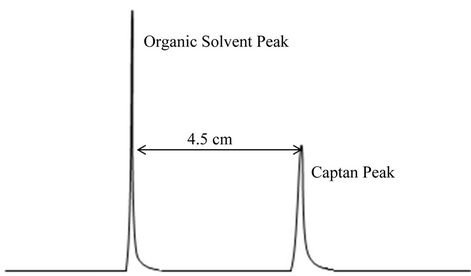
Figure 4. Typical captan peak illustrating retention time.
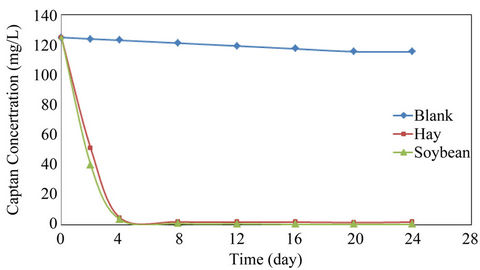
Figure 5. Pesticide concentration.
drain off. The contaminated organic media would then be composted to degrade the immobilized captan in the organic material.
7.2. Composting Temperature Profile
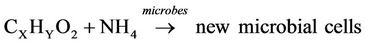
The profile of average temperatures for the trials with and without the addition of used cooking oil are presented in Figure 6. The average bioreactor temperature increased gradually due to microbial metabolism of organic material. The microorganisms utilized the bioavailable carbon for energy (respiration) and synthesis (growth) of new microbial cells according to the following equations [22].
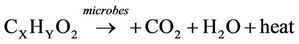 (1)
(1)
 (2)
(2)
The generated heat raised the temperature of the material in the bioreactor (sensible heat) and caused the evaporation of moisture (latent heat). Also some heat was lost with the exhaust gas and through the body of the reactor. The temperature in the control experiments (with no oil added) reached 49˚C after 48 h and declined quickly due to lack of bioavailable carbon. The addition of used cooking oil (100 ml every 12 h), as a bioavailable carbon source during the first 8 days, increased the peak temperature (63˚C) and its duration (5 days). Thermophilic temperature range (above 45˚C) was maintained in the composting system for 7 days. Alkoaik and Ghaly [22] reported a maximum temperature of 40 while composting greenhouse tomato plant residues with dairy manure. Ghaly et al. [20] reported a maximum temperature of 63˚C while composting tomato plant residue contaminated with pirimiphos-methyl with the addition of 36 mL of used cooking oil every 12 hours.
7.3. Composting Biological Parameters
The changes in the moisture content, volatile and fixed solids, total carbon, nitrogen and C:N ratio are presented in Table 7.
Moisture Content: The initial moisture content of the compost mixture was 60.7% ± 0.36%. This decreased slightly by the end of the experiment (10 days) to 58.9% ± 0.56%. A small change in moisture content was observed (3%) due to the equilibrium between the water produced by microbial respiration and the water lost with the exhaust gas. The moisture content remained within the ideal range (50% - 70%) for composting as recommended by several researchers [20,23,24].
Guardia et al. [25] observed a decrease in the moisture content of composted food waste with wood chips mixture from 63.4% to 50.5% after 37 days of composting. Ghaly et al. [26] reported a reduction in the moisture content from 60.7% to 59% during composting of greenhouse tomato plant residues with dairy manure. Hua et al. [27] reported a steadily decreasing trend of moisture content from an initial value of 62.5% to a final value of 30.2% after 60 days during composting of sewage sludge mixed with rapeseed marc. According to Walker et al. [28], an intense decrease of moisture content will reduce the metabolic rate of microbes and reduce theeffectiveness of the bioremediation process while high moisture content can reduce the oxygen transfer. In this study, the moisture content remained within the optimum range till the end of the experiment.
Solids: The initial volatile and fixed solids were 877 ± 13 and 123 ± 5 g/kg, respectively. These were reduced after 10 days to 711 ± 9 and 120 ± 4 g/kg resulting in reductions of 18.92% and 0.8% for the volatile solids and fixed solids, respectively. Wang et al. [29] reported 25% reduction in the volatile solids after 12 days of composting municipal sludge and vegetable waste. Hanninen et al. [30] reported 21.7% reduction in volatile solids after 60 days of composting. Ghaly et al. [20] reported 17% reduction in volatile solids after 12 days of composting tomato plant residues. The lower reduction in volatile solids observed in this study was due to the low bioavailable carbon in hay.
Total carbon: The initial and final total carbon (TC) were 437 ± 11 and 369 ± 7 mg/kg, respectively. The re-
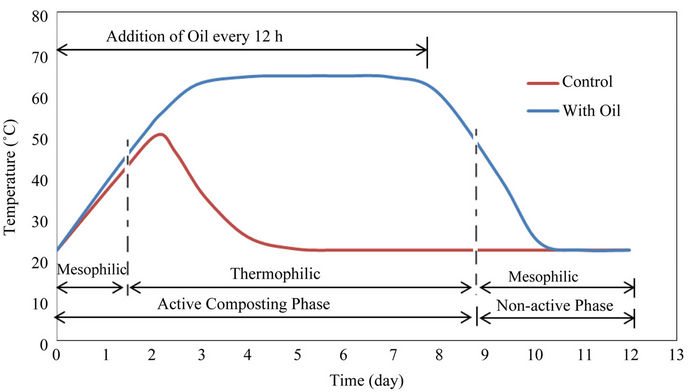
Figure 6. Temperature profile.
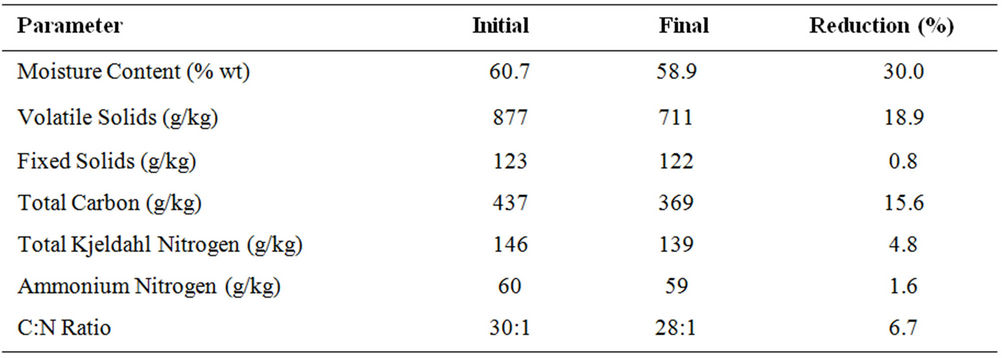
Table 7. Changes in biological parameters.
duction in TC was 15.56%. Beck-Friis et al. [31] reported a TC reduction of 65% after 31 days of composting source separated organic household waste. Michel et al. [32] reported a TC reduction of 24% during composting of yard trimmings consisting of leaves and grass. Ghaly et al. [20] reported a TC reduction of 9.4% during composting of tomato plant residues. Michel et al. [33] and Lopez-Real and Buptisa [34] reported TC reduction of 60%. Sadaka and El Faweel [35] reported a TC reduction of 33%. The lower reduction in TC observed in this study was due to the fact that most of the carbon in hay was non-bioavailable for microbes.
Nitrogen: The initial total Kjeldahl nitrogen (TKN) and ammonium nitrogen (NH4-N) were 146 ± 4 and 60 ± 3 mg/kg. Reductions of 4.8% and 1.6% for the TKN and NH4-N were achieved, respectively. The low reduction in NH4-N was due to the conversion of organic nitrogen to NH4 and the conversion of NH4 back to organic nitrogen in the form of microbial cells. Fang et al. [36] reported a loss of NH4 during composting in the form of NH3 by volatilization. Tiquia and Tam [37] observed the conversion of NH4 to NO2 and  by the nitrification process. In this study, no NH3 was observed in the exhaust gas and the nitrification was inhibited by the high temperature [38].
C:N Ratio: The initial C:N ratio was adjusted 30:1 as recommended by several researchers [20,39]. It was reduced to 28:1 by the end of the experiment. The change in C:N ratio is an indication of the biodegradation of carbon [20]. Larsen and McCartney [40] investigated the effect of C:N ratio on the performance of a composting system treating pulp and paper biosolids using four C:N ratios (107:1, 55:1, 29:1 and 18:1) and found that an initial C:N ratio of 29:1 to be the most suitable as judged by the reduction in volatile solids. Hamoda et al. [39] reported organic carbon reductions of 8%, 9% and 11% at C:N ratios of 15:1, 20:1 and 30:1, respectively. Ghaly et al. [20] reported a reduction of 6.7% in the C:N ratio while composting tomato plant residue. Since the C:N ratio slightly decreased in this study, it can be concluded that nitrogen was not a limiting factor during the composting process.
7.4. Captan
Figure 7 shows the concentration of captan in the composting mixture with time. The majority of the captan (92.4%) was degraded during the first 4 days. A number
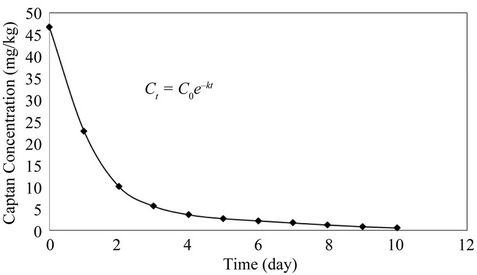
Figure 7. Captan decomposition during composting.
of mechanisms have been reported for the degradation process including mineralization, biotransformation, humificaiton and volatilization [20,41-43]. Biodegradation is accelerated by high temperature, optimum moisture content and presence of sufficient organic matter [20,42, 44].
The fate of several pesticides during composting has been investigated by several researchers. Lemmon and Pylypiw [45] found that three organophosphate insecticides (diazinon, chlorpyrifos and isofenphos) disappeared from grass clippings during the composting process reaching a concentration less than 1 mg/kg after 21 days of composting. Vandervoort et al. [46] investigated the fate of several pesticides (the organophosphate insecticide chlorpyrifos, the four herbicides 2,4-D, isoxaben, triclopyr, clopyralid and the plant growth inhibitor flurprimidol) during composting of grass clippings and found the pattern of pesticide loss to be similar for all pesticides. They concluded that the destruction process of pesticides was biological in nature. Fogg et al. [43] reported that the composting process was able to degrade a complex mixture of pesticides (isoproturon, pendime-thalin, chlorpyrifos, chlorothalonil, epoxiconazola and dimethoate). Ghaly et al. [20] reported the destruction of pirimiphosmethyl after 11 days of composting of tomato plant residues. In this study, the reduction in captan was biological in nature and volatilization did not contribute to the removal mechanism as the exhaust sample did not show any trace of captan.
The biodegradation of organic substrates can be described using the following first order model [20,47-50]:
 (3)
(3)
where:
Ct = concentration of the organic substrate at time t (mg/kg);
C0 = initial concentration of the organic substrate (mg/kg);
k = rate constant (h–1).
A plot of ln (Ct/C0) versus time yields a straight line with a slope equal to k. The linear relationship between ln (Ct/C0) and time for the biological degradation of captan is only true for specific temperature zones within the active microbial phase as shown in Figure 8. The results indicated that the pesticide was used as a bioavailable carbon source and the activity of the mesophilic microorganisms were much higher than those of the thermophilic microorganisms. The degradation rate constant of the mesophilic stage (0.724 d–1) was 2.74 times the degradation rate constant of the thermophilic stage (0.264 d–1).
Michel et al. [32] and Reddy and Michel [42] suggested that thermophilic microbial communities are involved in the mineralizaiton and biotransformation of pesticides during composting. The results obtained from this study suggest that either the majority of the thermophilic microoganisms did not possess the enzymes required for the degradation of captan or they were less tolerant to its inhibitory effect as compared to the mesophilic microorganisms. The lower k value of the thermophilic stage seems to favour the latter.
Leoni et al. [51] reported a captan half-life of 0.12 months in an activated sludge system. Hermanutz et al. [52] reported captan half-lives of 7 h at 12˚C and 1 h at 25˚C in Lake Superior water at a pH of 7.5. In this study, captan half-life was 0.96 h.
8. Conclusions
Captan in solution appears to degenerate when left standing. A reduction of 9.12% (from 125 to 113.6 mg/l) was observed after 24 h. Both hay and soybean plant residues were very effectivein absorbing captan from the wastewater, they removed 99.2% and 98.5% of captan form the wastewater after 4 hours. Because of its availability, hay can be used in an onfarm pesticide immobilization system that would consist of shallow (10 m length × 4 m width × 1 m depth) reinforced concrete pit (filled with hay) with steel bars across the top for machinery to roll onto and be washed. A drain tile should be installed at the bottom with accessible riser for the removal of decontaminated water. The wastewater can be
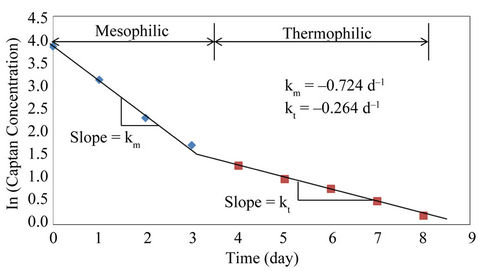
Figure 8. Captan biological degradation.
retained for 4 hours which is a sufficient time for hay to absorb the captan. The decontaminated water can be disposed of safely and the contaminated hay can then be composted.
The composting process was effective in degrading captan. The addition of used cooking oil raised the temperature of the composting mixture and maintained it at 63˚C. Small reductions in moisture content (from 60 to 58.9 %) and C:N ratio (from 30:1 to 28:1) were observed at the end of the experiment. Reductions of 18.92%, 15.56% and 4.8% in the volatile solids, total carbon total Kjeldahl nitrogen were achieved after 10 d of composting. About 92.4% of the captan was degraded in the first 4 days of composting. The biodegradation process followed a first order model. However, the degradation rate constant for the mesophilic stage (0.724 d–1) was 2.74 times the degradation rate constant in the thermophilic stage (0.264 d–1). An onfarm windrow composting process would be very effective in degrading captan in hay. The captan contaminated hay could be mixed with equal amount poultry manure or dairy manure to provide the required bioavailable carbon and nutrients for the composting process. Some used cooking oil could also be added to maintain higher temperature within the windrows. The windrows should be mixed on a daily basis for 8 - 10 days to provide sufficient oxygen for the composting microorganisms.
9. Acknowledgements
This research was funded by the Natural Science and Engineering Research Council (NSERC) of Canada.
REFERENCES
- J. K. Horowitz and E. Lichtenberg, “Insurance, Moral Hazard, and Chemical Use in Agriculture,” American Journal Agricultural Economics, Vol. 75, No. 4, 1993, pp. 926-935. doi:10.2307/1243980
- E. C. Oerke and H. W. Dehne, “Safeguarding ProductionLosses in Major Crops and the Role of Crop Protection,” Crop Protection, Vol. 23, No. 4, 2004, pp. 275-285. doi:10.1016/j.cropro.2003.10.001
- J. Cooper and H. Dobson, “The Benefits of Pesticides to Mankind and the Environment,” Crop Protection, Vol. 26, No. 9, 2007, pp. 1337-1348. doi:10.1016/j.cropro.2007.03.022
- C. Osteen and M. Livingstion, “Pest Management Practices,” 2006. http://www.ers.usda.gov.
- Statistics Canada, “Canadian Industry Statistics,” 2010. http://www.ic.gc.ca.
- OECD, “Statistics from A to Z,” 2007. http://www.oecd.org.
- CropLife, “Plant Science Industry in Canada,” 2007. http://www.croplife.ca.
- P. C. Kearney, M. T. Muldoon, C. J. Somich, J. M. Ruth and D. J. Voaden, “Biodegradation of Ozonated Atrazine as a Wastewater Disposal System,” Journal of Agriculture and Food Chemistry, Vol. 36, No. 6, 1988, pp. 1301-1306. doi:10.1021/jf00084a044
- T. J. Centner, “Unwanted Agricultural Pesticides: State Disposal Programs,” Journal of Environmental Quality, Vol. 27, No. 4, 1998, pp. 736-742. doi:10.2134/jeq1998.00472425002700040002x
- C. Wilson and C. Tisdell, “Why Farmers Continue to Use Pesticides Despite Environmental Health and Sustainability Costs,” Ecological Economics, Vol. 39, No. 3, 2001, pp. 449-462. doi:10.1016/S0921-8009(01)00238-5
- R. L. Ridgway, J. C. Tinney, J. T. MacGregor and N. J. Starler, “Pesticide Use in Agriculture,” Environmental Health Perspectives, Vol. 27, 1978, pp. 103-112. doi:10.1289/ehp.7827103
- D. W. Connell, “Bioaccumulation Behaviour of Persistent Organic Chemicals with Aquatic Organisms,” Review of Environmental Contamination and Toxicology, Vol. 101, 1988, pp. 117-154.
- K. Verschueren, “Handbook of Environmental Data on Organic Chemicals,” Van Nostrand Reinhold, New York, 1977.
- C. E. Lundholm, “DDE-Induced Eggshell Thinning in Birds: Effects of p,p’-DDE on the Calcium and Prostaglandin Metabolism of the Eggshell Gland,” Comparative Biochemistry and Physiology Part C: Pharmacology Toxicology Endocrinology, Vol. 118, No. 2, 1997, pp. 113-128. doi:10.1016/S0742-8413(97)00105-9
- R. Spiewak, “Pesticides as a Cause of Occupational Skin Diseases in Farmers,” Annals of Agricultural and Environmental Medicine, Vol. 8, No. 1, 2001, pp. 1-5.
- N. E. Kowal and H. R. Pahren, “Health Effects Associated with Wastewater Treatment and Disposal,” Journal of Water Pollution Control Federation, Vol. 54, No. 6, 1982, pp. 677-687.
- Wolfram Alpha Knowledge Base, “Wolfram Mathematica Chemical Data,” 2011. http://www.wolframalpha.com.
- Sigma Aldrich, “Material Safety Data Sheet,” 2011. http://www.sigmaaldrich.com.
- A. E. Ghaly, I. Uguw, A. Ergudenler and F. Hamdullahpur, “Development and Evaluation of Straw Chopping System for Fluidized Bed Gasifier,” 7th Canadian Bioenergy R & D Conference, Energy Mines and Kegoures, Sudbury, 24-26 April 1989.
- A. E. Ghaly, F. Alkoaik and A. Snow, “Degradation of Pirimiphos-Methyl During Thermophilic Composting of Greenhouse Tomato Plant Residues,” Canadian Biosystem Engineering, Vol. 49, No. 1, 2007, pp. 1-11.
- ASTM, “Annual Book of Standards of the ASTM,” American Society for Testing and Materials, West Conshohocken, 2001.
- F. Alkoaik and A. E. Ghaly, “Influence of Dairy Manure Addition on the Biological and Thermal Kinetics of Composting of Greenhouse Tomato Plant Residues,” Waste Management, Vol. 26, No. 8, 2006, pp. 902-913. doi:10.1016/j.wasman.2005.11.023
- S. M. Tiquia, N. F. Y. Tam and I. J. Hodgkiss, “Changes in Chemical Properties during Composting of Spent Pig Litter at Different Moisture Contents,” Agriculture, Ecosystem and Environment, Vol. 67, No. 1, 1998, pp. 79-89. doi:10.1016/S0167-8809(97)00132-1
- T. L. Richard, H. V. M. Hamerlers, A. H. M. Veeken and T. Silva, “Moisture Relationships in Composting Processes,” Compost Science and Utilization, Vol. 10, No. 4, 2002, pp. 286-302.
- A. D. Guardia, P. Mallard, C. Teglia, A. Marin and C. Le Pape, “Comparison of Five Organic Wastes Regarding their Behaviour During Composting: Part I, Biodegradability, Stabilization Kinetics and Temperature Rise,” Waste Management, Vol. 30, No. 3, 2010, pp. 402-414. doi:10.1016/j.wasman.2009.10.019
- A. E. Ghaly, F. Alkoaik and A. Snow, “Thermal Balance of Invessel Composting of Tomato Plant Residues,” Canadian Biosynthesis Engineering, Vol. 48, 2006, pp. 6.13- 6.22.
- L. Hua, W. X. Wu, Y. X. Liu, Y. X. Chen and M. B. McBride, “Effect of Composting on Polycyclic Aromatic Hydrocarbons Removal in Sewage Sludge,” Waste Air Soil Pollution, Vol. 193, No. 4, 2008, pp. 259-267. doi:10.1007/s11270-008-9687-y
- L. P. Walker, T. D. Nock, J. M. Gossett and J. S. Van der Gheynst, “The Role of Periodic Agitation and Water Addition in Managing Moisture Limitations during High Solids Aerobic Decomposition,” Process Biochemistry, Vol. 34, No. 6-7, 1999, pp. 601-612. doi:10.1016/S0032-9592(98)00122-8
- J. Y. Wang, O. Stabnikikova, S. T. L. Tay, V. Ivanov and J. H. Tay, “Intensive Composting of Sewage Sludge and Food Waste by Bacillus Thermoamylovorans,” World Journal of Microbiology and Biotechnology, Vol. 19, No. 4, 2003, pp. 427-432. doi:10.1023/A:1023933212654
- K. Hanninen, O. Tolvanen, A. Veijanen and K. Villberg, “Bioaerosols in Window Composting of Source Separated Biowastes. In Biomass for Energy, Environment, Agriculture and Industry,” Proceedings of the 8th European Biomass Conference, Vienna, 3-5 October 1994.
- B. Beck-Friis, S. Smars, H. Jonsson and H. Kirchmann, “Gaseous Emissions of Carbon Dioxide, Ammonia, Nitrous Oxide from Organic Household Waste in a Compost Reactor under Different Temperature Regimes,” Journal of Agricultural Engineering Research, Vol. 78, No. 4, 2001, pp. 423-430. doi:10.1006/jaer.2000.0662
- F. C. Jr Michel, C. A. Reddy and L. J. Forney, “Microbial Degradation and Humification of the Lawn Care Pesticide 2,4-dichlorophenoxyacetic Acid during the Composting of Yard Trimmings,” Applied and Environment Microbiology, Vol. 61, 1995, pp. 933-941.
- F. C. Michel, L. J. Forney, A. J. Huang, S. Drew and M. Czuprenski, “Effects of Turning Frequency, Leaves to Grass Mix Ratio and Windrow vs Pile Configuration on the Composting of Yard Trimming,” Compost Science and Utilization, Vol. 4, No. 3, 1996, pp. 26-43. DOI: 10.1016/S0960-8524(97)00080-1.
- J. Lopez-Real and M. Baptista, “A Preliminary Study of Three Manure Composting Systems and Their Influence on Process Parameters and Methane Emissions,” Compost Science Utilization, Vol. 4, No. 3, 1996, pp. 71-82.
- S. Sadaka and A. El Faweel, “Effects of Aeration and C:N Ratio on Household Waste Composting in Egypt,” MISR Agricultral Engineering Journal, Vol. 11, No. 1, 2003, pp. 36-40.
- M. Fang, J. W. C. Wong, K. K. Ma and M. H. Wong, “Co-Composting of Sewage Sludge and Coal Fly Ash: Nutrient Transformations,” Bioresource Technology, Vol. 67, No. 1, 1999, pp. 19-24. doi:10.1016/S0960-8524(99)00095-4
- S. M. Tiquia and N. F. Y. Tam, “Fate of Nitrogen during Composting of Chicken Litter,” Environmental Pollution, Vol. 110, No. 3, 2000, pp. 535-541. doi:10.1016/S0269-7491(99)00319-X
- N. Morisaki, C. G. Phae, K. Nakasaki, M. Shoda and H. Kubota, “Nitrogen Transformation during Thermophilic Composting,” Journal Fermentation and Bioengineering, Vol. 67, No. 1, 1989, pp. 57-61. doi:10.1016/0922-338X(89)90087-1
- M. F. Hamoda, H. A. Abu Qdais and J. Newham, “Evaluation of Municipal Solid Waste Composting Kinetics,” Resources, Conservation and Recycling, Vol. 23, No. 4, 1998, pp. 209-223. doi:10.1016/S0921-3449(98)00021-4
- K. L. Larsen and D. M. McCartney, “Effect of C:N Ratio on Microbial Activity and N Retention: Bench-Scale Study Using Pulp and Paper Biosolids,” Compost Science and Utilizaiton, Vol. 8, No. 2, 1998, pp. 147-159.
- F. Buyuksonmez, R. Rynk, T. F. Hess and E. Bechinski, “Occurrence, Degradation and Fate of Pesticides during Composting,” Compost Science and Utilization, Vol. 7, No. 4, 1999, pp. 66-82.
- C. A. Reddy and F. C. Michel, “Fate of Xenobiotics During Composting,” Proceedings of the 8th International Symposium on Microbial Ecology, Magnolia Publishing, Halifax, 9-14 August 1998.
- P. Fogg, A. B. Boxall, A. Walker and A. Jukes, “Pesticide Degradation in a Biobed Composting Substrate,” Pest Management Science, Vol. 59, No. 5, 2003, pp. 527-537. doi:10.1002/ps.685
- F. Rocha and A. Walker, “Simulation of the Persistence of Atrazine in Soil at Different Sited in Portugal,” Weed Research, Vol. 35, No. 3, 1995, pp. 179-186. doi:10.1111/j.1365-3180.1995.tb02031.x
- C. R. Lemmon and H. M. Pylypiw Jr., “Degradation of Diazinon, Chlorpyrifos, Isofenphos and Pendimethalin in Grass and Compost,” Bulletin of Environmental Contamination and Toxicology, Vol. 48, No. 3, 1992, pp. 409-415. doi:10.1007/BF00195640
- C. Vandervoort, M. J. Zabik, B. Branham and D. W. Lickfeldst, “Fate of Selected Pesticides Applied to Turf Grass: Effects of Composting on Residues,” Bulletin of Environmental Contamination and Toxicology, Vol. 58, No. 1, 1997, pp. 38-45. doi:10.1007/s001289900297
- W. J. Lyman, W. F. Reehl and D. H. Rosenblatt, “Handbook of Chemical Property Estimation Methods,” American Chemical Society, Washington, 1990.
- T. C. Wang and M. E. Hoffman, “Degradation of Organophosphorous Pesticides in Coastal Water,” Journal of the Association of Official Analytical Chemists, Vol. 74, No. 5, 1991, pp. 883-886.
- R. T. Haug, “The Practical Handbook of Composting Engineering,” Lewis Publisher, Boca Raton, 1993.
- I. S. Eneji, E. Buncel and G. W. VanLoon, “Degradation and Sorption of Pirimiphos-Methyl in Two Nigerian Soils,” Journal of Agriculture and Food Chemistry, Vol. 50, No. 20, 2002, pp. 5634-5639. doi:10.1021/jf0203747
- V. Leoni, C. Cremisini, R. Giovinazzo, G. Puccetti and M. Vitali, “Activated Sludge Biodegradation Test as a Screening Method to Evaluate Persistence of Pesticides in Soil,” Science of the Total Environment, Vol. 123-124, 1992, pp. 279-289. doi:10.1016/0048-9697(92)90153-J
- R. O. Hermanutz, L. H. Mueller and K. D. Kempfert, “Captan Toxicity to Fathead Minnows (Pimephales Promelas), Bluegills (Lepomis Macrochirus), and Brook Trout (Salvelinus Gontinalis),” Journal of the Fisheries Research Board of Canada, Vol. 30, No. 12, 1973, pp. 1811-1817. doi:10.1139/f73-291