Journal of Environmental Protection
Vol. 3 No. 1 (2012) , Article ID: 16864 , 12 pages DOI:10.4236/jep.2012.31003
Water Quality Assessment of the Owena Multi-Purpose Dam, Ondo State, Southwestern Nigeria
![]()
1Department of Chemistry, Federal University of Technology, Akure, Nigeria; 2Department of Microbiology, Federal University of Technology, Akure, Nigeria.
Email: *demolaktp@yahoo.co.uk
Received October 18th, 2011; revised November 21st, 2011; accepted December 23rd, 2011
Keywords: Water physicochemical characteristics; Microbiology; Heavy metals; Owena multi-purpose dam
ABSTRACT
Composite water samples taken from Owena Multi-purpose Dam in six sampling campaigns covering the wet and dry seasons were analyzed for physico-chemical and microbial characteristics using standard methods for the examination of water and wastewater jointly published by the American Public Health Association, American Water Works Association and Water Pollution Control Federation. Results showed significant (p < 0.05) seasonal variations in most measured parameters with few showing significant spatial variation. The characteristics of the water from the dam lake revealed an acceptable quality for most measured parameters with low chemical pollutants burden when compared with drinking water standards and water quality for aquaculture. However, high values of turbidity, colour, iron, manganese and microbial load were recorded compared with drinking water standards, which call for proper treatment of the water before distribution for public consumption.
1. Introduction
The old Owena Water Supply Scheme, completed as far back as 1960 has a design capacity to supply 10 million litres of water to some towns and villages in the present Ondo and Ekiti States of Nigeria. The water demand in this area increased tremendously over the years making the facility to become grossly inadequate for the intended towns and villages, a development that called for a much larger supply scheme. Consequently, the Ondo State Government in 1976, commissioned the design of the Owena River Dam with the objective of supplying raw water from the resulting reservoir for the existing water scheme, but taken over by the Federal Government of Nigeria (through Benin-Owena River Basin Development Authority) and converted it to a multipurpose use in line with the functions of the River Basin Development Authorities. The design was reviewed to include in addition to provision of potable water, usage for irrigation of 3000 hectares of farmland, fisheries, as well as generation of hydro-electric power. The dam, sited on the Owena River about 14 km upstream of the old Owena water scheme, was designed to create an impoundment of 36.25 million cm3 gross capacity, covering an area of approximately 7.38 km2 at the normal water level.
Natural water is never absolutely pure, as it carries traces of other substances which bestow on it physicalchemical and bacteriological characteristics. The nature and amount of these substances called impurities vary with sources of the water. Although, most of the water on earth is not accessible, the surface water, which is the most accessible, represents only about 0.02% of the total water resources [1]. This slight fraction of the world water would be enough for man’s needs if it were well distributed and kept clean. Since either of them is not done, water quality therefore becomes one of the primary concerns of man. Presently, the menace of water-borne diseases and epidemics still looms large on the horizon of developing countries as a result of lack of accessibility to good quality water [2,3]. Polluted water has been the cause of all such cases, in which the major sources of pollution are domestic and municipal wastes from urban and industrial activities, runoff from farmland, etc. [4,5]. Most countries of the world now have water resources management policies aimed at achieving sustainable use of their water resources by protecting and enhancing their quality, while maintaining economic and social development. Achieving this objective requires that the needs and wants of the community for each water resource are defined and that these resources are protected from degradation. These community needs generally called the environmental values (or beneficial uses) of the water body [6], include water for drinking, swimming, fishing, recreation, agricultural food production, and/or ecosystem protection; the basis for which the Owena Multipurpose Dam was conceived and constructed. However, the extent to which a particular water source could serve these community’ needs depend on the quality of the water.
Water quality is a term used to describe the chemical, physical and biological characteristics of water in relation to all other hydrological properties, usually in respect to its suitability for a particular purpose. Any characteristic of water that effects its potability, the survival, reproduction, growth and production of aquaculture species, influences management decisions, causes environmental impacts or reduces product quality and safety can be considered a water quality variable [7,8]. The values or concentrations attributed to water quality parameters can be used to describe the pollution status of the source, its biotic status or to predict the likelihood or otherwise of particular organisms being present [7,9]. Thus, this study examined the water quality characteristics of the Owena multipurpose dam, as a key activity in managing the water source, restoring it if polluted and anticipating the effects of man-made changes on the dam lake.
2. Materials and Methods
2.1. Study Area
The Owena Multipurpose Dam is located at Km10, off Akure-Ilesha Road, Igbara-Oke in Ifedore Local Government Area of Ondo State, Nigeria (Figure 1). The dam is supplied with water from the Owena River and it covers an appropriate surface area of 7.8 km2. Currently, the water from the dam is to feed the 60,000 m3/day capacity water treatment plant built beside the dam. Fishing activities by registered local fishermen are also presently taking place within the dam lake.
2.2. Sampling and Sample Preservation
Water samples from the dam lake were collected from eight randomly selected locations (Figure 1) in six sampling campaigns between December 2009 and October 2010, covering both the dry and wet seasons. At every sampling point, water samples were taken at about 30 cm below the surface and close to lake bed with depth sampler and mixed to form a composite sample.
2.3. Sample Analysis
Parameters such as temperature, pH, conductivity and dissolved oxygen were measured on-site with standard, calibrated portable meters and kit. A Hatch Multimeter was used for monitoring temperature, pH and conductivity, while Hanna Dissolved Oxygen Kit was used to determine dissolved oxygen. Other water physico-chemical and microbiological parameters were analyzed in the laboratory using methods prescribed by APHA [10]. Heavy metals in the water samples were analysed using Atomic Absorption Spectrophotometer (AAS) after preconcentration [11]. For every batch of samples for heavy metals analysis, spiked distilled-deoinised water was treated in the same manner as the samples for accuracy study, with recovery ranging between 96.5% - 98.9%. Data generated from the monitoring programme were statistically tested for seasonal variation using the student’s t-test.

Figure 1. Map showing Owena dam and sampling points.
3. Results and Discussion
3.1. Dam Water Physicochemical Characteristics
The results of the physicochemical characteristics of water from the dam lake for dry and wet seasons are presented in Tables 1 and 2 respectively, while results of the statistical analysis are shown in Table 3.
The student’s t-test conducted on the results revealed high level of significant difference (p < 0.05) between wet and dry seasons’ values for all parameters except turbidity and calcium. This observation is typical of the characteristics of dams within the geographical region [12] and most surface waters as reported by many authors [5,8,9,13,14], Spatial variation was, however, low in most of the water quality parameters as shown in the calculated values of coefficient of variation, implying that the water samples were collected basically from sources of similar physicochemical characteristics, which are more influenced by the lithology of the basin.
The relatively high temperature recorded in the dry season variation is in response to time and period of sample collection. Similar observation was reported for
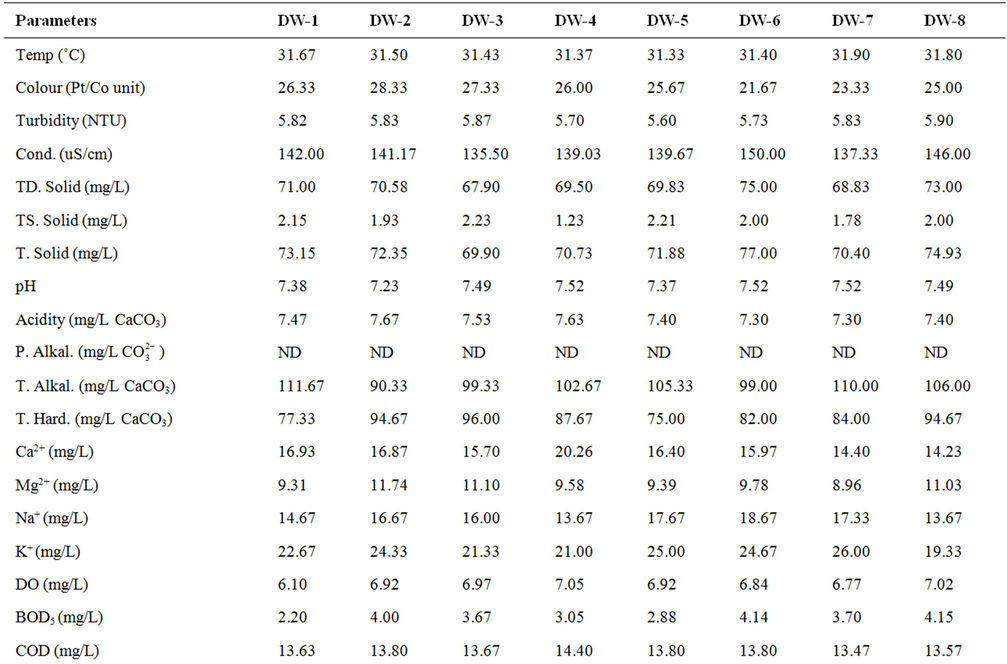
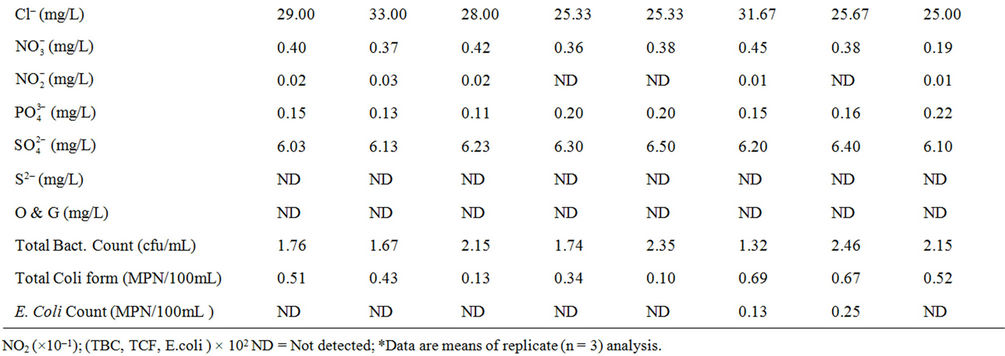
Table 1. Mean* physico-chemical characteristics of Owena dam water (dry season).
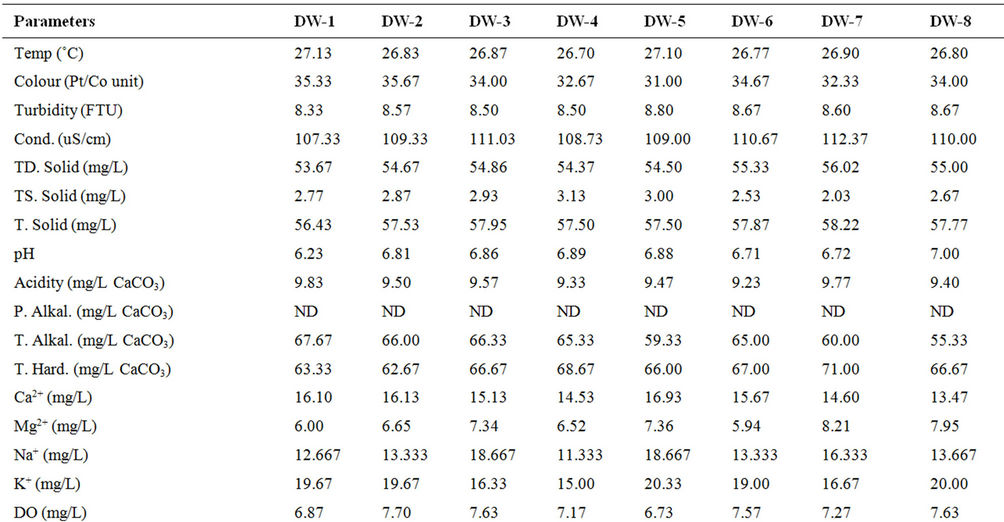
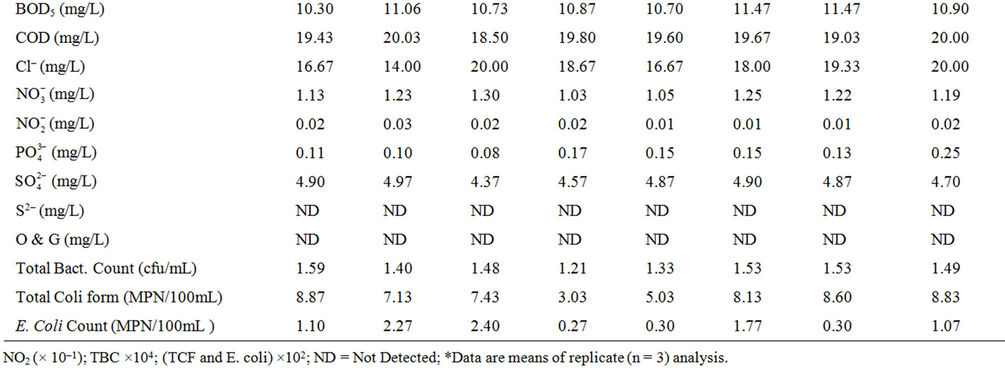
Table 2. Mean* physico-chemical characteristics of Owena dam water (wet season).
some dams and surface waters within the same goegraphic region with the dam under investigation [9,12,15,16]. Cool water is generally more palatable than warm water, and temperature will impact on the acceptability of a number of other inorganic constituents and chemical contaminants that may affect taste. High water temperature enhances the growth of microorganisms and may increase taste, odour, colour and corrosion problems [17]. The effect of temperature, and especially changes in temperature, on living organisms can be critical. Temperature controls the solubility of gases in water, and the reaction rate of chemicals, the toxicity of ammonia, and of chemotherapeutics to fish. Temperature is the most important physical variable affecting the metabolic rate of fish and is therefore one of the most important water quality attributes in aquaculture [18]. The mean temperature value (28.41˚C) of the dam lake fell within the optimal water temperatures (Target Guidelines) of 28˚C - 30˚C, within which maximal growth rate, efficient food conversion, best condition of fish, resistance to disease and tolerance of toxins (metabolites and pollutants) are enhanced [7].
High colour units measured during the wet season compared to the dry season’s data can be attributed to runoff into water bodies with high entrained suspended suspended particles and coloured substances predominantly of organic origin. Because of its origins mostly in vegetable matter the degree of colour in a water may vary widely in space and in time. Limits for colour in potable water have traditionally been based on aesthetic considerations rather than on the basis of a health hazard, and this has been set at 15.00 Pt/Co units [17-19], lower than the mean value (30.21 Pt/Co units) recorded for the dam water. This calls for attention because the presence of colour on a persistent basis in a water to be disinfected by chlorination is highly undesirable. There is high tendency for the colour-causing substances to react with the added chlorine giving rise to the presence of trihalomethanes (THMs), which are potential hazards to public health [18,20].
Mean turbidity values measured in the dam water samples were higher than the guideline value of 5.0 NTU for drinking water [17,18]. Higher values were recorded during the raining season than in the dry season. During the raining season, rivers receive large volume of storm water with entrained suspended materials. Higher total suspended solid recorded for the wet season’s study as compared to the dry seasons’s study corroborated this observation. Suspended matter can contain toxins such as heavy metals and biocides and can also harbour microorganisms, protecting them from disinfection [17]. Excessive turbidity may also be associated with unpleasant tastes and odours [21]. In addition, high turbidity can lead to an increase in the amount of disinfection byproducts (THMs) that form in treated water and could interfere with sunlight penetration, thus reducing photosynthesis and the production of oxygen for fish and aquatic life [7].
Water conductivity values measured for the dry season were higher than for the wet season. This is attributable to excessive evaporation of water from the dam during the dry season, which might have consequently increased the concentration of dissolved salts as reflected in the TDS values, or dilution resulting from rainwater input during the wet season.
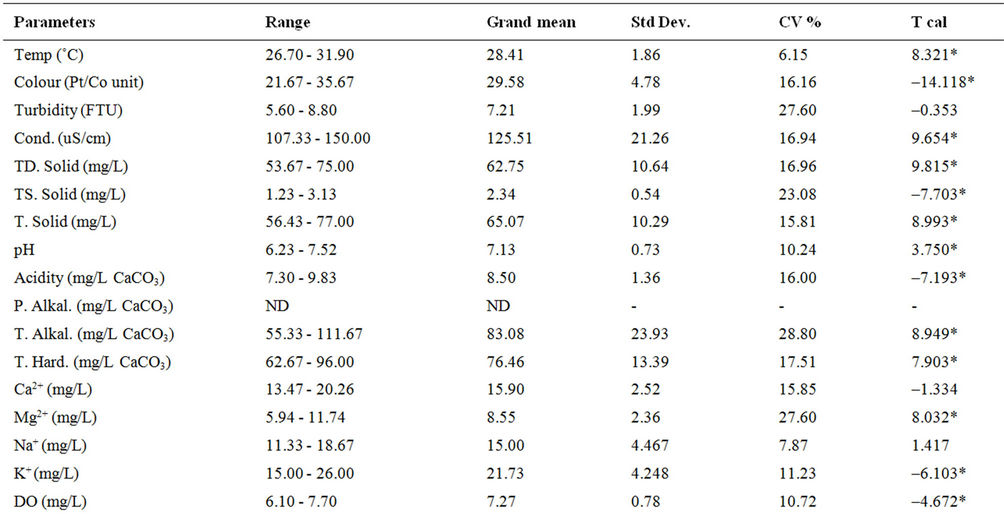
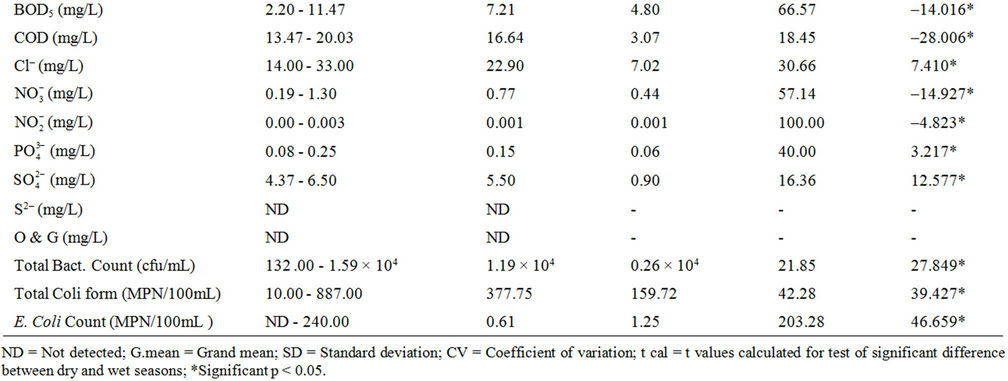
Table 3. Statistical analysis of Dam water physico-chemical parameters.
The low conductivity and TDS values measured reflect freshness of the water source [1,9,16]. Classification of potability based on electrical conductivity ascribes <325 μS·cm–1 for fresh and potable water [22], while an aesthetic objective of 500 mg/L has been established for total dissolved solids (TDS) in drinking water [19,21].
The mean pH of the water samples ranged from very slightly acidic value of 6.23 to slightly basic value of 7.52. The lower values recorded during the wet season as against the dry season might be due to deposition of some organic matter into water from run-off. Partial decomposition of this organic matter by bacteria and fungi has been recognized to produce various organic acids that are capable of lowering the pH of aqueous solution. Rain water of lower pH due to dissolved gases (CO2, SO2 and NO2) may also contribute to low pH values of surface water in the wet season [23]. Lower wet season pH values for dam water were found to be consistent with reports from similar studies [12,15]. Many processes in natural waters are significantly influenced by some change in the pH value. For example, the surface charge of colloids in natural waters and hence their ability to coagulate or sorb ions will depend on the hydronium ion concentration (pH), as will the solubility and speciation of dissolved ions. In most fresh natural waters the pH typically ranges between 6.5 and 7.5 [7]. Although pH usually has no direct impact on consumers, it is one of the most important operational water quality parameters. Extremes of pH can affect the palatability of a water but the corrosive effect on distribution systems is a more urgent problem [18]. No health-based guideline value has been proposed for pH, however, an acceptable range for drinking water pH is from 6.5 to 8.5 [18,19]. Corrosion effects may become significant below pH 6.5, and the frequency of incrustation and scaling problems may be increased above pH 8.5. Turbidity, tasteand odourproducing compounds, micro-organisms and colour can be removed by a combination of coagulation, flocculation and filtration, the efficiencies of which are markedly dependent on pH [24]. Of greater importance to the microbiological quality of water is the influence of pH on the effectiveness of chlorine disinfection. The germicidal efficiency of chlorine in water is lower at higher pH values, attributable to the reduction in hypochlorous acid concentration, but the rate of disinfection increased with reduction in trihalomethanes byproducts when pH is kept below 8.5 [25]. The effect of pH on fish is also an important consideration and values which depart increasingly from the normally found levels will have a more marked effect on fish, leading ultimately to mortality. The range of pH measured in the dam was within 5.0 - 9.0 considered suitable for fisheries [7,18]. Related to pH are acidity and alkalinity values. In natural unpolluted waters, the acidity is mainly contributed by dissolved CO2, while weak organic acids may also contribute significantly to the total acidity [8]. In present study, the acidity values in mg/L CaCO3 ranged from 7.30 - 9.83, with increased values in wet season compared to the dry season, while the alkalinity ranged from 55.33 - 111.67 mg/L CaCO3.
Hardness values in the water samples ranged from 62.67 - 96.00 mg/L CaCO3. Hardness in water comprises the determination of calcium and magnesium as the main constituents and their widespread abundance in rock formations leads often to very considerable hardness levels in surface waters. One of several arbitrary classifications of waters by hardness include: Soft up to 50 mg/L CaCO3; Moderately Soft 51 - 100 mg/L CaCO3; Slightly Hard 101 - 150 mg/L CaCO3; Moderately Hard 151 - 250 mg/L CaCO3; Hard 251 - 350 mg/L CaCO3; Excessively Hard over 350 mg/L CaCO3 [18]. The values recorded from the dam lake were within the moderately soft classification. Although hardness may have significant aesthetic effects, a maximum acceptable level has not been established because public acceptance of hardness may vary considerably according to the local conditions. Water supplies with a hardness greater than 200 mg/L CaCO3 are considered poor but have been tolerated by consumers; those in excess of 500 mg/L CaCO3 are unacceptable for most domestic purposes [17]. It has been suggested that a hardness level of 80 to 100 mg/L (as CaCO3) provides an acceptable balance between corrosion and incrustation [17]. Also, a number of ecological and analytical epidemiological investigations have suggested that there is an inverse statistical correlation between drinking water hardness and certain types of cardiovascular disease [17,26]. More than 15 mg CaCO3/L hardness as recoreded in this study is suitable for fish growth, while less than this value causes slow growth of fish and require liming for high fish production [8,27]. Calcium and magnesium ions measured in the dam lake ranged from 13.47 - 20.26 mg/L and 5.94 - 11.74 mg/L respectively, with calcium contributing more to the hardness. There is no evidence of adverse health effects specifically attributable to calcium and magnesium in drinking water, hence, guideline values for calcium and magnesium have therefore not been specified [17]. Undesirable effects due to the presence of calcium in drinking water may result from its contribution to hardness. However, mention has been made of the possible contribution of drinking-water to total daily intake of calcium and magnesium and that drinkingwater could provide important health benefits, including reducing cardiovascular disease mortality (magnesium) and reducing osteoporosis (calcium), at least for many people whose dietary intake is deficient in either of those nutrients [17].
Moderately high dissolved oxygen (DO) levels were measured in the dam lake with relatively higher values recorded during the wet season than in dry season. Several factors determine the DO levels in water including water temperature, which has inverse relationship with DO, photosynthesis by green algae, salinity and pollution resulting from both natural and anthropogenic activities [8,18]. Organic wastes and other nutrient inputs from sewage and industrial discharges, agricultural and urban runoff can result in decreased oxygen levels. Nutrient input often leads to excessive algal growth; when the algae die, the organic matter is decomposed by bacteria, a process which consumes a great deal of oxygen that could lead to oxygen sag [9]. A high DO level in a community water supply is good because it makes drinking water taste better. However, high DO levels speed up corrosion in water pipes. Dissolved oxygen is an important environmental parameter for the survival of aquatic life. Numerous scientific studies suggest that 4 - 5 mg/L of DO is the minimum amount that will support a large, diverse fish population. The DO level in good fishing waters generally averages about 9.0 mg/L, but when it drops below about 3.0 mg/L, even the rough fish dies, while high DO concentrations (>20 mg/L) are toxic to fish and cause physiological dysfunctions and developmental abnormalities in fertilised eggs and larvae [7,27]. Hence, the dissolved oxygen (DO) levels (7.10 - 7.70 mg/L) measured in the dam lake is considered moderate for all intent and purposes.
The Biological Oxygen Demand (BOD5) values measured in the water samples were slightly high (2.20 - 11.47 mg/L) with the wet season’s data higher than that of the dry season. This implies that the water body containg some biodegradable matter, which is considered to have been influenced by natural decomposition of dead plants that were visible throughout the entire length and breadth of the dam, as well as decoposing waste input through runoff into the basin. Unpolluted, natural waters should have a BOD of 5 mg/L or less, and there are no direct health implications for BOD, but an important indicator of overall water quality [18]. High BOD level causes dissolved oxygen depletion, which could be detrimental to aquatic life. Relatively higher values of chemical oxygen demand (COD) compared to BOD were measured in the water samples, with values ranging from 13.47 mg/L to 20.03 mg/L No direct health implications for COD, but also an important indicator of overall water quality [18].
Low chloride levels were measured in the dam water samples. The consistently higher values recorded during the dry season over the wet season could be as a result of concentration of this anion from excessive water evaporation from the dam as earlier pointed out. The generally low values recorded also showed freshwater condition of the dam lake. Chloride is a ubiquitous aqueous anion in all natural waters, the concentrations varying very widely and reaching a maximum in sea water. Natural levels in rivers and other fresh waters are usually in the range 15 - 35 mg/L Cl–, similar to what was recorded in this study, and much below the permissible drinking water standard of <250 mg/L [18,19,28,29]. In fresh waters the sources include soil and rock formations and waste discharges [9]. Chloride has little effect on fish health or behaviour and is not considered a problem in inland waters [7].
Nitrate ( ) levels in the water were generally low (0.19 - 1.30 mg/L) compared to what is normally found in an unpolluted natural fresh waters. Relatively little of the nitrate found in natural waters is of mineral origin, while most coming from organic and inorganic sources, including waste discharges and artificial fertilisers. Also, bacterial oxidation and fixing of nitrogen by plants can both produce nitrate [7,18]. Concentrations of nitrate in unimpacted fresh waters are typically less than 5 mg/L of nitrate nitrogen (22 mg NO3/L nitrate) [7]. Interest is centred on nitrate concentrations for various reasons. Most importantly, high nitrate levels in waters to be used for drinking will render them hazardous to infants as they induce methaemoglobinaemia (“blue baby” syndrome). The nitrate itself is not a direct toxicant but is a health hazard because of its conversion to nitrite, which reacts with blood haemoglobin to cause methaemoglobinaemia. Hence, 50 mg/L nitrate (11 mg/L of nitrate-nitrogen) is set as Guideline value for nitrate in drinking water [17- 19]. The values recorded in this study were well below the guideline value suggesting that water from the dam is considered safe for drinking. In aquaculture, nitrate is considered a less serious environmental problem, it can be found in relatively high concentrations where it is relatively nontoxic to aquatic organisms, but stimulates the growth of plankton and water weeds that provide food for fish. This may increase the fish population, but when concentrations become excessive, and other essential nutrient factors are present, eutrophication and associated algal blooms can become a problem. Nitratenitrogen levels below 90 mg/L have benn reported to have no effect on warm-water fish [7]. Similarly, very low nitrite (
 ) concentrations were recorded in the dam water far below the recommended guideline value in drinking water. In unpolluted surface water, nitrite exists normally in very low concentrations below 0.03 mg/L
 . The significance of nitrite (at the low levels often found in surface waters) is an indicator of possible sewage pollution and as earlier mentioned, it is of concern for its toxicity. There is, accordingly, a stricter limit (3.0 mg/L
  short-term exposure; 0.2 mg/L long-term exposure) for nitrite in drinking waters [17]. Nitrite is extremely toxic to aquatic life; the toxic effects result from impairment of oxygen transport and cause acute anoxia, loss of equilibrium and mortality [7,30]. However, nitrite-nitrogen levels below 0.5 mg/L seem to have no effect on warm-water fish [7].
Concentrations of phosphate in the dam water ranged from 0.08 - 0.25 mg/L. Phosphorus from where phosphate is derived occurs widely in nature in plants, in microorganisms, in animal wastes; and large quantities of phosphate are applied as fertilizers in agriculture for which runoff from this area will often contains elevated concentrations of phosphate [7,18]. Typical phosphate concentrations in surface waters range from 0.001 mg/L in unpolluted water to 0.30 mg/L or more in nutrientenriched waters, although 0.10 mg/L lower than values recorded in the dam lake is the recommended maximum concentration for rivers and streams [7]. The significance of phosphorus in water is principally in regard to the phenomenon of eutrophication of lakes along with nitrogen as nitrate. Natural dissolved phosphates are considered to be largely non-toxic, although certain manmade organophosphates do have toxic effects. It is, however, likely that high concentrations of dissolved phosphate may lead to osmotic stress, as is the case with high nitrate concentrations [7].
Very low sulphate concentrations (4.37 - 6.50 mg/L) were recorded in the dam water compared to 250 mg/L guideline value for drinking water [18,19,28], while sulphide ion was not detected in the water samples. Sources of sulphate in the water could be associated with soil mineralogy with possibly little contribution from anthropogenic activities. Sulphates exist in nearly all natural waters, the concentrations varying according to the nature of the terrain through which they flow. No healthbased guideline is proposed for sulphate, but its presence in drinking-water can cause noticeable taste, and very high levels might cause a laxative effect especially with the presence of magnessium and sodium.
Comparison of the physico-chemical characteristics of the dam water samples with the values in Prat classification of surface water quality (Table 4) [9], revealed that the dam water falls mostly between “excellent” and “acceptable” quality based on mean value of individual indicator parameter, except for BOD that was in the “polluted class”. The high BOD level, colur and turbidity calls for caution in the adoption of water treatment process for potable and domestic water supply.
3.2. Dam Water Microbiology
The results of the microbiological examination of the dam water showing total heterotrophic bacteria count, total coli form and Escherichia coli cells for the dry and wet seasons’ monitoring are also presented in Tables 1-3. Higher values were recorded during the wet season than in the dry season, attributable to influx through runoff of microorganisms originating from vegetation decay, municipal sewage, garbage, domestic and feacal waste [31] into the Owena river body supplying the dam. The microbial values recorded in the dam water body represent high bacteria load compared to the recommended standards for drinking water [17-19,31,32]. This condition constitutes a threat to end users, thus suggesting adequate disinfection process before distribution for domestic and industrial uses.
Most aquatic bacteria are free-living and perform beneficial functions such as the decomposition of organic matter. A few species are opportunistic pathogens and cause diseases in fish, particularly under conditions of stress and immune deficiency. Symptoms of most bacterial diseases include fish not feeding well and swimming erratically. Low levels of dissolved oxygen, thermal stress, high concentrations of nitrogenous metabolites are the principal causes which render fish susceptible to bacterial diseases [7]. However, there is dearth of information in scientific literatures to show that E.coli affects the growth, reproduction, health or survival of fish. In India, for instance fish are cultured in sewage ponds, with no detrimental effects, but fish grown in wastewater harbour micro-organisms, some of which are pathogenic and may infect consumers and handlers [7].
3.3. Heavy Metal Levels in Dam Water
Tables 5 presents the concentrations of heavy metals analysed in the dam water for both wet and dry seasons. Statistical analysis of the data showed pronounced significant difference (p < 0.05) in the mean values between the wet and dry season for Pb, Cd, Cu, Cr, Ni, Mn, Zn, whereas Fe showed no significant difference.
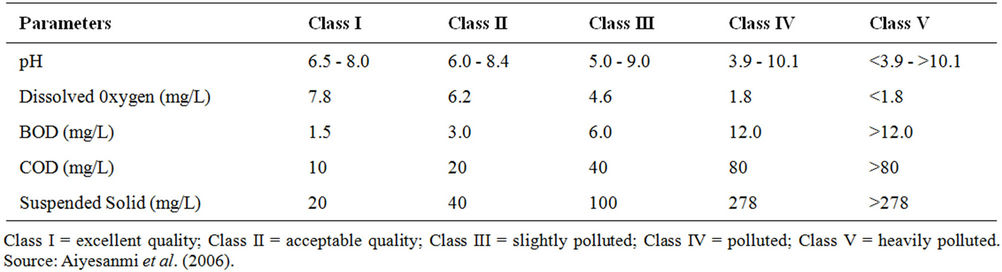
Table 4. Some parameters (indicative of cross organic pollution) used in classification of surface water quality.
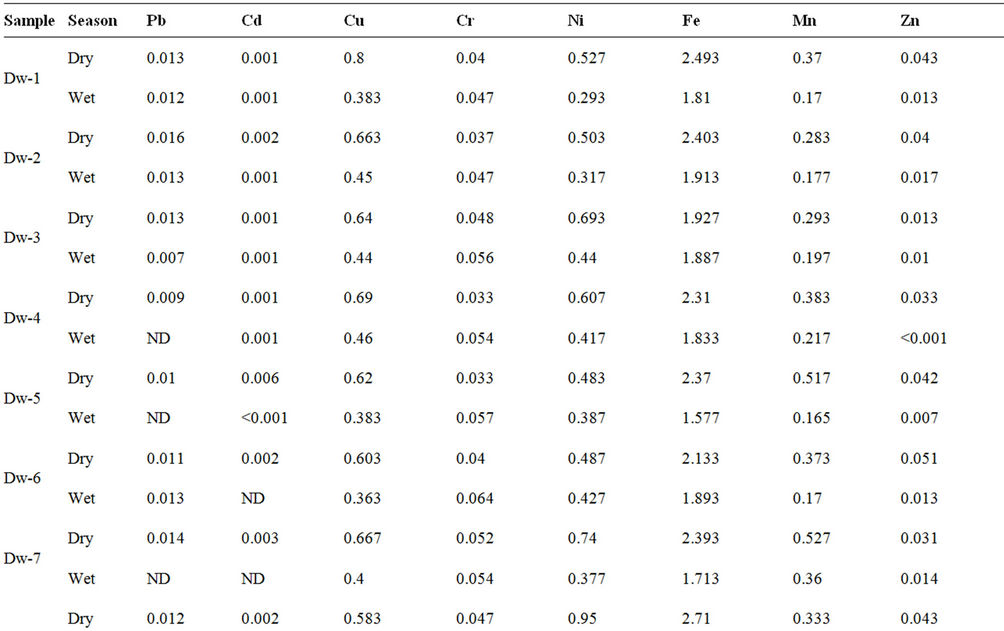
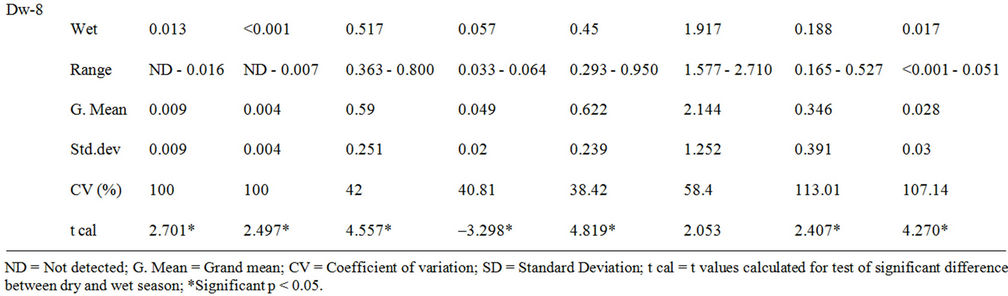
Table 5. Heavy metals concentrations (mg/L) in Owena multi-purpose dam water.
Similar observation was reported on the study of heavy metals in Ureje dam in Ado-Ekiti by Adefemi et al. [33], in Kanji dam [34] and other studies on surface water [11,35,36]. This trend could be attributed to a combination of many factors including water dilution, precipitation and adsorption of some metals in suspended particulates during the wet season; and also local concentration of metals via water evaporation from water body during the dry season [11,35,37].
The concentration of the anlysed heavy metals in mg/L was in the order of Fe > Ni > Cu > Mn > Cr > Zn > Pb > Cd. Their presence in natural waters is a combination of contribution from weathering of rocks and minerals, dumpsite leachates, sewage effluents and farming activities [11,12]. Most importantly, the high level of iron content in the water has no identifiable point source though, it has been reported that iron occurs at high levels in Nigeria soils and could manifest in surface waters that flow over them [11,38].
Comparison of the concentrations of the analysed metals in the dam water with guideline values for drinking water [17-19,28] showed compliance with Pb, Cd, Cu, Cr, and Zn, while Fe, Ni and Mn recorded higher concentrations than their guideline values. Toxic effects have resulted from the ingestion of large quantities of iron, but there is no evidence to indicate that concentrations of iron commonly present in food or drinking water constitute any hazard to human health, hence, a maximum acceptable concentration has not been set. At concentrations above 0.3 mg/L (drinking water standard), however, iron can stain laundry and plumbing fixtures and produce undesirable tastes in beverages. The precipitation of excessive iron impacts an objectionable reddishbrown colour to water and may also promote the growth of certain microorganisms, leading to the deposition of a slimy coating in water distribution pipes. [17,18,28]. Manganese is one of the most abundant metals in the Earth’s crust, usually occurring with iron and is generally present in natural surface waters as dissolved or suspended matter at concentrations below 0.05 mg/L [18]. The aesthetic objective for manganese in drinking water is 0.05 mg/L [18,19,28] and its in drinking water supplies may be objectionable for a number of reasons. At concentrations above 0.15 mg/L, manganese stains plumbing fixtures and laundry and produces undesirable tastes in beverages. As with iron, the presence of manganese in water may lead to the accumulation of microbial growths in the distribution system. Even at concentrations below 0.05 mg/L, manganese may form coatings on water distribution pipes that may slough off as black precipitates. Manganese at the recommended limit of 0.05 mg/L is not considered to represent a threat to health, and drinking water with much higher concentrations has been safely consumed [17]. The safe limits of different metals recommended to protect the fish in intensive aquaculture are Pb < 0.020 mg/L, Cd < 0.0005 mg/L in soft water; Cd < 0.005 mg/L in hard water, Cu < 0.0006 mg/L in soft water and < 0.030 mg/L in hard water; and Zn < 0.005 mg/L [39]. However, these metals among others at high concentrations could impair the health of fish [7,18,40], while bioaccumulation in the body of fish and other aquatic organisms even at low concentration is a common occurence [37,41-43].
4. Conclusion
The physicochemichal characteristics of the dam water samples revealed a fresh water environment with low chemical pollutants burden. However, high turbidity and colour values compared with drinking water standards were recorded. Seasonal variation in most of the measured water quality parameters was significant. Comparison of the water quality characteristics with the values in Prat classification of surface water quality revealed mostly between “excellent” and “acceptable” quality. Microbial burden of the dam water was high compared to the recommended standards for drinking water, thus constituting a serious hazard to public health, as their presence is indicative of a possible presence of micro organism associated with water-borne diseases, suggesting the need for adequate disinfection process before distribution for domestic and industrial uses. The distribution pattern of heavy metals levels in the water column suggests more of lithological origin with possible contribution from anthropogenic influences through runoff into the water body. Although, the levels of the metals in the water body were low not to cause trepidation to both the aquatic lives and human health, the cumulative effect through bioaccumulation could be of concern in the future, hence calling for regular monitoring of the dam and control of anthropogenic input into the water body.
5. Acknowledgements
The authors wish to acknowledge the assistance of the Management of Benin-Owena River Basin Authority for providing logistics during the sampling campaigns.
REFERENCES
- C. M. A. Ademoroti, “Environmental Chemistry and Toxicology,” Foludex Press Ltd., Ibadan, 1996.
- R. F. Packham, “Drinking Water Quality and Health,” In: R. M. Harrison, Ed., Pollution, Causes, Effects and Control, 3rd Edition, The Royal Society of Chemistry, London, 1996, pp. 52-65.
- World Health Organisation, “Water and Sanitation: Protection of the Human Environment,” World Health Organisation, Geneva, 2001.
- V. Apina, “Agriculture’s Influence on Water Quality in Lower Northeastern Thailand,” Proceedings of the Regional Workshop on Water Quality Management and Control of Water Pollution in Asia and the Pacific, Bangkok, 26-30 October 1999, pp. 175-180.
- S. A. Baig, Q. Mahmood, B. Nawab, A. Hussain and M. Nafees, “Assessment of Seasonal Variation in Surface Water Quality of Chitral River, North West Frontier Province,(NWFP), Pakistan,” World Applied Science Journal, Vol. 9, No. 6, 2010, pp. 674-680.
- B. T. Hart, “Water Quality Guidelines,” In: F. R. Burden, D. Donnert, T. Godish and I. D. McKelvie, Eds., Environmental Monitoring Handbook, McGraw-Hill Co. Boston, 2004, pp. 1.1-1.26.
- South African Water Quality Guidelines, “Agricultural Water Use: Aquaculture,” 2nd Edition, Vol. 6, Department of Water Affairs and Forestry of South Africa, Pretoria, 1996, p. 185.
- F. Iqbal, M. Ali, A. Salam, B. A. Khan, S. Ahmad, M. Qamar and U. Kashif, “Seasonal Variations of Physicochemical Characteristics of River Soan Water At Dhoak Pathan Bridge (Chakwal), Pakistan,” International Journal of Agriculture and Biology, Vol. 6, No. 1, 2004, pp. 89-92.
- A. F. Aiyesanmi, K. O. Ipinmoroti and C. E. Adeeyinwo, “Baseline Water Quality Status of Rivers Within Okitipupa Southeast Belt of the Bituminous Sands Field of Nigeria,” Nigerian. Journal of Science, Vol. 40, 2006, pp. 62-71.
- APHA, AWWA and WPCF, “Standard Methods for the Examination of Water and Wastewater,” 20th Edition, Published Jointly by American Public Health Association, American Water Works Association and Water Polition Control Federation,Washington, 1998.
- A. F. Aiyesanmi, “Baseline Concentration of Heavy Metals in Water Samples from Rivers Within Okitipupa Southeast Belt of the Nigerian Bitumen Field,” Journal of Chemical Society of Nigeria, Vol. 31, No. 1-2, 2006, pp. 30-37.
- O. S. Adefemi, O. Olaofe and S. S. Asaolu, “Assessment of the Physicochemical Status of Water Samples from Major Dams in Ekiti State, Nigeria,” Pakistan Journal of Nutrition, Vol. 6, No. 6, 2007, pp. 657-659. doi:10.3923/pjn.2007.657.659
- S. I. Efe, F. E. Ogban, M. Horsfall and E. E. Akporhonor, “Seasonal Variations of Physicochemical Characteristics in Water Resources Quality in Western Niger Delta Region, Nigeria,” Journal of Applied Science and Environmental Management, Vol. 9, No. 1, 2005, pp. 191-195.
- S. Najafpour, A. F. M. Alkarkhi, M. O. A. Kadir and G. D. Najafpour, “Evaluation of Spatial and Temporal Variation in River Water Quality,” International Journal of Environmental Research, Vol. 2, No. 4, 2008, pp. 349- 358.
- H. I. Petters and O. Odeyemi, “Physicochemical Quality of Mokuro Dam in Ile-Ife, Nigeria,” Water International, Vol. 10, No. 4, 1985, pp. 162-167. doi:10.1080/02508068508686347
- A. F. Aiyesanmi, K. O. Ipinmoroti and C. E. Adeeyinwo, “Surface Water Quality and Environmental Health in the Okitipupa Southeast Belt of the Bituminous Sands Field of Nigeria,” In: A. N. Nosike and J. A. Opara, Eds., Environmental Health in the Niger Delta, JCF Publising, Co., Port Harcourt, 2003, pp. 100-107.
- World Health Organisation, “Guidelines for Drinking— Water Quality,” 3rd Edition, World Health Organisation, Geneva, 2008.
- Ireland Environmental Protection Agency, “Parameters of Water Quality: Interpretation and Standards,” Environmental Protection Agency, Johnstown, 2001, p. 133.
- United State Environmental Protection Agency, “Current Drinking Water Standards,” Office of Groundwater and Drinking Water, United State Environmental Protection Agency, Government Printing Office, Washington DC, 2002.
- M. W. LeChevallier, T. M. Evans and R. J. Seidler, “Effect of Turbidity on Chlorination Efficiency and Bacterial Persistence in Drinking Water,” Applied Environmental Microbiology, Vol. 42, No. 1, 1981, pp. 159-167.
- Health Canada, “Guidelines for Canadian Drinking Water Quality: Supporting Documentation—Turbidity,” Water Quality and Health Bureau, Healthy Environments and Consumer Safety Branch, Health Canada, Ottawa, 2003, pp. 1-13.
- I. D. McKelvie, “In Situ Measurement of Physicochemical Water Quality Parameters,” In: F. R. Burden, D. Donnert, T. Godish and I. D. McKelvie, Eds., Environmental Monitoring Handbook, McGraw-Hill Co., Boston, 2004, pp. 3.1-3.21.
- H. T. M. Bowen, “Environmental Chemistry of the Elements,” Academic Press, Lodon, 1979, pp. 13-29.
- American Water Works Association Research Committee on Coagulation, “Coagulation-Filtration Practice as Related to Research. A Committee Report,” Journal of American Water Works Association, Vol. 66, No. 8, 1974, pp. 502-511.
- Y. Kott, E. M. Nupen and W. R. Ross, “The Effect of pH on the Efficiency of Chlorine Disinfection and Virus Enumeration,” Water Research, Vol. 9, No. 10, 1975, pp. 869- 877. doi:10.1016/0043-1354(75)90034-2
- R. W. Tuthill, “Explaining Variations in Cardiovascular Disease Mortality within a Soft Water Area’, U7710 PB- 263 482/2S1, Office of Water Research and Technology, Division of Public Health, U.S. Department of Commerce, Dublin, 1976.
- M. Ali, A. Salam, A. Azeem, M. Shafique and B. A. Khan, “Studies on the Effect of Seasonal Variations on Physical and Chemical Characteristics of Mixed Water from Rivers Ravi and Chenab at Union Site in Pakistan,” Journal of Research (Science)—Bahauddin Zakariya University, Multan, Vol. 2, 2000 pp. 1-17.
- European Union’s Drinking Water Standards, Council Directive 98/83/EC on the Quality of Water Intented for Human Consumption, Geneva, 1998.
- World Health Organisation, “Chloride in Drinking-Water,” Background Document for Preparation of WHO Guidelines for Drinking-Water Quality, World Health Organization, Geneva, 2003.
- R. M. Palachek and J. R. Tomasso, “Toxicity of Nitrite to Channel Catfish (Ictalurus punctatus), Tilapia (Tilapia aurea) and Largemouth Bass (Micropterus salmoides): Evidence for a Nitrite Exclusion Mechanism,” Cananadian Journal of Fish and Aquaculture Science, Vol. 41, No. 12, 1984, pp. 1739-1744. doi:10.1139/f84-214
- Health Canada, “Guidelines for Canadian Drinking Water Quality: Guideline Technical Document—Heterotrophic Plate Count,” Water Quality and Health Bureau, Healthy Environments and Consumer Safety Branch, Health Canada, Ottawa, 2006, pp. 1-8.
- Health Canada, “Guidelines for Canadian Drinking Water Quality: Guideline Technical Document—Escherichia coli,” Water Quality and Health Bureau, Healthy Environments and Consumer Safety Branch, Health Canada, Ottawa, 2006, pp. 1-10.
- O. S. Adefemi, O. Olaofe and S. S. Asaolu, “Concentration of Heavy Metals in Water, Sediment and Fish Parts (Illisha africana) from Ureje Dam, Ado-Ekiti, Ekiti State, Nigeria,” Journal Biololgy and Physical Sciences, Vol. 3, 2004, pp. 111-114.
- I. A. Amoo, O. T. Adebayo and A. J. Lateef, “Evaluation of Heavy Metals in Fishes, Water and Sediments of Lake Kainji, Nigeria,” Journal of Food, Agriculture and Environment, Vol. 3, No. 1, 2005, pp. 209-212.
- S. S. Asaolu, K. O. Ipinmoroti, C. E. Adeeyinwo and O. Olaofe, “Interrelationship of Heavy Metal Contamination in Water, Sediment and Fish of Ondo State Coastal Waters,” African. Journal of Science, Vol. 1, 1997 pp. 55-60.
- H. Karadede and E. Unlu, “Concentrations of Some Heavy Metals in Water, Sediment and Fish Species from the Atatu¨rk Dam Lake (Euphrates), Turkey,” Chemosphere, Vol. 41, No. 9, 2000, pp. 1371-1376. doi:10.1016/S0045-6535(99)00563-9
- A. O. Ubalua, U. C. Chijioke and O. U. Ezeronye, “Determination and Assessment of Heavy Metal Content in Fish and Shellfish in Aba river, Abia State, Nigeria,” KMITL Science and Technology Journal, Vol. 7, No. 1, 2007, pp. 16-23.
- A. F. Aiyesanmi, “Assessment Of Heavy Metal Contamination of Rodertkiri Oil Field’s Soil, Nigerian Journal of Soil Science, Vol. 15, 2005, pp. 42-46.
- G. A. Wedemeyer, “Physiology of Fish in Intensive Culture Systems,” Chapman and Hall, New York, 1996.
- R. Eisler, “Lead Hazards to Fish, Wildlife and Invertebrates: A Synoptic Review,” Biological Report, US Fish and Wildlife Service, Sacramento, 1988
- B. C. O. Okoye, “Heavy Metals and Organism in the Lagos Lagoon,” International Journal of Environmental Studies, Vol. 37, No. 4, 1991, pp. 285-292. doi:10.1080/00207239108710641
- A. S. Abdel-Baki, M. A. Dkhil and S. Al-Quraishy, “Bioaccumulation of Some Heavy Metals in Tilapia Fish Relevant to their Concentration in Water and Sediment of Wadi Hanifah, Saudi Arabia,” African Journal of Biotechnology, Vol. 10, No. 13, 2011 pp. 2541-2547.
- M. Boran and I. Altınok, “A Review of Heavy Metals in Water, Sediment and Living Organisms in the Black Sea,” Turky Journal of Fish and Aquatic Science, Vol. 10, 2010, pp. 565-572.
NOTES
*Corresponding author.