Smart Grid and Renewable Energy
Vol.2 No.4(2011), Article ID:8271,6 pages DOI:10.4236/sgre.2011.24037
Study and Implementation on Batteries Charging Method of Micro-Grid Photovoltaic Systems
![]()
School of Electrical & Electronic Engineering, Hubei University of Technology, Wuhan, China.
Email: *wtz315@163.com
Received September 5th, 2011; revised September 26th, 2011; accepted October 3rd, 2011.
Keywords: Micro-Grid Photovoltaic System, Decreased Charging Current Based on SOC, Charging Rate, Reduction Coefficient
ABSTRACT
In the micro-grid photovoltaic systems, the random changes of solar radiation enable lead-acid batteries to experience low SOC (State of Charge) or overcharged for periods of time if directly charged with such traditional methods as decreased charging current, which will reduce lifetime of batteries. What’s more, it’s difficult to find a proper reduction coefficient in decreasing charging current. To adapt to the random changes of circumstance and avoid selecting the reduction coefficient, a new fast charging method named decreased charging current based on SOC is proposed to apply into micro-grid photovoltaic systems. It combines batteries’ SOC with the maximum charging voltage to determine the charging rate without strictly selecting reduction coefficient. By close-loop current control strategy and related scheme, the experiment proves the new method is feasible and verifies that, comparing with decreased charging current, the improved method make batteries’ SOC reach 100% in shorter time as well as the temperature of batteries raise more slowly.
1. Introduction
Micro-grid photovoltaic system is capable of operating normally under the condition of connected grid or offgrid, featuring with small scale, low voltage class and easy management. More, energy storage device plays a significant role in maintaining the dynamic power balance in entire system [1]. Lead-acid batteries generally act as the main energy storage in micro-grid photovoltaic system due to its low cost and easy of availability. The whole structure of micro-grid photovoltaic system is shown in Figure 1. Unidirectional arrow and bidirectional arrow respectively respect energy flow one direction and both directions. Contact point 1 in the composite switch works if the system connects grid, otherwise, contact point 2 works. Given the public grid is out of work, the system will continually power the significant load for a few hours. Batteries, PV arrays and inverter compose a power generation system for the significant load.
Random changes of solar radiation make batteries experience a low SOC for periods of time, which may lead to acid stratification or produce sulphate. Therefore, the life of batteries in photovoltaic system is shorter than any other application area. It is essential to search a charging method that keeps the batteries in higher SOC within shorter time when the output energy of PV array is sufficient [2,3]. The paper firstly analyzes the advantages and disadvantages among the traditional charging methods for lead-acid batteries in photovoltaic system. Secondly it proposes the decreased charging current based on SOC evaluated by modified dynamic voltage model. At last, it proves the new method is feasible by close-loop current control strategy and related scheme in 10 KW micro-grid photovoltaic inverter prototype.
2. Traditional Charging Method in Photovoltaic System
2.1. Three-Stage Charging
Three-stage charging is a proper charging method applied into photovoltaic system. The method delivers the whole energy to batteries in three steps [4]. The first step, the batteries are charged 70% - 80% in constant current. The second step replenishes the remaining 20% - 30%. Floating charging is used in the last stage to compensate the self-discharge of batteries. Three stage charging makes the batteries SOC reach 100% in short time, but problems
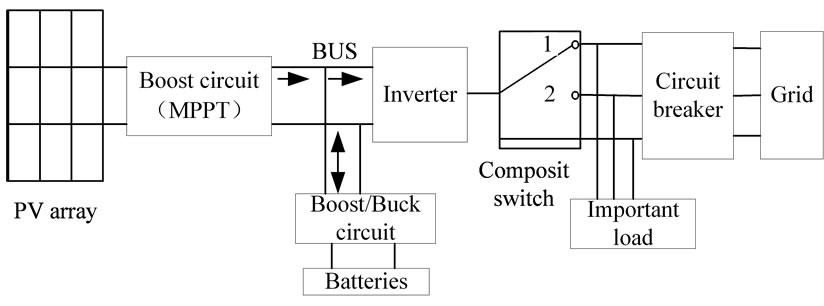
Figure 1. Structure of micro-grid photovoltaic system.
like over-charging and high rising temperature for batteries still exist in this method.
2.2. Pulse Charging
Pulse charging eliminates polarization to avoid generating gas by intermittent time and reverse current, and the temperature of batteries rise slowly. However, the charging time will be extended because no energy transfers to batteries during intermittent time. That is to say, in the same solar radiation, pulse charging method enables the batteries to maintain lower SOC and influences the life of batteries.
2.3. Trickle Charging
Trickle charging charges the batteries with small constant current, which is below or equal to  of lead-acid batteries (
 is the charging rate or charging current with times of battery’s nominal capacity. If the nominal capacity of battery equals to 100 Ah, charging rate is
 , or charging current equals to 1 A.) The method is used to compensate batteries’ self-discharge or recharge the batteries after state of deep discharge. Trickle charging can protect lead-acid batteries and extend its life.
2.4. Decreased Charging Current
The principle of decreased charging current is to make the real charging current as close as maximum acceptable current [5,6], as shown in Figure 2. The maximum charging voltage set to . The concrete process of charging is as follows: first charge the batteries with the maximum charging rate
  and change into
  when the batteries’ voltage reaches to
 . Then charging rate becomes
  in turn. It indicates batteries’ SOC reach to 100% once the charging current decreases to the given value. The method comparatively makes the batteries reach full capacity in shot time without accurately gauging batteries’ current; also it reduces the current sensor accuracy required and the cost for circuitry. Nonetheless, to avoid overcharging, the reduction coefficient
  is difficult to select, because the change of SOC is required below 1% of nominal capacity
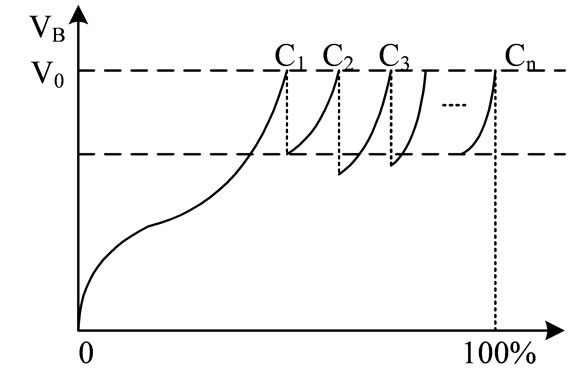
Figure 2. Principle of decreased charging current.
( : the charging rate at time
![]() ;
; : the charging rate at the time
 ). The main disadvantage of this method is reduction coefficient
  selected too high or low may lead to batteries overcharge or insufficiently charge, which will influence the batteries’ life.
3. Principle of Decreased Charging Current Based on SOC
3.1. Estimation of Batteries’ SOC
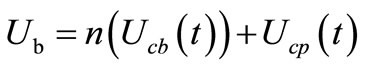
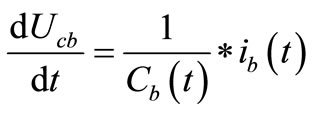
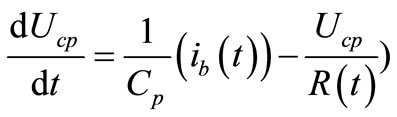
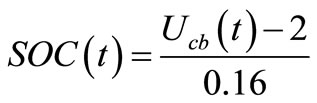
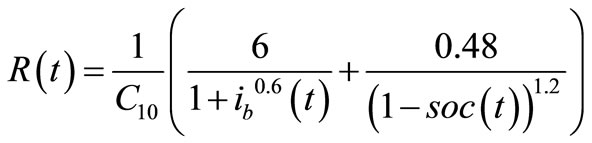
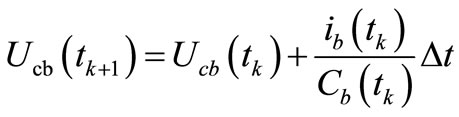
To solve the problem caused by reduction coefficient , a scheme is proposed to solve the problem: Combine the charging maximum voltage with SOC estimated by a suitable model to determine the charging rate of each stage. Up to now, lots of manpower and material resources are put into measuring the parameter related to SOC such as temperature, current, voltage and internal resistance. Estimation of batteries’ SOC entails mass experimental data to assure the accuracy and reliability, for the relationship between battery parameter and SOC is complex. The common models for widely used are ideal model, modified ideal model, Thevenin battery model and dynamic battery voltage model. The paper adopts modified dynamic battery voltage model, using resistance and capacitors to express the dynamic characteristic during the process of charging [7]. The equivalent electric circuit is given in Figure 3 Voltage of battery
  is expressed as:
 (1)
(1)
 (2)
(2)
 (3)
(3)
 (4)
(4)
 ,
,
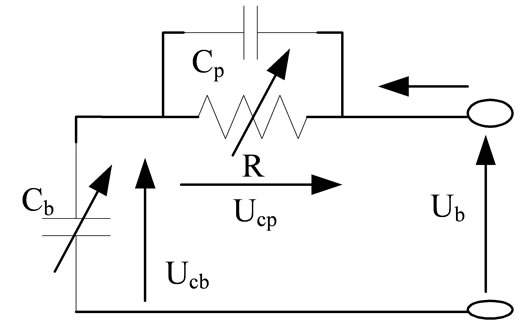
Figure 3. Equivalent circuit for voltage model.
 ,
,
 : battery current (A),
 : battery voltage (V),
 : number of serial cells,
 : polarization voltage (V),
 : electromotive force (V),
  = 2000 F: polarization capacitor (F),
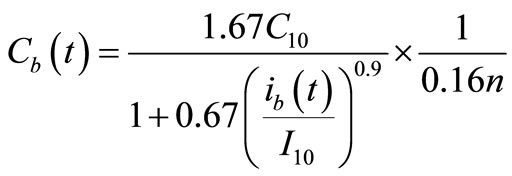
 : nominal capacity after 10hours charging (Ah) ,
 :
:  related or charging current is equal to nominal capacity/10 (A) .
Discrete equations (5) and (6) are given as:
 (5)
(5)
 (6)
(6)
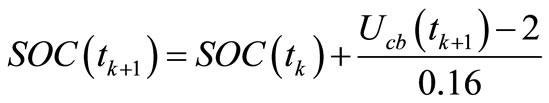
Conclusions can be deduced from equations (5) and (6): SOC is evaluated by measuring batteries’ current in the process of charging.
Once the output energy of PV array is low, batteries have to stop charging anyhow. Charging rate is determined through current SOC before the next charging process starts. Open circuit voltage method is used to get the current SOC, and Table 1 lists the link between OCV and SOC for lead-acid battery CB121000B12V [8].
3.2. Decreased Charging Current Based on SOC
The relation between 12V batteries’ SOC and voltage of lead-acid batteries under different charging rate is shown as Figure 4 [9]. Set the maximum charging voltage as 14.2 V. The concrete process of charging is: step1, charge batteries with the rate of  or 20 A current from point A to point B. If the battery voltage reaches to

Table 1. Link between OCV and SOC for CB121000B12 V 100 AH.
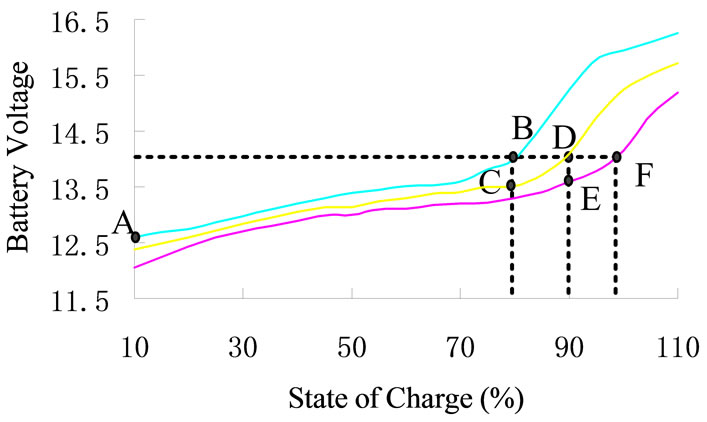
Figure 4. Principle of decreased charging current for 12V batteries.
maximum value and the SOC is 80% through estimation, turn to step2 automatically. Step2 is from point C to point D in which batteries are charged with the rate of  or 10 A current. When the battery voltage again reaches to maximum value and SOC is 90% through estimation, turn to step3. The charging rage is
  between point E and point F in this step. Stop charging if batteries’ voltage reaches to 14.2 V next time and SOC is 100%.
Suppose batteries need to charge again after interrupttion, the charging rate can be determined by Figure 4 and Table 1: Charging rate is , if SOC lower than 80%; charging rate is
  if SOC ranges from 80% to 90%; charging rate is
  if SOC ranges from 90% to 100%.
4. Implementation on Decreased Charging Current Based on SOC
4.1. Main Circuit for Batteries Charging
Bi-directional half bridge DC-DC converter has the trait of easy controlling unit, small endured current for device, low cost of conduction and so on. It can be used for variable systems, for instance, electric vehicle, UPS and photovoltaic or wind power [10]. The main diagram of charging and discharging for batteries in 10 KW micro-grid photovoltaic system is given as Figure 5.  represents the ambient temperature and
  represents batteries’ temperature. To prevent filter capacitor from explosion or avoid batteries short-circuit due to opposite polarity cross in circuit, the filter capacitor is ignored [11]. Concrete analysis for batteries charging process: capacitor
 , MOSFET
 , inductor
  and batteries
  comprise a loop if MOSFET
  turns on the free-wheel diode
  will be cut off and inductor
  storages energy; if
  cuts off, free-wheel diode
  turns on and loop is composed by inductor
  and batteries
 .
.
Twenty lead-acid batteries are in series to comprise the battery stack. Patterns for main device in charging and
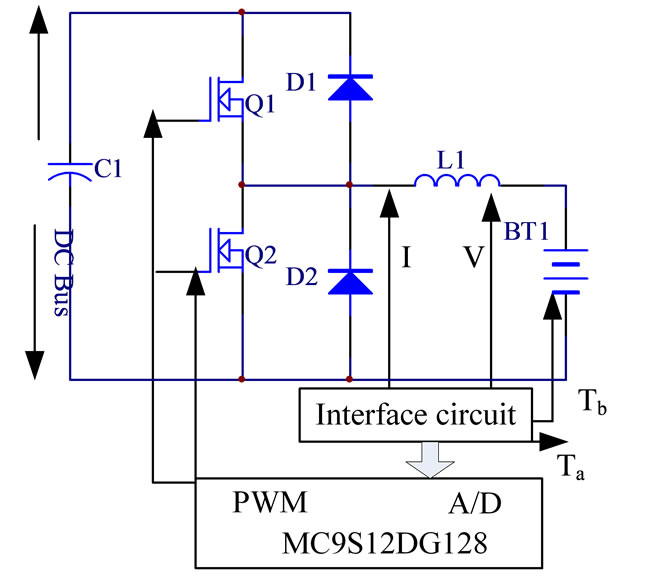
Figure 5. Main charging and discharging circuit.
discharging circuit are introduced: MC9S12DG128 produced by Freescale firm is chosen as main controlling chip, IPM module is PM75DSA120, free-wheel diode is ultra-fast soft recovery diode module DWM2F60N120, the value of inductor is 2.5 mH, capacitor is used for DC bus is 2200 uF. Take current sensor LT308-SP8 and voltage sensor LV25-P produced by LEM to sample batteries’ current and voltage, DS18B20 as temperature sensor to sample batteries’ temperature and ambient temperature.
4.2. Controlling Strategy for Charging
To avoid lead-acid batteries generating gas during process of charging, work mode of inductor should be set in non-continuous mode and Figure 6 shows the wave of charging current. Average current is required to follow the change of reference current according to controlling strategy, therefore, Pulse Width Modulation (PWM) controlling method is chosen [12,13]. Common controlling method of PWM includes hysteresis comparison and triangular comparison. The frequency of switch varies in hysteresis comparison, however, frequency for MOSFET in triangular is fixed and equal to the carrier’s. If the duty rate of MOSFET is set a given value, the charging time will postpone as the frequency rises [14]. Principle of triangular wave comparison is shown in Figure 7 and the carrier’s frequency sets as 6KHz.  represents reference current, which compares with real current to get an error. Presetting parameter method is used to get PI (Proportional-integral) value through PI controller. By comparing the output of PI controller with triangular carrier, PWM signal is acquired and used for controlling the turn on or off of MOSFET.
 : Trickle current;
 : Maximum batteries’ voltage at 25℃;
 : Minimum DC bus voltage when the output energy of PV array is enough;
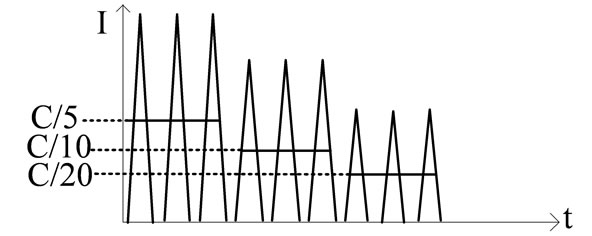
Figure 6. Current wave in charging process.
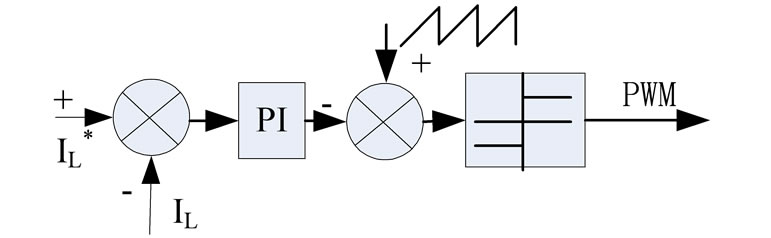
Figure 7. Principle of triangular wave comparison.
 : Minimum DC bus voltage when the output energy of PV array is lacking.
The maximum batteries’ voltage set as 284 V at 25℃. Formula calculating maximum charging voltage  is given as equation (7).
 , the number of cells in batteries stack, equals to 120, α = –3.5 mV/˚C/cell is the compensating coefficient for temperature.
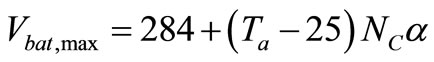 (7)
(7)
Control algorithm flowchart about charging is expressed as follows, and Table 2 shows the initial value for program variable.
Step1: Initiate MCU system and sampling chip system;
Step2: Measure batteries’ voltage and evaluate the SOC based on OCV-SOC curve. If SOC > 100%, turn to Step15;
Step3: Determine the initial charging rate according to the range of SOC and set reference charging current ;
;
Step4: Sampling bus voltage, if , turn to Step11;
Step5: Measure ambient temperature and calculate ;
;
Step6: Enable MCU output PWM to control  turnon and
  close off;
Step7: Control the charging current with closedloop;
Step8: Measure batteries’ voltage and current and evaluate SOC based on dynamic battery model;
Step9: If SOC > 100%, turn to Step15;
Step10: If  or SOC not reach to the
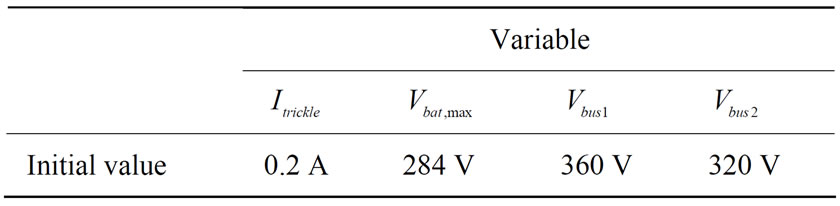
Table 2. Initial value for program variable.
given value, then turn to Step4;
Step11: Correct the charging rate and turn to Step4;
Step12: If , turn to Step15;
Step13: Set the reference current as , turn to Step6, Step7, Step8 and Step9;
Step14: Turn to Step4;
Step15: Stop charging.
The feature of control algorithm is: 1) Judge the output energy of PV array is enough or not by sampling the DC bus voltage in real-time, then using different charging methods. Decreased charging current based on batteries’ SOC is selected to charge batteries when the energy is sufficient, otherwise, trickle current charging method is selected. 2) Attenuate the requirement of reduction coefficient by combining the setting maximum batteries’ voltage with SOC to determine charging rate in each stage. 3) The setting maximum batteries’ voltage varies as the ambient temperature changes, which avoids overcharging or insufficient charging.
5. Experimental Result and Analysis
A solar simulator management system replaced the PV array in real-time is selected for experiment in 10 KW micro-grid photovoltaic inverter prototype [15]. A stationary DC halogen lamp whose brightness is adjustable and programmed acts as sun to illuminate the PV array in the solar simulator. Figure 8 shows the solar simulator measurements over the course of a simulated day. Initial batteries’ SOC is set to 65%, reduction coefficient  for both methods is 1/2, and maximum charging voltage and current in each stage for both methods are also equal. Batteries’ charging time and temperature are recorded respectively under the same solar simulator. With regard to decreased charging current, it denotes batteries’ SOC reach to 100% when the current drops to the minimal given value 5A. Figure 9 indicates that decreased charging current based on SOC enable batteries to reach full capacity earlier than decreased charging current. In Figure 10, under the same reduction coefficient
 , comparing with decreased charging current, temperature of
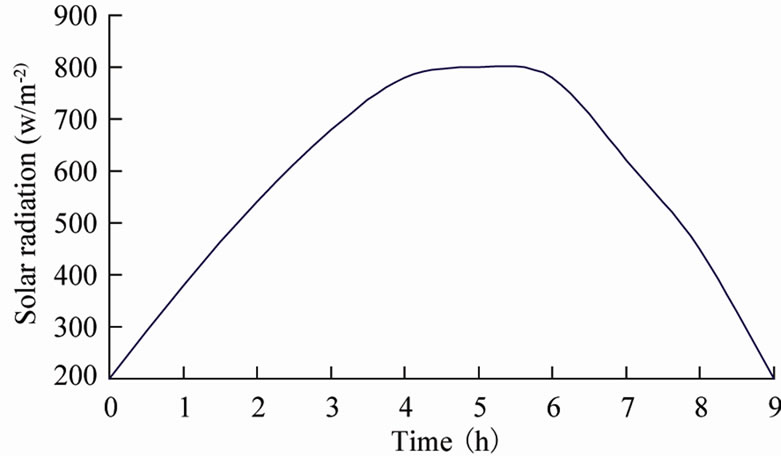
Figure 8. Solar radiation against time in solar simulator.
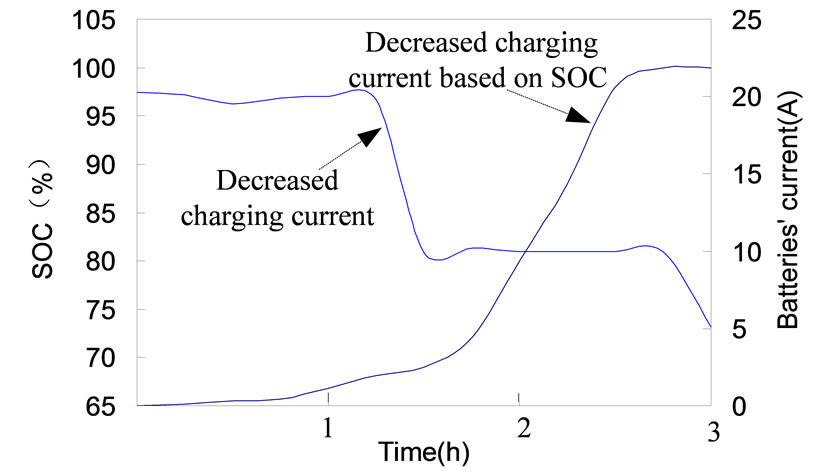
Figure 9. Batteries’ charging time of two methods.
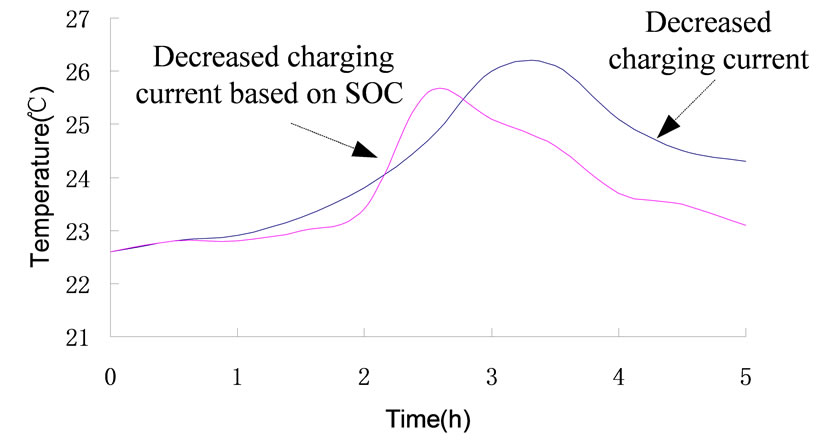
Figure 10. Batteries’ temperature of two methods.
batteries charged by decreased charging current based on SOC raises slowly and the peak value only appears at the full capacity.
Experimental result proves that decreased charging current based on SOC to be feasible and indicates that this method can maintain batteries with high state of charge in relatively shot time and decrease acid stratifycation. Moreover, the inductor of hardware circuit works with non-continuous mode, this greatly reduce the polarization and lengthen batteries’ life.
6. Conclusions
Decreased charging current based on SOC is able to adjust the charging rate according to batteries’ SOC without accurate reduction coefficient, as well as reduces charging time and adapts to the random changes of solar radiation. Once the batteries need to be charged again, the charging rate is determined by the relation between OCV and SOC, batteries will automatically transfer into related charging stage. To some extend, the method plays an important impact on how to distribute power among parts of micro-grid photovoltaic system.
7. Acknowledgements
X.Q gives great appreciation to the tutor (W.T.Z) who offers amount of suggestions during the revision task. Also, this work was supported by natural science foundation of Hubei province (research on soc estimation method and equalizing charging of lithium-ion battery for HEV. No. ZRY1530) and Hubei provincial education board (batteries modeling and study on soc estimation method in photovoltaic system. No. B20091403).
REFERENCES
- G. J. Zhang, X. Tang and Z. P. Qi, “Application of Hybrid Energy Storage System of Super-Capacitors and Batteries in a Micro-Grid,” Automation of Electric Power Systems, Vol. 34, No. 12, 2010, pp.85-87.
- J. H. Xue, Z. D .Yin and B. B. Wu, “Technology Research of Novel Energy Storage Control for the PV Generation System,” Proceedings of APPEEC 2009, AsiaPacific, Wuhan, 27-31 March 2009, pp.1-4.
- Z. Q. Wang, X. Li and G. Y. Li, “Energy Storage Control for the Photovoltaic Generation System in a Micro-Grid,” Proceedings of the 5th International Conference, Beijing, 20-22 September 2010, pp.1-5.
- S. Armstrong, M. E. Glavin and W. G. Hurley, “Comparison of Battery Charging Algorithms for stand Alone Photovoltaic Systems,” Proceedings of Power Electronics Specialists Conference of PESC 2008 IEEE, Rhodes, 15-19 June 2008, pp. 1469-1475.
- E. Koutroulis and K. Kalaitzakis, “Novel Battery Charging Regulation System for Photovoltaic Applications,” IEE Proceedings Electric Power Applications, Vol. 151, No. 2, 2004, pp. 191-197. doi:10.1049/ip-epa:20040219
- W. K. Zhang, “Fast Charging Method for Lead-Acid Batteries in Automobile,” Hunan Institute of Science and Technology, Vol. 18, No. 3, 2005, pp. 70-72.
- H. Fakham, D. Lu and B. Francois, “Power Control Design of a Battery Charger in a Hybrid Active PV Generator for Load-Following Applications,” IEEE Transaction on Industrial Electronics, Vol. 58, No. 1, 2011, pp. 85-94.
- T. D. Herder. “Design and Simulation of Photovoltaic Super System Using Simulink,” Senior Project, Electrical Engineering Department, California Polytechnic State University, San Luis Obispo, 2006.
- R. Perez, “Lead-acid Battery State of Charge vs. Voltage,” Home Power, Vol. 36, 1993, p. 67.
- J. Chen, “Research on House-Hold Photovoltaic Power Generation System Based on Bi-Directional DC/DC Converter,” Power Electronics and Drives Transmission, Jiangnan University, Wuxi, 2009.
- J. Xu, “Design and Development of Power Battery Charger,” Control Theory and Control Engineering, Tianjing University, Tianjing, 2008.
- X. Q. Wang and D. Zhang, “Carrier-Reversed Current Tracking PWM Control,” Science and Technology of West China, Vol. 8, No. 12, 2009, pp. 5-7.
- L. Xu and Y. X. Xie, “Summarization of Methods to Realize PWM Technology,” Power Supply Technologies and Applications, Vol. 8, No. 2, 2005, pp. 51-53.
- A. C. Hua and B. Z. Wei, “Charge and Discharge Characteristics of Lead-Acid Battery and LiFePO4 Battery,” Proceedings of International power Electronics Conference, Sapporo, 21-24 June 2010, p. 1481.
- W. T. Xie, “Research and Design of Novel PV-Array Simulator,” Power Electronics and Drives Transmission, Zhejiang University, Hangzhou, 2007.