Smart Grid and Renewable Energy
Vol.1 No.1(2010), Article ID:1943,11 pages DOI:10.4236/sgre.2010.11003
Performance Analysis of Low Head Hydraulic Air Compressor
![]()
1Mechanical Engineering Department, Faculty of Engineering at Rabigh, King Abdul-Aziz University, Jeddah, Saudi Arabia; 2Mechanical Power Department, High Institute of Energy, South Valley University, Aswan, Egypt; 3Egyptian Electricity Holding Company, Aswan, Egypt.
Email: walid_aniss@yahoo.com
Received April 19th, 2010; revised May 12th, 2010; accepted May 14th, 2010.
Keywords: Experimental, hydraulic air compressor, performance
ABSTRACT
Hydraulic Air Compressor (HAC) is a device which converts hydraulic energy to energy of compressed air. A better exploitation of this hydraulic resource is currently investigated. The aim of the current work is to analyze a low head open type HAC in terms of compression ratio and HAC efficiency. The performance of HAC is both experimentally and theoretically investigated for various air admission system parameters (air tube length and diameter), downcomer length and hydraulic head. The results are both presented and discussed. Variation of the mean diameter of air bubbles in the downward flow in the downcomer is both determined and investigated. The losses in the whole system are classified, investigated and its impact on HAC is discussed.
1. Introduction
A Hydraulic Air Compressor is a device that uses the energy of a descending flow of water to compress air by entraining the air in the water flow as shown in the work by Widden et al., [1].
Shapiro [2] described a thermodynamic analysis of hydraulic air compressor-gas turbine plant. He conducted a comparison between HAC-GT system and reference conventional gas turbine and hydroelectric power plants. He concluded that the novel system will have higher efficiency, lower cost, lower pollution production, and increased output compared to existing hydroelectric stations.
Bidini et al., [3] presented a numerical model of a HAC to perform both an energy analysis of the system and to study its capability of exploiting natural hydraulic sites. They suggested using of isothermal compression in HAC's for an efficient energy conversion in combination with widely regenerated GT plants.
Bidini et al., [4] reported a thermodynamic analysis of HAC-gas turbine energy conversion systems and compared their performance to conventional hydro-eclectic and gas turbine power plants. They concluded that the performance levels of such systems are higher comparable to those of combined cycle plants. They suggested performing further technical and environmental investigations.
Nishi [5] investigated replacing the compression process of a regenerative cycle by an isothermal compression process by using a hydraulic air compressor. He stated that by assuming conventional operating conditions and component characteristics, higher thermal efficiency of the new system was proved and that about 1.9 times greater output can be produced by the HAC-GT than by a conventional hydraulic power plant. In addition, he concluded that this system can be applied to improve the performance of existing hydraulic power plants as well as in planning new plants.
Rice and Wood [6] stated that HAC compresses gas at the expense of hydraulic energy by means of entrainment in a downward moving column of liquid with a subsequent separation of the air and liquid at a depth. They presented calculated performance for the HAC using the flow rate and net head combinations typical at small hydropower sites.
French and Widden [7] presented a hydropower system based on siphons in which the pressure of low-head water is converted into air pressure. Their analysis suggested that, with careful design of the flow passages to minimize losses, efficiencies of 70% or more should be achievable. They stated that the economics of the system are likely to be attractive owing to the low capital cost of the system compared with conventional water-turbine systems. In addition, they stated that a siphon plant is suitable, in single-stage form, for heads up to about 1.7 m and that for higher heads, the system can be used in two or more stages.
The purpose of the present work is to carry out experimental and analytical investigation of low head open type HAC. In the current work, variation of mean diameter of air bubbles in the downward flow in the downcomer is both determined and investigated. The losses in the whole system are classified, investigated and its impact on HAC is discussed. The performance is both experimentally and theoretically investigated for various air admission system parameters, downcomer length and hydraulic head. The results are both presented and discussed.
2. Experimental Test Rig and Measuring Instruments
2.1 Experimental Test Rig
The High Institute of Energy open-type HAC test rig facility; shown in Figure 1 is used in the present work. Two (upper and lower) impoundments (tanks) are connected to stilling chamber via two vertical pipes (downcomer and raiser). A certain amount of air is introduced into the water flow through a suitable intake device (air tube). Air is entrained into the water flow by the static pressure differential existing between the air at ambient condition (section 0) and at the end of the air tube (section 1). Different air admission device arrangements can be adopted to ensure the formation of two-phase flow at section 2, which can be considered to coincide with section 1. The stilling chamber is designed to obtain low flow velocity, thus allowing the air bubbles to separate from the water. Compressed air then gathers in the upper part of the stilling chamber and is supplied to the user. Leaving the chamber, water enters the raiser pipe (section 5) and, through (section 6), reaches the final impoundment (section 7).
2.1.1. Impoundments
a) Upper Impoundment
Figure 1 illustrates schematic drawing and main dimensions of testing arrangement. Upper impoundment is cylindrical tank of 0.54 m diameter and 0.85 m height. The tank is fed by water from filling tank; Figure 1, via 2"(0.0508m) piping. A 2'' ON/OFF valve (No. 1) is fitted between the upper impoundment and filling tank. In addition, over flow pipes are fitted on the side of the upper impoundment. The filling tank is mounted such that its base is 0.15 m above the upper overflow valve center to keep a constant water level in the upper impoundment. Both the upper impoundment and filling tank are subjected to atmospheric pressure.
b) Lower Impoundment
It is a cylindrical tank having 0.54m diameter and 0.85m height. It is connected to the stilling chamber via a 6m pipe (raiser). Two over flow pipes; Figure 1, are mounted on the side of the tank at 0.32m and 0.67m from the base of the tank to sustain specific hydraulic head (Hy) between the upper and lower impoundments. The hydraulic head between the impoundments is the driving force that ensures both air compression and the overcoming of concentrated and distributed losses. With analogy to the upper impoundment and filling tank, the lower impoundment is subjected to atmospheric pressure.
2.1.2. Downcomer and Raiser
They are two commercial steel cylindrical pipes, each has one inch (0.0254 m) diameter. Longer one; the downcomer, has two portions, first portion is that below the upper impoundment and it has a fixed length of 8 m. The second portion (Ydc); Figure 1, is inside the upper impoundment and it has a variable length. Values of Ydc times the downcomer diameter; (Ydc /Ddc) used in the present work are: 9.84, 11.81, 13.78, 15.75, 17.72, 19.68, 21.65 and 23.62. The shorter pipe; raiser has a fixed length of 6m. Tests are conducted for a fixed length of portion of raiser inside the lower impoundment to downcomer diameter ratio (Yr /Ddc) of 12.6. The length of the downcomer to its diameter ratio (Hdc /Ddc) is variable based on the portion of downcomer length inside the upper impoundment (Ydc).
2.1.3 Air Admission System
PVC tubes of different diameters (Dt) and lengths (Yt); Figure 1, are mounted in the upper impoundment. Each air tube must be thoroughly adjusted to be concentric with the downcomer.
The diameters of the air tube to downcomer ratios (Dt /Ddc) utilized in the present study are 0.55, 0.59, 0.63, 0.67 , 0.71 and 0.75 respectively while their lengths to downcomer diameter ratios (Yt /Ddc) are 1.59, 2.36 , 3.15, 3.94 , 4.72 and 5.51 respectively.
Over flow pipes give the ability to change the hydraulic head (Hy); Figure 1, giving hydraulic head to downcomer diameter ratios (Hy /Ddc) of 59,65,75,79,81 and 94 respectively.
2.1.4 Stilling Chamber
Settling chamber; Figure 1, is an air tight steel tank which dimensions are 0.5m × 0.5m × 0.6m. The tank has a Prisbex sheet mounted on its side to indicate the level of water inside the tank. ON/OFF valve (No. 4) is used to release the compressed air gathered in the upper part of the settling chamber via air exit tube having ½" (0.0127 m) piping.
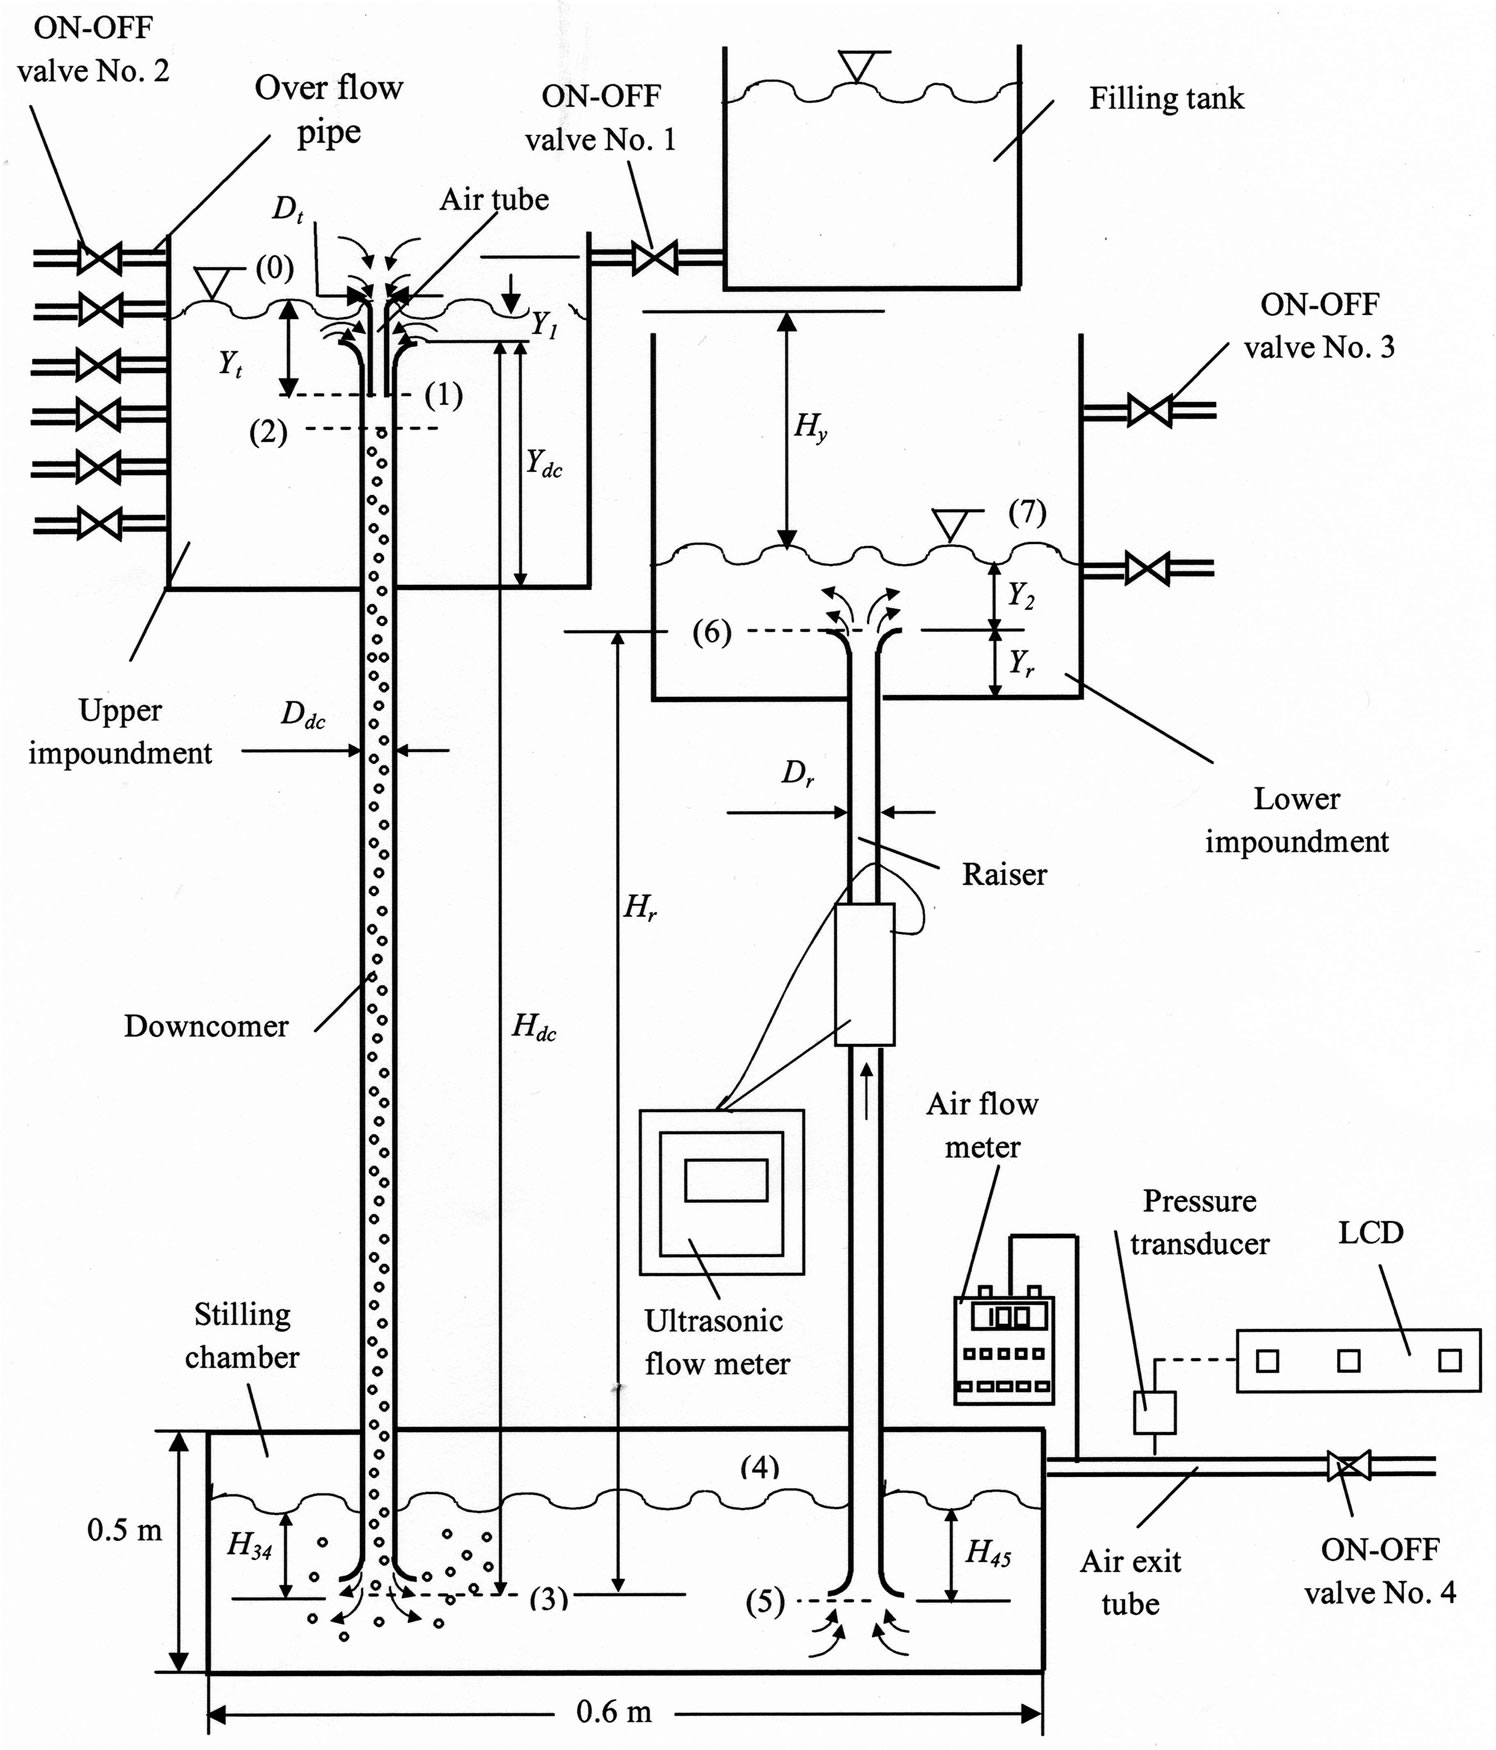
Figure 1. Schematic drawing and main dimensions of testing arrangement
2.2 Measuring Instruments
The pressure and flow rate for both air and water are measured; Figure 1, to study the HAC performance and the characteristics of mixing process. The main features of the measuring instruments are described in the following section.
2.2.1 Flow Rate Measuring Instruments
a) Water Flow Meter
The water flow rate is measured and indicated using a transient-time flow meter (Ultrasonic flow meter), Figure 1. The flow meter characteristics are specified in table 1.
b) Air Flow Meter
The flow rate of the air is measured using air meter unit.
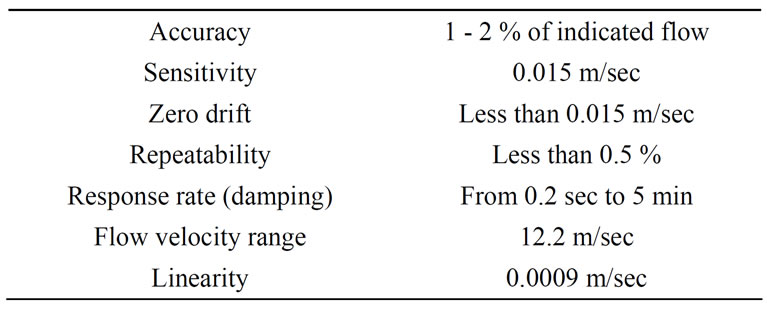
Table 1. Transient-time flow meter characteristics
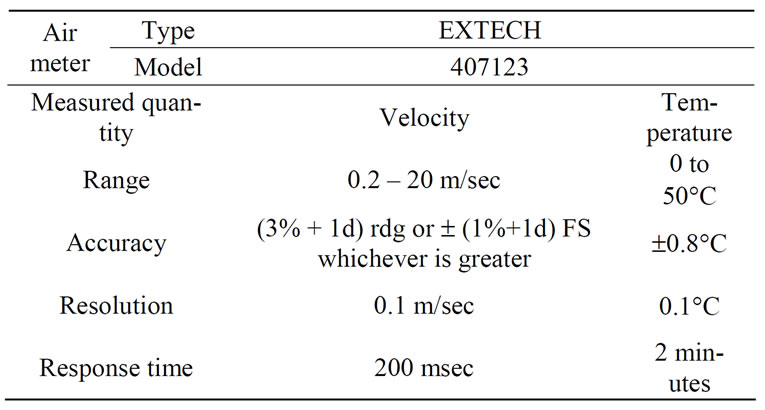
Table 2. Specifications of air meter unit
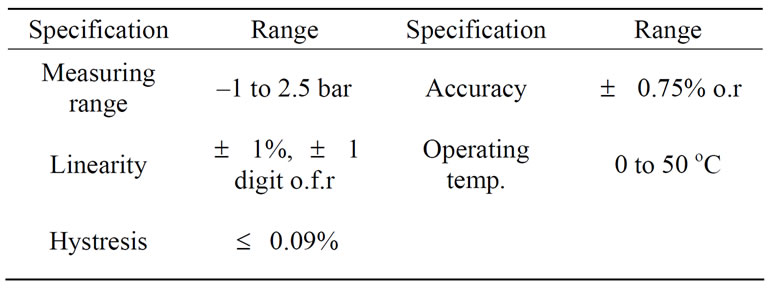
Table 3. Specifications of Pressure transducer
This unit is designed to measure air velocity, flow rate, temperature, pressure, humidity and heat flow. It may be connected to computer and/or printer for accessing stored data and printing it. The specifications of the air meter, velocity, and temperature measurement are listed in table 2.
2.2.2 Pressure Measuring Instrument (Pressure Transducer)
Pressure transducer is used to measure the pressure of compressed air issuing from the stilling chamber through ON/OFF valve No. 4. Specifications of the transducer are listed in Table 3. The reading of the pressure transducer is displayed on the amplifier display unit.
3. Mathematical Modeling of the Hac
An analytical, one-dimensional approach assuming isothermal flow in HAC which allows the simulation of its operation and evaluation of the complete energy losses and presented in previous work by Bidini et al., [3] is utilized in this study. The plant configuration shown which is incorporated in this study; Figure 1, is an open type HAC. Flow in HAC may be represented by the following intervals:
3.1 Interval 0-1
The air entrainment process efficiency is described by the air-water mass flowrate ratio; μ.
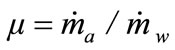 (1)
(1)
Equations (2) and (3) are used for mass and energy conservation equations:
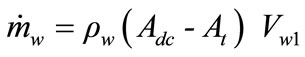 (2)
(2)
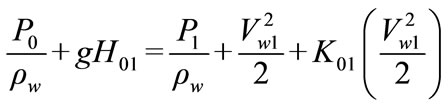 (3)
(3)
The irreversibility for the water flow is given by the inlet losses, represented by the K01 coefficient. Hence, the loss for the water flow can be quantified as
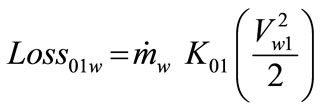 (4)
(4)
The energy conservation equation for an isothermal flow is applied to calculate the air flow loss:
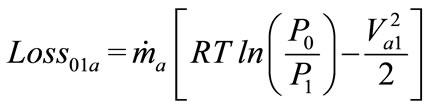 (5)
(5)
The total energy loss for interval 0-1; Loss01 , is the sum of that of water and air flows in the interval 0-1
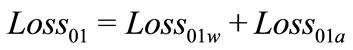 (6)
(6)
3.2 Interval 1-2
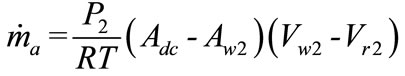
Interval 1-2 is assumed to be of infinitesimal length; nevertheless its limiting sections are characterized by different physical meanings. The water and air flow cross-sections can then be schematically defined as Aw and Adc -Aw respectively. Pressure and velocity at section 2 can be determined by numerically solving the simultaneous nonlinear system of equations for mass and momentum; Equations (7) and (8) respectively.
 (7)
(7)
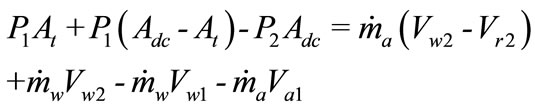 (8)
(8)
where, Vr is the relative velocity between the air bubbles and water. It was stated in previous work by Bidini et al., [3] that experimental measurements suggested an initial value; Vr2 which equals 0.244 m/s.
3.3 Interval 2-3
The two-phase flow for the generic volume between Sections 2 and 3 is analyzed by means of discretization technique by applying mass and momentum, conservation equations at small volumes of fluid along the downcomer pipe. Hence, the solution at the generic depth z is used to determine the pressure and velocity at depth z + dz, having the incremental values of pressure and water velocity, dP and dVw, as unknown quantities. The model suggested by Bidini et al., [3]; is presented by Equations (9), (10).
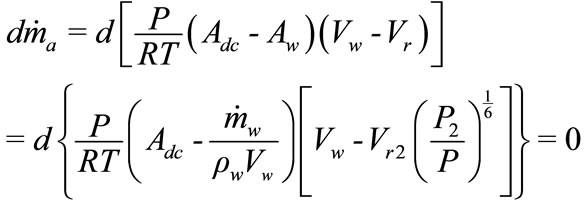 (9)
(9)
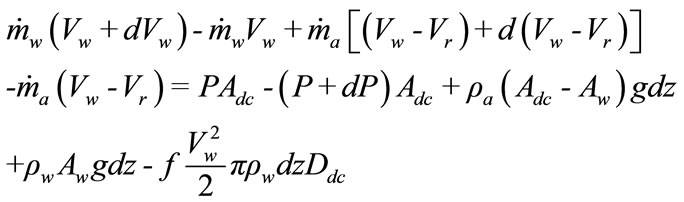 (10)
(10)
The variation of bubble-water relative velocity; is:
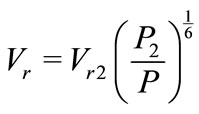 (11)
(11)
Two kinds of irreversibility are present between sections 2 and 3; wall friction (Loss23w) and friction between water and air bubbles (Loss23b) due to the relative velocity; Vr:
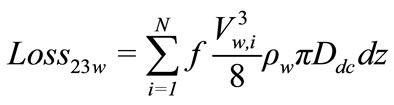
&
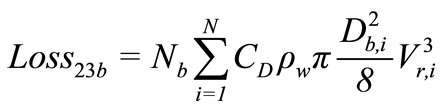 (12)
(12)
where, N is the number of segments determined by:
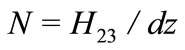 (13)
(13)
Nb represents the number of bubbles crossing any downcorner section, which is constant with z and is calculated as:
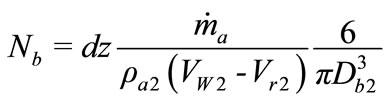 (14)
(14)
The mean diameter of air bubbles at Section 1; Dbi is determined by imposing the instantaneous equilibrium between the drag force and the buoyancy force.
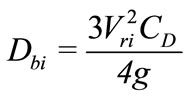 (15)
(15)
where, CD is drag coefficient for a sphere [8].
3.4 Interval 3-4
The discharge loss occurs at interval 3-4 is calculated as:
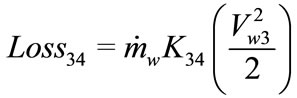 (16)
(16)
3.5 Interval 4-5
In the stilling chamber, compressed air bubbles easily diffuse through the water and gather in the upper part of the stilling chamber; with a pressure , from where air is delivered to the user. The compression ratio;
 is defined as
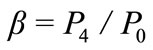 (17)
(17)
At the raiser entry, an inlet loss is located (Loss45), which is defined by
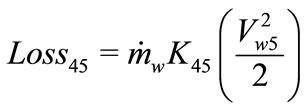 (18)
(18)
3.6 Interval 5-6
The only flow loss along the raiser is due to water-wall friction, and is defined as
 (19)
(19)
3.7 Interval 6-7
At the end of the raiser, the discharge loss (Loss67) is evaluated from
 (20)
(20)
Total losses are the sum of air tube loss; Loss01a, downcomer water inlet loss; Loss01w , water-air bubble friction loss along the downcomer; Loss23b, water-wall friction loss along the downcomer; Loss23w, downcomer water outlet loss; Loss34, raiser water inlet loss; Loss45, water-wall friction loss along the raiser; Loss56 , and raiser water outlet loss; Loss67.
Hydraulic air compressor efficiency; assuming isothermal compression in HAC [3], is defined as
 (21)
(21)
4. Results and Discussions
Figures 2 and 3 illustrate values of mean air bubbles diameters computed along the downcomer for specific air tube length, hydraulic head and downcomer lenth for different air tube diameters and air tube lengths respectively.
Figure 2 illustrates the variation of mean air bubbles diameter along the downcomer for different air tube diameters for specific air tube length, hydraulic head and downcomer length. It may be remarked from the figure that the mean air bubbles diameter decreases along the downcomer. This may be relied to that as the depth increases; pressure raises hence compresses the air bubbles and decreasing their volume. Consequently, the portion of the downcomer available for the water flow becomes wider, while the velocity progressively decreases. In addition, it may be concluded from the above mentioned
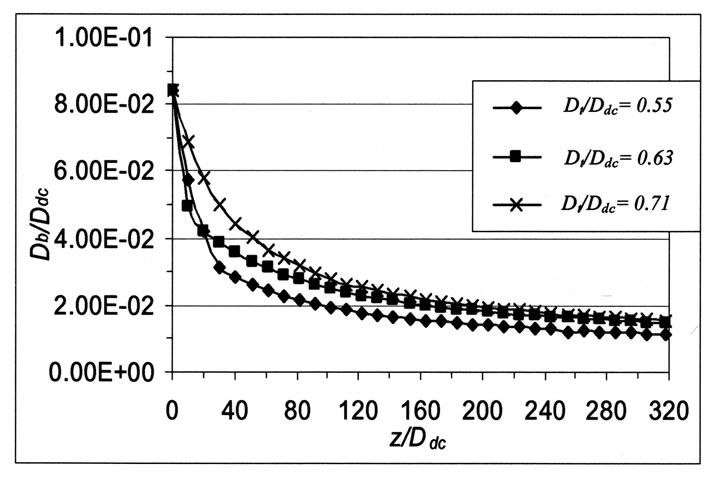
Figure 2. Variation of mean air bubbles diameter along the downcomer for different air tube diameters; Hdc/Ddc= 415.35, Hy/Ddc= 59, Yt /Ddc=3.94
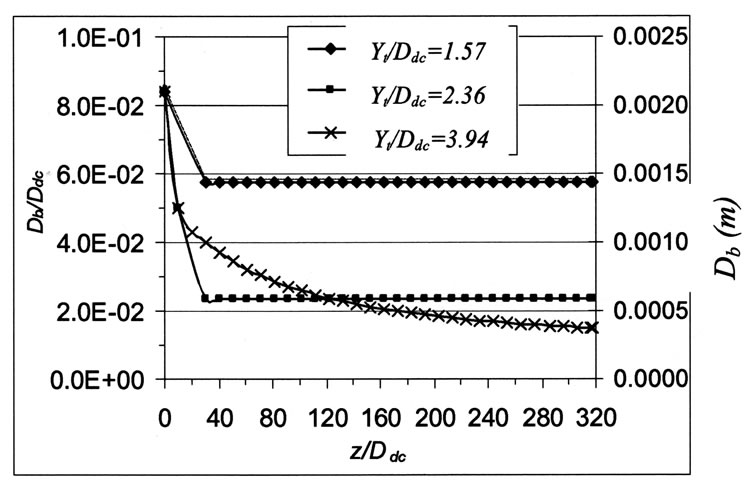
Figure 3. Variation of mean air bubbles diameter along the downcomer for different air tube lengths; Hdc /Ddc= 417.32 , Hy/Ddc= 59, Dt /Ddc= 0.63
figure that the mean air bubbles diameter along the downcomer in general increases with increasing air tube diameter. This may be relied as follows, for specific airmass flow rate, increasing air tube diameter, while keeping other parameters constant, leads to a reduction in the air velocity in the downcomer. In addition, increasing air tube diameter leads to a reduction in the corresponding water area in the downcomer which leads to a subsequent increase in water velocity and hence relative velocity. As it may be observed from Equation (15), the mean air bubbles diameter is proportional to the square of relative velocity. Hence, increasing air tube diameter leads to a corresponding increase in the mean air bubbles diameter. Further, experimental results showed that varying the downcomer length, Hdc has no appreciable effect on the mean air bubbles diameter.
Figure 3 illustrates the variation of the mean air bubbles diameter along the downcomer for different air tube lengths; Yt and specific air tube diameter Dt , hydraulic heads; Hy , and downcomer length; Hdc. From the above mentioned figure, it is may be concluded that the mean air bubbles diameter along the downcomer in general decreases with increasing the air tube length. This may be relied to the subsequent increase in the pressure along the downcomer due to the increase of air tube length. Results indicated that varying the hydraulic head does not appreciably affect the mean air bubbles diameter.
As it was stated in [3], the performance of HAC shows a marked dependence on the main operational and design parameters. Experimental results proved that the losses are air tube diameter dependent. Figures 4 to 6 present the variation of HAC total losses, air tube loss and downcomer water inlet loss as percentages to total loss respectively for various air tube diameters and specific downcomer length, hydraulic head, and air tube length. It may be remarked from Figures 4-6 that up to specific air tube diameter ≈ 0.71 downcomer diameter, both downcmer water inlet loss and air tube loss and hence total loss in general decrease with increasing the air tube diameter. Further increase of air tube diameter leads to an increase in downcomer water inlet loss, air tube loss and total loss. Hence, there is an intermediate range of air tube diameter which has low total loss.
From these figures and forthcoming figures concerning HAC efficiency, it may be concluded that the air tube-to-
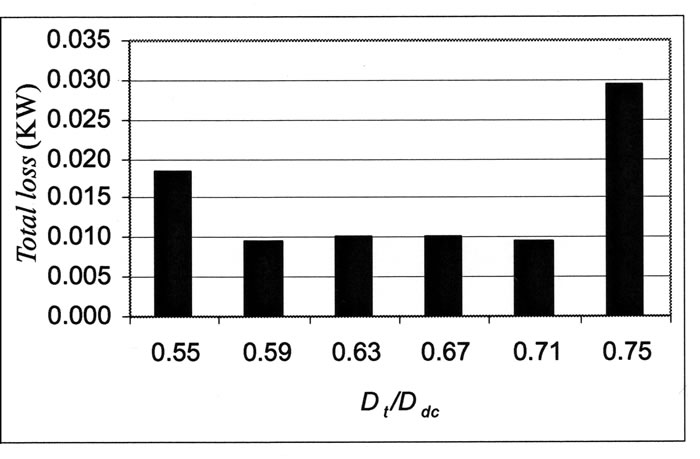
Figure 4. Variation of total loss with air tube diameter; Hy /Ddc = 59, Hdc /Ddc= 417.32 , Yt /Ddc= 3.94
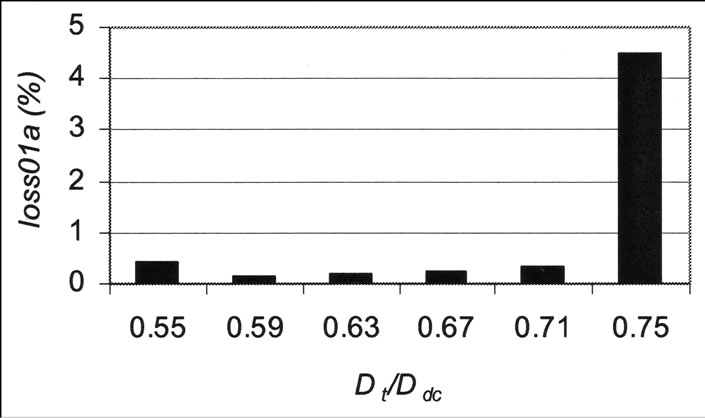
Figure 5. Variation of air tube loss as a percentage to total loss with air tube diameter; Hy/Ddc = 59, Hdc /Ddc= 417.32, Yt /Ddc= 3.94
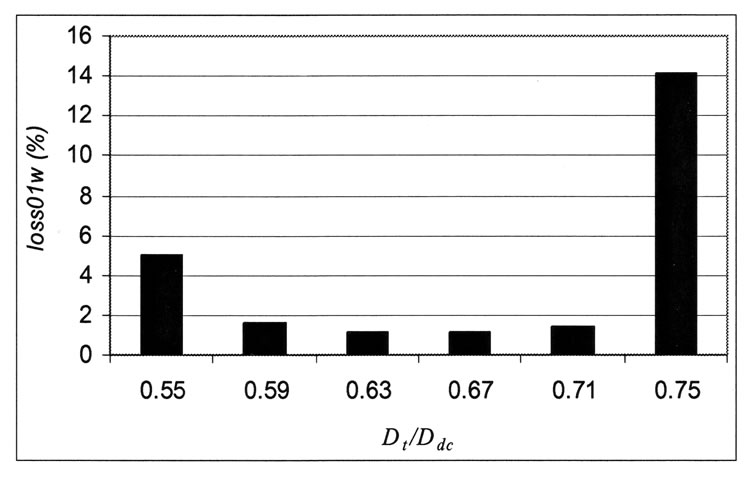
Figure 6. Variation of downcomer water inlet loss as a percentage to total loss with air tube diameter; Hy /Ddc = 59, Hdc /Ddc= 417.32, Yt /Ddc= 3.94
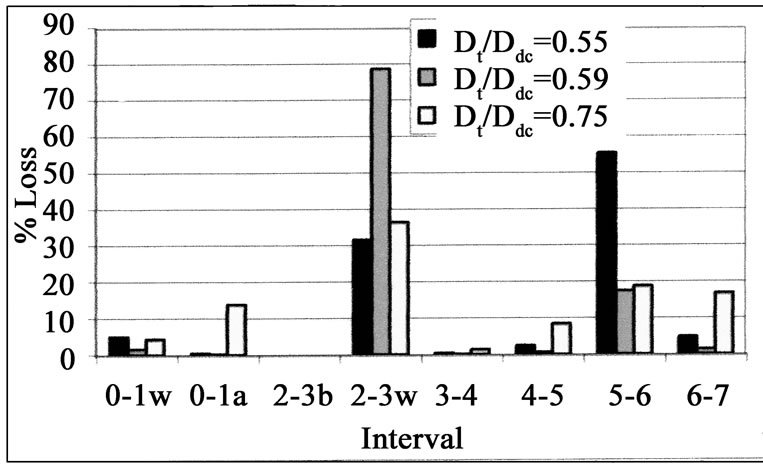
Figure 7. Percentages of loss in various intervals; Yt /Ddc = 3.94, Hy /Ddc = 59, Hdc /Ddc = 417.32
downcomer diameter ratio of 0.71 corresponds to the highest HAC performance for the current investigation limits.
Figure 7 illustrates the percentages of losses in different intervals for various air tube diameters and specific hydraulic head, air tube length and downcomer length. It may be concluded from the above mentioned figure that while the friction between water and air bubbles due to the relative velocity; Loss23b, represents a minor portion of the total losses in the HAC, the water-wall friction loss along the downcomer; Loss23w and the water-wall friction loss along the raiser; Loss56, represent the major part of the total losses in the HAC. This may be attributed to the friction between water and downcomer or raiser. Experimental results illustrated that the air tube length; Yt , the downcomer length; Hdc and hydraulic head; Hy do not have a remarkable effect on the percentage losses in HAC.
To the best of our knowledge, there are no references that treat the effect of air tube length; Yt on HAC performance. Figure 8 illustrates the variation of compression ratio; b with air tube length; Yt for sample of air tube diameters; Dt and specific downcomer length; Hdc and
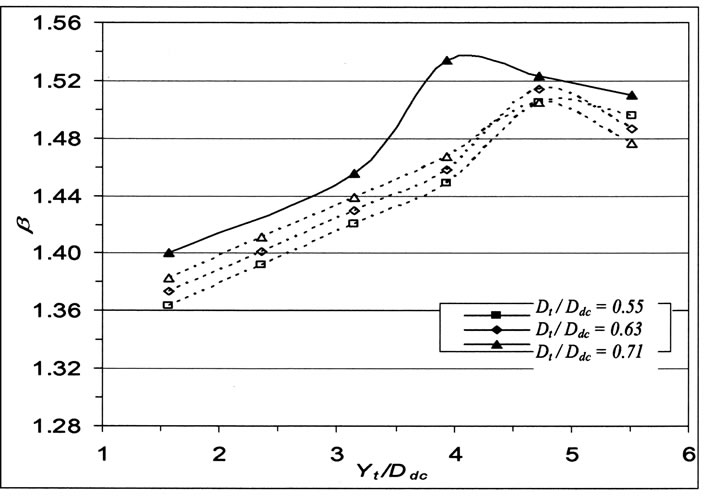
Figure 8. Variation of HAC compression ratio with air tube length; Hdc /Ddc= 417.32, Hy /Ddc= 59
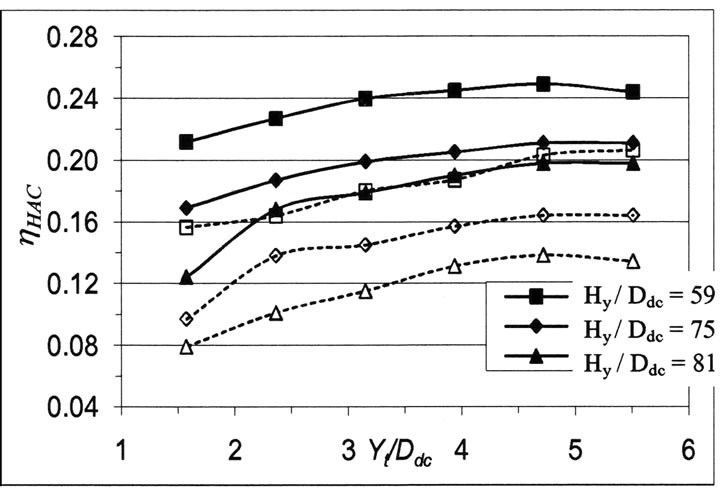
Figure 9. Variation of HAC efficiency with air tube length for various hydraulic heads; Dt /Ddc = 0.63, Hdc /Ddc = 417.32
hydraulic head; Hy. Continuous lines in the whole figures of the current work refer to analytical results, while dashed lines refer to experimental results.
Figure 9 presents the variation of the hydraulic air compressor efficiency; ηHAC with air tube length; Yt forvarious hydraulic heads; Hy and specific air tube diameter; Dt and downcomer length; Hdc. For short air tube lengths, the static pressure at the air admission end section would be so near to atmospheric that air entrainment would be very difficult, this leads to a low compression ratio and hence low hydraulic air compressor efficiency as it may be observed from Figures 8,9. Herein, experimental results indicated that β and thus η increase with increasing Yt until a value equals approximately equals 4.72 Ddc. This may be relied as follows, increasing Yt leads to an increase in differential pressure across air tube as may be remarked in equation (3) and a subsequent increase in air mass flowrate and hence compression ratio; β. Beyond that value of Yt , a decrease in the air bubbles volume leads to a decrease in air-water mass flowrate ratio and a subsequent decrease in both β and ηHAC. However, the peak value of compression ratio for analytical results corresponds to air tube length equals 3.94 times the downcomer diameter; which is shifted from the corresponding value for experimental results. This may be due to the simplified analytical model utilized in the current work.
It may be concluded from Figures 10 and 11 that the compression ratio and HAC efficiency slightly increase with increasing downcomer length while holding other parameters constant. As indicated in previous work by Bidini et al., [3], β increases with increasing Hdc and as may be remarked from Equation (21), HAC efficiency increases with increasing the logarithm of compression ratio (b). This fact may be observed Figure 10 in which b increases with increase of Hdc until a value of Hdc nearly equals 417.32 Ddc. With further increase in Hdc a flat portion or slight decrease in β is remarked. This may be relied to that: the water-bubble friction loss, together with the water-wall friction losses in the downcomer and raiser increase with increasing Hdc , because of the deeper position of the stilling chamber needed to compress the air.
It may be remarked from the results that increasing the air tube diameter up to 0.71 downcomer diameter leads to a subsequent increase in compression ratio. This may be relied to increasing of air tube diameter leads to an increase in air mass flow rate and subsequent increase in
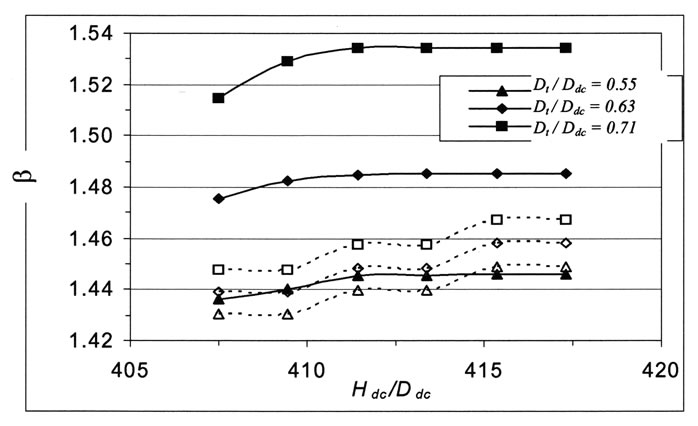
Figure 10. Variation of compression ratio with downcomer length; Yt /Ddc = 3.94, Hy /Ddc= 59
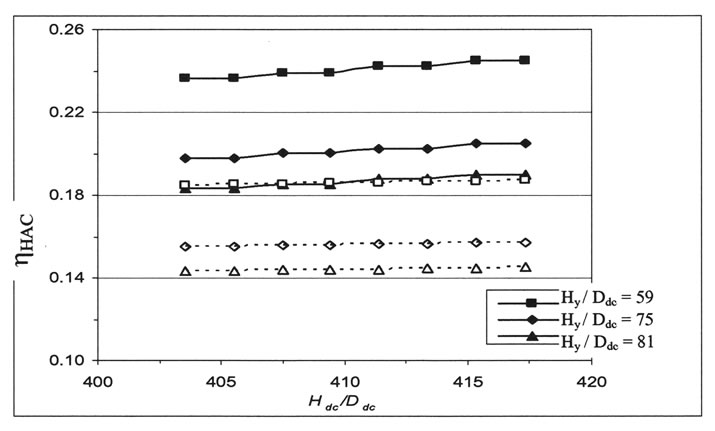
Figure 11. Variation of HAC efficiency with downcomer length for various hydraulic heads; Dt /Ddc = 0.63, Yt /Ddc = 3.94
pressure inside stilling chamber and hence increase in compression ratio. With further increase in air diameter, the water velocity increases leading to increase in wall friction loss in the downcomer and subsequent decrease in compression ratio and HAC efficiency.
It may be concluded from the above figures that the efficiency decreases with increasing the hydraulic head when holding the other parameters constant. This may be reasoned using Equation (21) which indicates that the efficiency is inversely proportional to hydraulic head for specific air tube diameter (i.e., air-water mass flow rate ratio; μ). The observed difference between the theoretical efficiencies and those evaluated experimentally in the above figures may be relied to the fact that the efficiency depends on the actual configuration of the air intake system as indicated in previous work by Bidini et al., [3].
Figure 12 shows the relation between hydraulic air compressor efficiency and compression ratio for various hydraulic heads while holding other parameters constant.
The quiet low efficiency range estimated in the current work; which is in any case lesser than 34 percent, is appreciably low compared to that stated in the literature; 0.50-0.85 [3]. This may be relied to that the air-to-water mass flow rate ratio range (0.29 × 10⁻⁴ to 1.04 × 10⁻⁴) and hydraulic head (£ 2.4 m) are appreciably lower than the
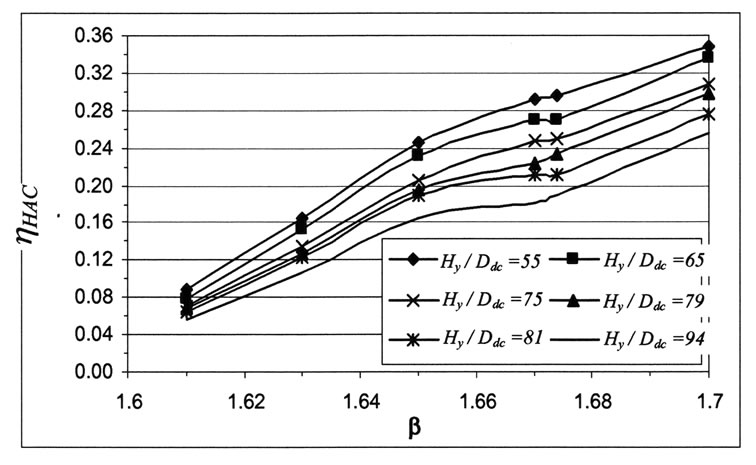
Figure 12. Variation of efficiency with compression ratio for various hydraulic heads; Yt /Ddc = 3.94 and Hdc /Ddc= 417.32
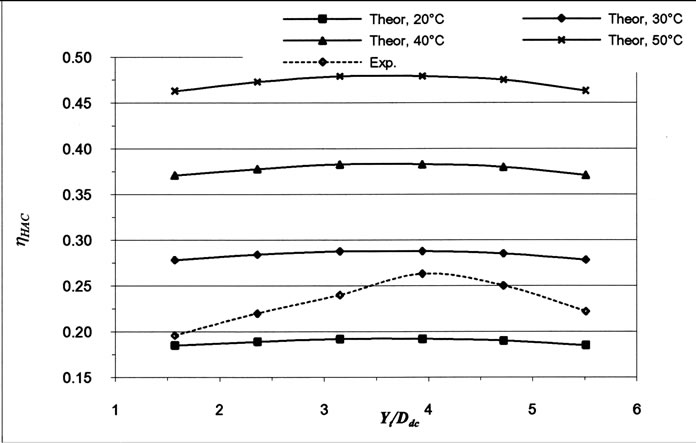
Figure 13. Effect of temperature on HAC efficiency Hy /Ddc = 59, Dt /Ddc =0.71, and Hdc /Ddc = 417.32
corresponding values in [3], (4 × 10⁻⁴ to 8 × 10⁻⁴) and (» 2.4 m) respectively.
The range of the hydraulic head used in the current work may be more efficiently used in a siphon type as it was stated in previous work by French and Widden [7] that siphon type is suitable for heads up to 1.7 m.
Figure 13 illustrates the effect of atmospheric temperature on theoretical hydraulic air compressor efficiency for the range of air tube lengths utilized in the current investigation and comparison with efficiency evaluated experimentally at atmospheric temperature of 30ºC for specific air tube diameter, hydraulic head and downcomer length. It may be concluded from Equation (21) and the figure that the efficiency is proportional to theatmospheric temperature.
5. Conclusions
In this work, an analytical and experimental investigation of a low head open type HAC is reported to analyze the performance of the system and to investigate the effect of various non-dimensional parameters. The presented results suggest that the mean air bubbles diameter decreases along the downcomer, increases with both increasing air tube diameter and decreasing air tube length and not appreciably affected by the downcomer length, Hdc or hydraulic head; Hy. It was concluded that the water-wall friction loss along the downcomer; Loss23w and the water-wall friction loss along the raiser; Loss56, represent the major portions of the total losses in the HAC. It was concluded that compression ratio increases with increasing air tube length or diameter up to a certain limit (3.94 and 0.71 downcomer diameter respectively) and decreases with further increase in their values. Air tube diameter has the same effect on HAC efficiency. In addition it was found that both the compression ratio and efficiency increase with increasing downcomer length and that beyond a certain limit (417.32 times downcomer diameter), compression ratio curve flattens. Low HAC efficiency reported in the current investigation may be due to the low values of both hydraulic head and air-water mass flow rate ratio. The range of the hydraulic head used in the current work may be more efficiently utilized in a siphon type which is suitable for heads up to 1.7 m. Further, it is indicated that the hydraulic air compressor efficiency is proportional to the atmospheric temperature.
REFERENCES
- M. B. Widden, M. J. French and G. A. Aggidis, “Economic Energy from Low-Head Water by Conversion to Air Pressure,” Proceedings of Hydropower 2004 World Class Engineering in a Challenging Environment Symposium, Lancaster University, London, 2004, pp. 1-10.
- J. L. Shapiro, “The Hydraulic Air Compressor Combustion Turbine,” ASME Cogen-Turbo, IGTI, Vol. 9, 1994, pp. 291- 297.
- G. Bidini, C. N. Grimaldi and L. Postrioti, “Thermodynamic Analysis of Hydraulic Air Compressor-Gas Turbine Power Plants,” Proceedings Institution of Mechanical Engineers, Vol. 211, 1997, pp. 429-437.
- G. Bidini, C. N. Grimaldi and L. Postrioti, “Performance Analysis of a Hydraulic Air Compressor,” Proceedings Institution of Mechanical Engineers, Vol. 213, 1999, pp. 191-203.
- A. Nishi, “Highly Efficient Gas Turbine System Using Isothermal Compression,” JSME International Journal, Vol. 39, No. 3, 1996, pp. 615-620.
- W. Rice and B. D. Wood, “Characteristics of the Hydraulic Air Compressor as a Small Hydro-Power Device,” SmallHydro-Power-Fluid-Mach ASME Winter Annual Meeting, Chicago, 1980, pp. 81-87.
- M. J. French and M. B. Widden, “The Exploitation of Low-Head Hydropower by Pressure Interchange with Air, Using Siphons,” Proceedings of IMeche Part A-Journal of Power and Energy, Vol. 215, No. 2, 2001, pp 223-230.
- R. L. Street, G. Z. Watters and J. K. Vennard, “Elementary Fluid Mechanics,” Seventh Edition, J. Willey & Sons, New York, 1996.
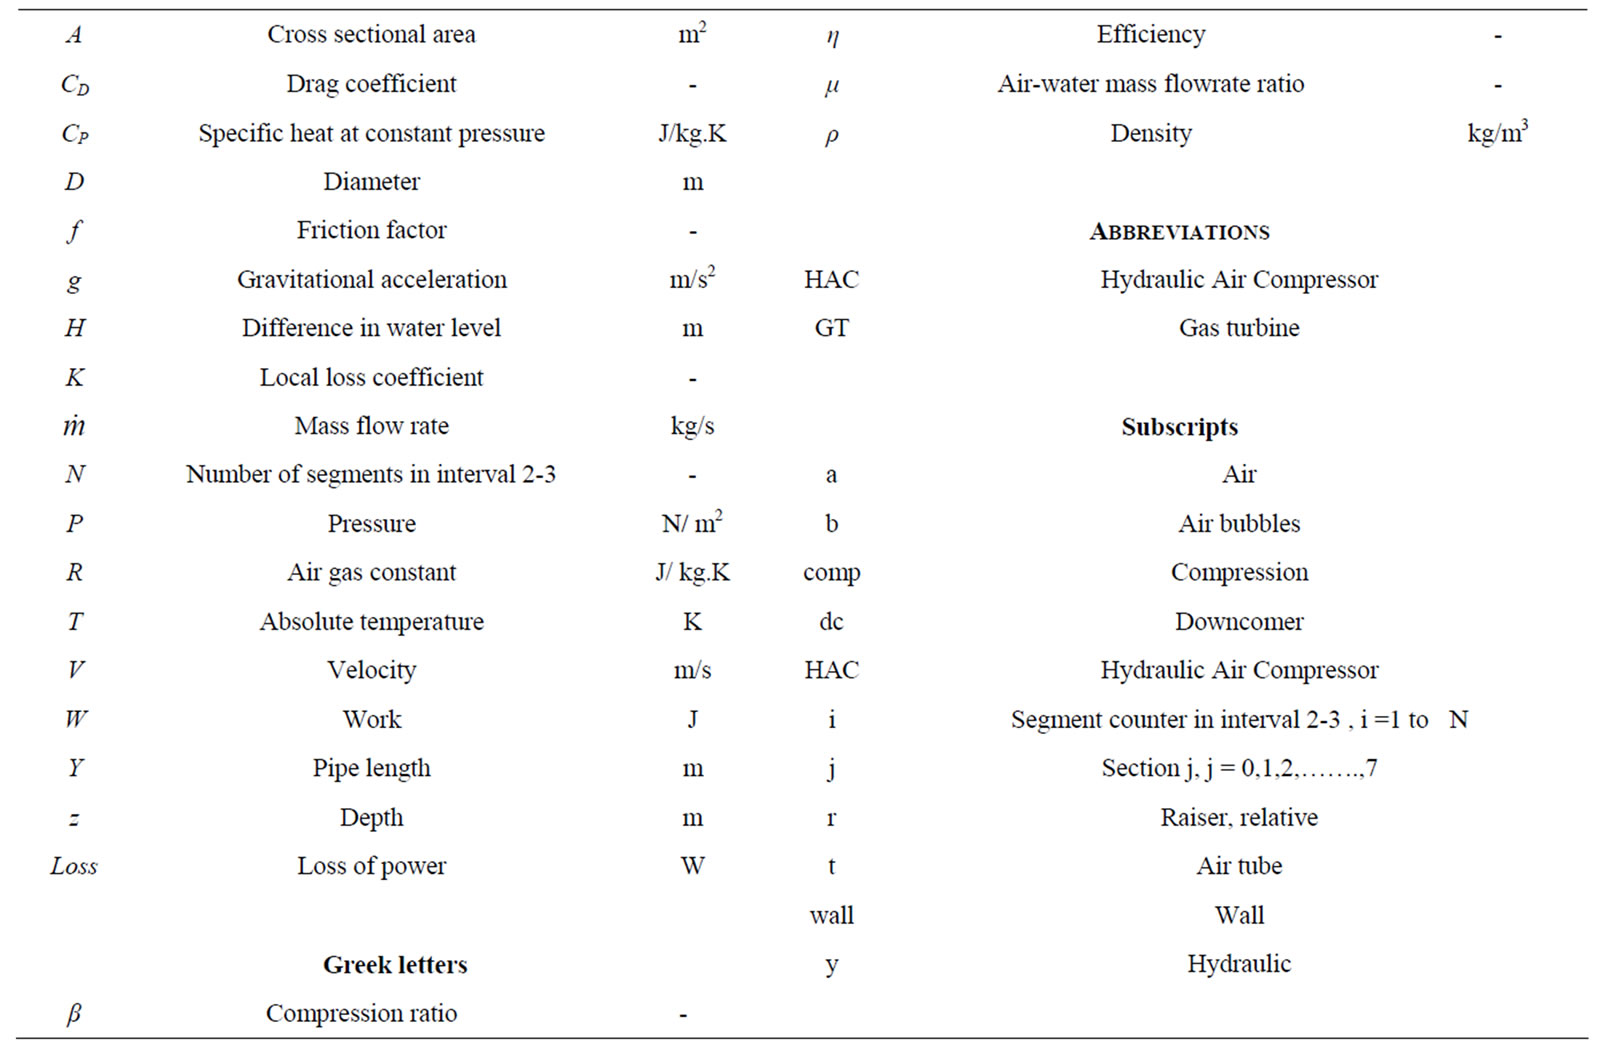
Nomenclature