Energy and Power Engineering
Vol.6 No.7(2014), Article
ID:48104,12
pages
DOI:10.4236/epe.2014.67016
Thermal Distribution Performance of NPCM: NaCl, NaNO3 and KNO3 in the Thermal Storage System
Pises Tooklang1, Sarayooth Vaivudh1, Sukrudee Sukchai1, Wattanapong Rakwichian2
1School of Renewable Energy Technology (SERT), Naresuan University, Phitsanulok, Thailand
2School of Energy and Environment, University of Phayao, Muang, Thailand
Email: tpisate@hotmail.com
Copyright © 2014 by authors and Scientific Research Publishing Inc.
This work is licensed under the Creative Commons Attribution International License (CC BY).
http://creativecommons.org/licenses/by/4.0/


Received 25 May 2014; revised 28 June 2014; accepted 6 July 2014
ABSTRACT
The experiment is studied on thermal distribution in the thermal energy storage system with non-phase change materials (NPCM): NaNO3, KNO3 and NaCl in the range of 25˚C - 250˚C. The cylindrical storage system was made of stainless steel with 25.6 cm-diameter and 26.8 cm-height that was contained of these NPCM. There was one pipe for heat transfer fluid (HTF) with 1.27 cm-diameter that manipulates in the storage tank and submerges to NPCM. The inner pipe was connected to the 2.27 cm-diameter outer HTF tube. The tube was further connected to the thermal pump, heater and load. The pump circulates the synthetic oil (Thermia oil) within the pipe for heat transferring purposes (charging and discharging). An electric heater is used as the heat source. The limitation of the charging oil temperature is maintained at 250˚C with the flow rates in the range of 0.58 to 1.45 kg/s whereas the inlet temperature of the discharge oil is maintained at 25˚C. Thermal performances of TES (thermal energy storage) such as charging and discharging times, radial thermal distribution, energy storage capacity and energy efficiency have been evaluated. The experimental results show that the radial thermal distribution of NaCl for TR inside, TR middle and TR outside was optimum of temperature down to NaNO3 and KNO3 respectively. Comparison of NPCMs with oil, flow rates for NaCl were charging and discharging heat transfer than KNO3 and NaNO3. The thermal stored NaCl ranged from 5712 - 5912 J; KNO3 ranged from 7350 - 7939 J and NaNO3 ranged from 6623 - 6930 J respectively. The thermal energy stored for experimental results got with along the KNO3, NaNO3 and NaCl respectively. The thermal energy efficiency of NaCl, KNO3 and NaNO3 was in the range 66% - 70%.
Keywords:Thermal Distribution, Non-Phase Change Materials, Heat Transfer Fluid, Thermal Energy Storage, Thermal Performance

1. Introduction
Solar energy is the most abundant energy source compared with other energies and supply’s unlimited clean energy. Solar energy can be transferred to thermal energy via a collector and sent to the equipment by heat transfer fluid (HTF). The most important application of solar energy is to transfer its thermal energy and then to electricity. Solar thermal power plant is one of the available applications of solar energy that its energy source depends on time, weather condition and electricity demand. Solar energy source of solar power plant is needed to be stored for smooth electric generation. The thermal storage system of the solar thermal power plant is necessary for the power plant stability and reducing rate of mismatch between energy demand and supply [1] . Basically, there are three methods of storing thermal energy: thermo-chemical, sensible and latent heat storage. For a thermo-chemical heat storage process, thermal energy is absorbed or released by breaking and reforming molecular bonds in a completely reversible chemical reaction. For a sensible heat storage unit, thermal energy is stored by changing the temperature of the storage medium which can be a solid or liquid [2] . The amount of energy stored in the unit depends on heat capacity of the medium, temperature changes and the amount of the storage material. The thermal energy may be stored as sensible heat. Sensible heat storage systems utilize the heat capacity and the change in temperature of the material during the process of charging or discharging temperature of the storage material rises when energy is absorbed and drops when energy is withdrawn. One of the most attractive features of sensible heat storage systems is that charging and discharging operations can be expected to be completely reversible for an unlimited number of cycles. For the utilization of solar energy or waste heat from industrial, the storage of the energy received is of particular interest and importance because of the intermittent nature of solar energy. The energy storage system in this case must be able to retain the energy absorbed for at least a few days in order to be able to supply energy as needed or on cloudy days when the energy input is small. For a small solar energy storage system, time period of the variation is one day. Therefore, the storage system must be designed with both the energy input and the demand as important considerations [3] . S. Somasundaram et al. (1993) studied the thermal integrate energy storage in power plant. They are committed to using the oil-rock storage or molten nitrate salt storage which is better than other storages [4] . T. Soontornchainacksaeng et al. (1996) studied the water thermal energy storage system that plays an important role for continuous utilization of non-permanent existing energy source such as solar heating system. Storage tank can be separated into 3 parts: 209 liter-thermal storage tank containing 184 liter of water, 30 cm-diameter charging coil made of 0.5 digit, copper tube and 30 cm-diameter discharging coil made of 0.5-inc. copper tube. The efficiency of thermal storage system charging at all flow rates was nearly the same at 89% and the efficiency of the system discharging at all flow rates was also the same of about 63% [5] . H. Michels and R. Pitz-Paal (2006) studied the current revival of solar thermal electricity generating systems (SEGS) which unveiled the still existing need of economic thermal energy storages (TES) for the temperature range from 250˚C to 500˚C. The TES-benchmark for parabolic trough power plants is the direct two tank storage, as it was used at the SEGS I plant near Barstow (USA). With the introduction of expensive synthetic heat transfer oil, it is capable to increase the operating temperature from former 300˚C up to 400˚C. The direct storage technology became uneconomical. Cascaded latent heat storages (CLHS) are one possible TES alternative, which are marked by a minimum of necessary storage material. The use of a cascade of multiple phase change materials (PCM) shall ensure the optimal utilization of the storage material [6] .
A spiral heat exchanger, commonly used in stainless steel, seems to be a very good candidate for this task. Compactness, it enhanced heat transfer due to centrifugal forces and easy sealing. Large heat transfer surface and a shorter undisturbed flow length are the most appealing features of such a choice. To transform this device into a spiral thermal storage energy unit (STES), one of its two working fluids is substituted by a material that is capable of storing energy due to both the sensible [7] . However, the effective use of a spiral heat exchanger, in the case when a non-phase change materials (NPCM) replaces one of working fluids. It should be preceded by comprehensive experimental and theoretical analyses. The questions of the behavior of potentially useful NPCMs and its performance, a thus designed, storage unit should be addressed.
Curvilinear spiral geometry has not yet been studied in the context of the heat storage energy systems. Indeed, so far the classical double-pipe or shell-and-tube heat exchangers have been applied in the storage energy systems and a relevant theoretical and experimental analysis of the phase-change phenomenon has been restricted to geometry of a cylindrical capsule [8] , an annulus gap, spherical or rectangular enclosures [9] . It was found that under the same experimental condition, unconstrained melting inside the sphere seems to occur at a faster rate than the constrained melting. This is due to the larger rate of heat transfer by conduction from the solid PCM to the spherical glass. Experimental and numerical analyses of melting of PCM inside a plexiglass spherical container were conducted by Felix et al. [10] , where paraffin wax was used as the PCM. Investigation on the effect of the sphere radius, Stefan number, molten fraction and time for complete melting was carried out. The results for both the experimental and numerical were quite identical. It was found that Stefan number and the sphere radius had significant effects on the complete melting time of phase change material. The study of the constrained melting has been reported by Roy, S. K. and S. Sengupta. J. M. Khodadadi, Y. Z. [11] [12] concluded that the conduction mode of heat transfer was dominant in the earlier stage of the melting process. At a later stage, the melting rate increased as the buoyancy-driven convection inside the liquid PCM became more significant.
Therefore, an experimental computerized stand has been constructed, where the one pipe stainless steel heat exchanger of spiral thermal distribution has been studied to determine overall characteristics of the temporal behavior of the NPCMs and of the performance of the TES unit. The empirical findings were presented in terms of temperature changes of both media. Moreover, the thermal analysis of the storage energy unit is carried out where temporal energy stored, charging and discharging time, energy storage capacity, and energy efficiency of melted and solid phases of the storage medium were estimated.
2. Theory of Thermal Distribution Performance
2.1. Storage Equation
The storage system is the sensible heat in solid storage. Assuming that the storage tank has a uniform temperature so the energy balance on the storage tank gives if the cumulative heat energy in the storage tank is not constant so we can re-write into the new equation as;
 (1)
(1)
where M: the medium mass in storage tank (kg), : heat rate of the tube from collector (J/s),
 : heat rate to the load (J/s), U: total heat exchange coefficient (W/m2K),
 : temperature of storage tank,
  temperature of surrounding (K), A: surface area of storage tank (m2),
![]() : the final temperature of storage tank (K),
: the final temperature of storage tank (K), ![]() the initial temperature of storage tank (K),
the initial temperature of storage tank (K),![]() : specific heat capacity of medium (J/kg-K) and
: specific heat capacity of medium (J/kg-K) and : time of heat accumulation(s) respectively.
2.2. Charging and Discharging
The total amount of heat transfer between the HTF to storage medium was calculated based on the mass flow rate , the specific heat of the processing fluid, Cp and the difference in inlet and outlet temperature
  a pipe is given by
 (2)
(2)
The heat balance from the convection of the HTF to the storage medium is used to calculate the outlet HTF temperature from the pipe by
 (3)
(3)
where k is the material thermal conductivity (W/m-K),  is mass flow rate of fluid (kg/s),
 ![]() is the heat transfer coefficient to the fluid (W/m2∙K) and r is radial coordinate from heat pipe (m) respectively.
is the heat transfer coefficient to the fluid (W/m2∙K) and r is radial coordinate from heat pipe (m) respectively.
The inlet temperature of HTF is changed when it flows out of the pipe and is heated by a heater for the next round of charging experiment, HTF temperature is increased and flowed back to the pipe again after heated by the heater, the inlet HTF temperature is given by Equation (4).
 (4)
(4)
where  is the charging thermal energy rate by heater, (kW) and
  is the inlet temperature of heated HTF, (K).
The outlet HTF temperature after HTF transfer heat to the pipe and the storage medium is decreased from the calculation that depends on the storage temperature, flow rate of HTF, heat capacity, and the mathematical model will be explained as in the Equation (5).
 (5)
(5)
2.3. Energy Stored
The amount of thermal energy stored in the different storage materials at their respective charging times is calculated using Equation (6).
 (6)
(6)
where,  ,
,  ,
,  ,
,  and
and  are storage capacity (J), density (kg/m3), specific heat (J/kg∙K) Storage volume required (m3) and inlet of charging temperature range (˚C) respectively.
2.4. Energy Recovered
The amount of thermal energy recovered from storage bed of different materials at their respective discharging time is calculated using Equation (7).
 (7)
(7)
where,  is the volume average temperature of the storage bed at the end of charging cycle (˚C).
2.5. Energy Efficiency
Energy efficiency is the ratio of energy recovered from the storage bed during discharging cycle to the total energy input to storage bed which is given by the Equation (8). The total energy input is the sum of energy supplied to heat the storage bed from atmospheric temperature  25˚C to 250˚C and energy stored in the bed during charging.
 (8)
(8)
3. Experimental
3.1. Materials
Based on thermodynamic data, corrosiveness and handling characteristics, three non-phase change materials (NPCM) were selected for experimental investigations: sodium nitrate (NaNO3), potassium nitrate (KNO3) and sodium chloride (NaCl). The most important properties of these Three NPCMs and lubricant oil (LO) are given in Table1
3.2. Procedure
A two co-axial cylindrical storage tank was used to house the charging and discharging pipe. The inner tank has a diameter and height of 25.8 cm. and 26.8 cm, respectively. The storage tank stranded vertically in ambient air during the experiment and the storage temperature was reduced from heat loss to the air through the insulator as shown in Figure 1.
The vertical charging straight pipe was made of stainless steel of 95 cm length, 1.27 cm diameter and 0.1 cm thickness. The fluid was pumped through the pipe using a positive displacement pump connected to a variable

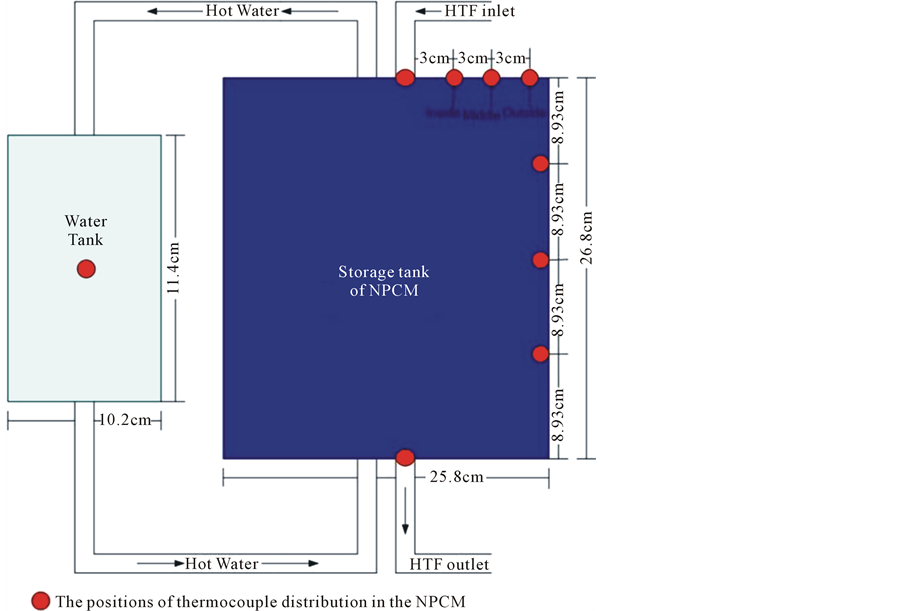
Figure 1. The model of experimental set up.
speed motor. The speed of motor was adjusted to obtain the flow rates of 0.58, 0.87, 1.16 and 1.45 kg/s, respectively. Three non-phase change materials (NPCM) were selected for experimental investigations: sodium nitrate (NaNO3), potassium nitrate (KNO3) and sodium chloride (NaCl). These correspond to laminar and turbulent flow regimes that depend on the HTF viscosity from the Reynolds numbers. The purpose of using different flow rates was to observe the rate of heat transfer from HTF to storage medium. Lubricant oil (LO) (from Shell Company) at an average room temperature (25˚C) was used as the inlet HTF and flowed from the inner tank. The performance parameters are charging time, energy stored, discharging time, energy recovered and energy efficiency.
For charging process, HTF brings heat from heater 3 kW to the storage tank. The pump is used to circulate HTF in the system. For the discharging experiment, thermal oil was used as HTF for drawing the heat from the storage tank. The load was made by a boiler vessel that was filled with water of 10 kg for absorbing heat. The water tank has a diameter and height of 11.4 cm. and 10.2 cm, respectively. The storage temperature decreased from 250˚C with thermal loss to ambient during the time HTF flowed through the pipe that was submersed in the storage tank. The HTF temperature increased for around 50 min and went down to 100˚C a minimum temperature of load.
4. Results and Discussion
4.1. Charging
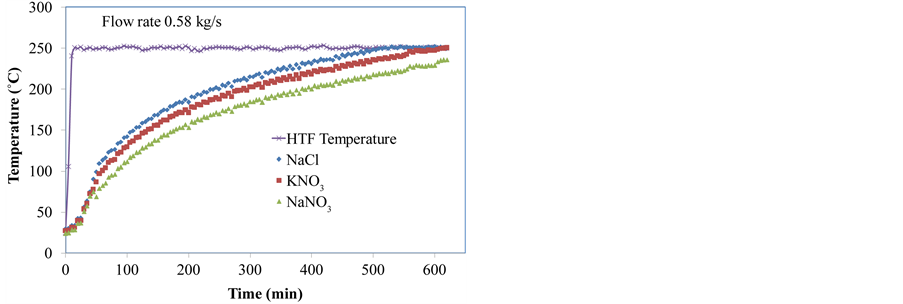
The temperature distribution of the NPCMs, during charging was taken at four different mass flow rates at 0.58, 0.87, 1.16 and 1.45 kg/s, respectively. For each mass flow rates, curve was plotted for variation of temperature at each point in the wax against time elapsed, to get melting curve in case of charging. Storage and outlet HTF temperatures are presented for comparing the temperatures between bulk HTF temperature and mixed storage temperature of charging experiment in Figure 2. The storage medium is also used thermal oil, as the same as HTF. The results of HTF temperature and storage temperature measurement were shown that HTF temperature increases rapidly in the first two hours while the storage temperature is slightly increases. The HTF oil has the maximum operating temperature at 250˚C. However, in this experiment, the control switch is used to cut off the heater at 250˚C before the maximum after 1 hour. The HTF temperature was set to constant at high temperature as its maximum, decomposition point. Figure 2(a) comparison substance (NPCM) with a oil flow rates of 0.58 kg/s for NaCl are charging of heat faster than KNO3 and NaNO3. The temperature of storage bed is averaged over the entire bed volume thus it is the function of time only. Variation of average bed temperature with time is shown in Figure 3 for NPCNs [6] . It is seen from Figure 2(a) that initially, the rise in the volume average temperature of storage beds is rapid and decreases with time. This is because of higher driving potential available for conduction during initial period of charging cycle and this driving potential reduces with time as the storage bed gains the heat of HTF. The charging rates of KNO3 and NaNO3 are more than that NaCl due to the high heat capacity and low thermal conductivity. The KNO3 and NaNO3 bed took 620 minutes for complete charging whereas NaCl gets completely charged within 500 minutes respectively. In Figure 2(b), stored thermal energy as a function of time is depicted for oil flow rate of 0.87 kg/s. The KNO3 and NaNO3 bed took 500 minutes for complete charging whereas NaCl gets completely charged within 300 minutes respectively. For Figure 2(c),
 (a)
(a)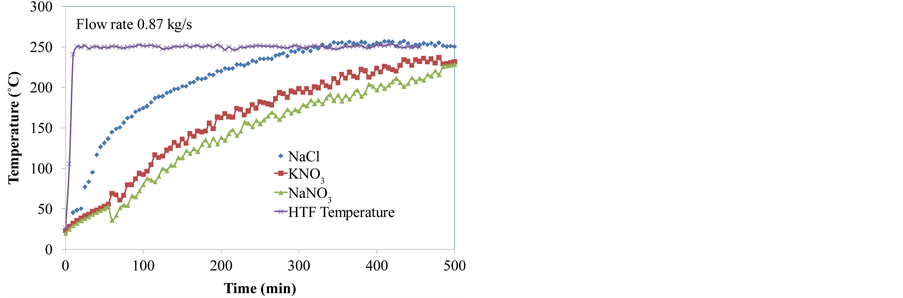 (b)
(b)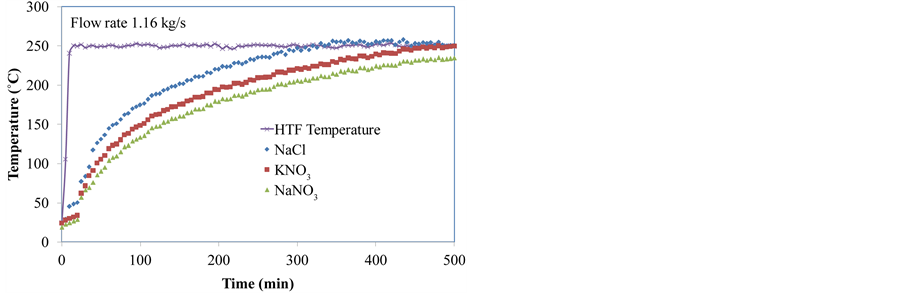 (c)
(c)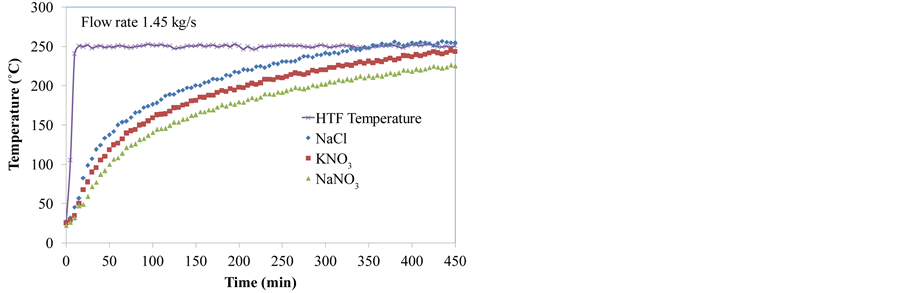 (d)
(d)
Figure 2. Heat transfer oil temperature over time for three different NPCM configurations and temperature of HTF and storage medium in charging experiment at 0.58, 0.87, 1.16, 1.45 kg/s.
stored thermal energy as a function of time is depicted for oil flow rate of 1.16 kg/s. The KNO3 and NaNO3 bed took 500 minutes for complete charging whereas NaCl gets completely charged within 270 minutes, respectively. The finally Figure 2(d), stored thermal energy as a function of time is depicted for oil flow rate of 1.45 kg/s. The KNO3 and NaNO3 bed took 450 minutes for complete charging whereas NaCl gets completely charged within 300 minutes, respectively. The temperature distribution of the NPCM during charging was taken at four different mass flow rates at 0.58, 0.87, 1.16 and 1.45 kg/s, respectively. Comparing of NPCMs with oil flow rates for NaCl are more charging heat transfer than KNO3 and NaNO3 due to the high heat capacity and low thermal conductivity of NaCl compare with KNO3 and NaNO3, which is consistent with the research of Horst Michels and. Robert Pitz-Paal [6] .
4.2. Discharging
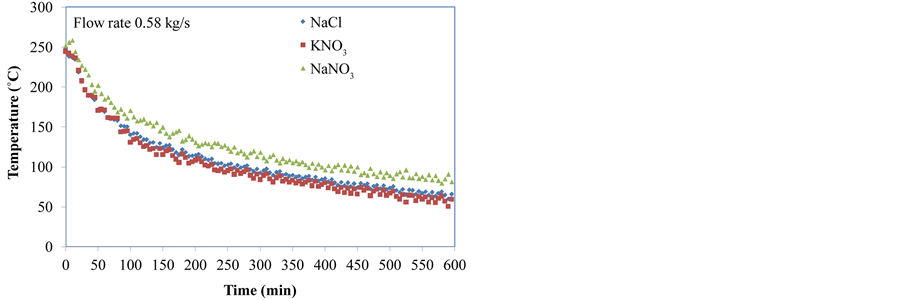
For discharging experiment, thermal oil was used as HTF for drawing the heat from the storage tank. This load power was adjusted for a long period of discharge. The storage temperature started at 250˚C with thermal loss to ambient as HTF flows through the pipe submersed in the storage tank. The extracted heat from the storage tank is affected on its increasing temperature. The HTF and storage temperatures are parallel decreased after the HTF temperatures reach the turning point, the beginning HTF temperature for discharging from storage medium to the water heat exchange. The period of discharge was in the range of 450 - 600 minutes. The initial temperature of HTF average room temperature at 25˚C, as shown in Figure 3, was increased to 250˚C - 270˚C, a turning point, and then decreased to 100˚C, the final point of discharge. Figure 3(a) comparison of NPCMs with oil flow rate of 0.58 kg/s, NaNO3 discharging heat transfer was slower than KNO3 and NaCl due to the low heat capacity and low thermal conductivity. The discharging time of NaCl was 260 minutes, NaNO3 was 200 minutes and KNO3 was 370 minutes respectively. For Figure 3(b) comparison of NPCMs with oil flow rate of 0.87 kg/s, NaNO3 was discharging heat transfer slower than KNO3 and NaCl due to the low heat capacity and low thermal conductivity. The discharging time of NaCl was 210 minutes, NaNO3 was 275 minutes and KNO3 was 170
 (a)
(a)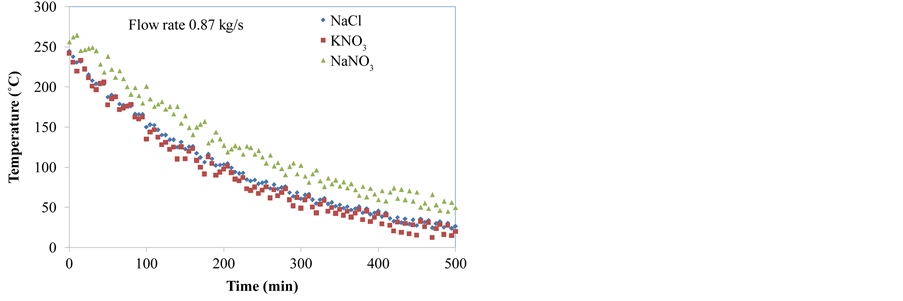 (b)
(b)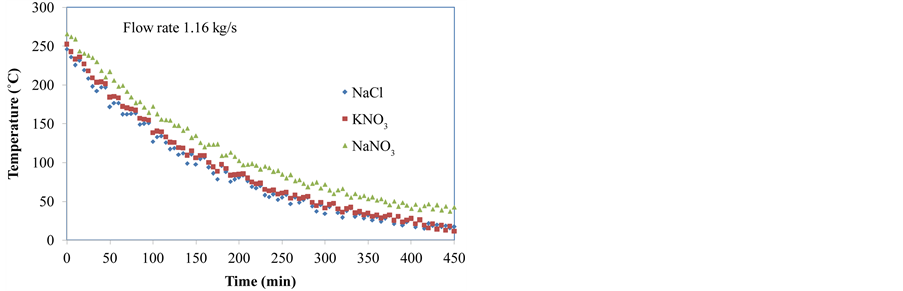 (c)
(c)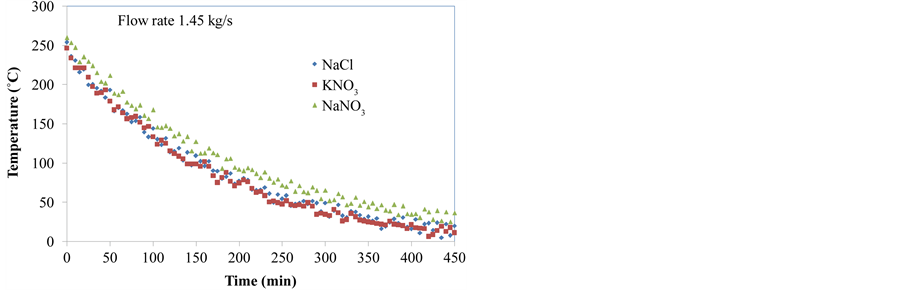 (d)
(d)
Figure 3. Storage discharging fluid temperatures decreasing at 0.58, 0.87, 1.16, 1.45 kg/s.
minutes respectively. In Figure 3(c), comparison of NPCMs with oil flow rate of 1.16 kg/s, for NaNO3 was discharging heat transfer slower than KNO3 and NaCl due to the low heat capacity and low thermal conductivity. The discharging time of NaCl was 140 minutes, NaNO3 was 205 minutes and KNO3 was 165 minutes, respectively. The finally Figure 3(d) comparison of NPCMs with oil flow rate of 1.45 kg/s for NaNO3 was discharging heat transfer slower than KNO3 and NaCl due to the low heat capacity and low thermal conductivity. The discharging time of NaCl was 165 minutes, NaNO3 is 195 minutes and KNO3 was 155 minutes, respectively. Comparing substances (NPCM) with oil flow rate. NaNO3 discharging heat was slower than KNO3 and NaNO3, so NaNO3 is appropriate to store thermal energy that corresponding to the literature of Horst Michels and Robert Pitz-Paal [6] .
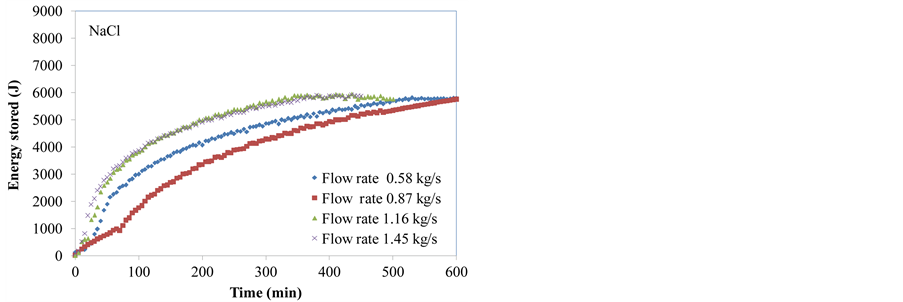
4.3. Energy Stored
The thermal energy storage rates at the bed of the system for the sodium nitrate (NaNO3), potassium nitrate (KNO3) and sodium chloride (NaCl) was shown in Figure 4. The amount of thermal energy stored in the storage materials at their respective charging times is calculated using Equation (5). Figure 4(a) comparison of flow with the energy stored of NaCl from figure was shown that the flow rate of 1.45 kg/s reached to time of TES faster than the rates in 1.16, 0.87 and 0.58 kg/s respectively for charging at 400 minutes. The Energy Stored at flow rate of 1.45 kg/s was 5912 J, the flow rate of 1.16 kg/s was 5898 J, the flow rate of 0.87 kg/s was 5769 J and a flow rate of 0.58 kg/s was 5712 J respectively. For Figure 4(b) comparison of flow with the energy stored of NaCl from figure was shown that the flow rate of 1.45 kg/s reached to time of TES faster than the rates of 1.16, 0.87 and 0.58 kg/s respectively for charging at 400 minutes. The Energy Stored the flow rate of 1.45 kg/s was 7939 J, the flow rate of 1.16 kg/s was 8167 J, the flow rate of 0.87 kg/s was 7704 J and a flow rate of 0.58 kg/s was 7350 J respectively. For Figure 4(c) comparison of flow with the energy stored of NaCl from figure was shown that the flow rate of 1.45 kg/s reached to time of TES faster than the rates in 1.16, 0.87 and 0.58 kg/s
 (a)
(a)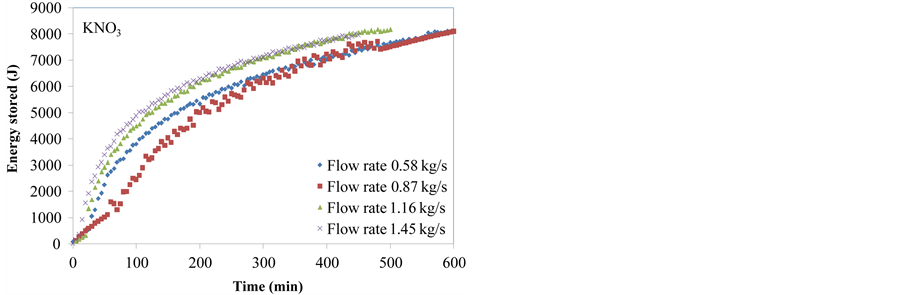 (b)
(b)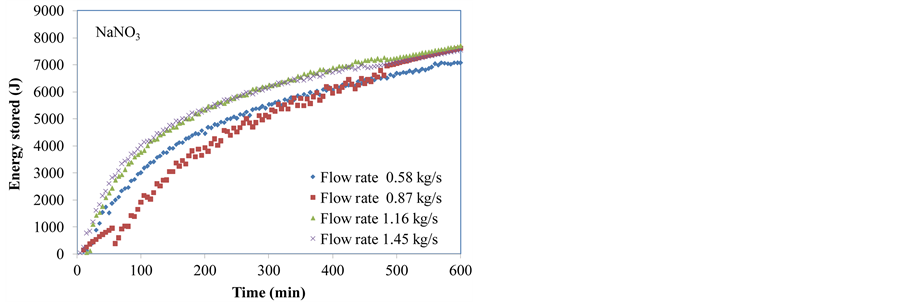 (c)
(c)
Figure 4. Flow rates of energy stored in NaCl, KNO3 and NaNO3.
respectively for charging at 400 minutes. The Energy Stored the flow rate of 1.45 kg/s was 6930 J, the flow rate of 1.16 kg/s was 7117 J, the flow rate of 0.87 kg/s was 6778 J and a flow rate of 0.58 kg/s was 6623 J respectively. For the thermal stored of NPCMs that compared for flow rate 1.45 were summarized as follows: flow rate, faster charging are optimum of flow rates 1.16, 0.87 and 0.58 kg/s respectively. The thermal stored of NaCl was lain from 5712 - 5912 J, KNO3 was lain from 7350 - 7939 J and NaNO3 was lain from 6623 - 6930 J respectively. The thermal energy stored for experimental results were get with along the KNO3, NaNO3 and NaCl respectively.
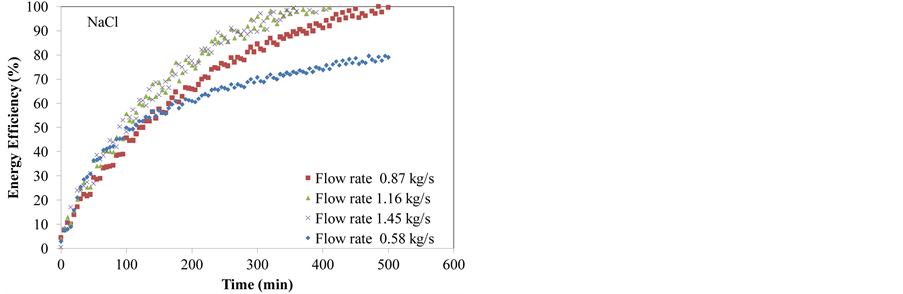
4.4. Energy Efficiency
The energy was degraded in the process of storage since it was extracted at a temperature lower than that it was previously stored. The energy efficiency of storage beds was evaluated using Equation (7). Energy efficiency variation with bed temperature difference during discharging cycle was shown in Figure 5. It was increased to 270˚C - 250˚C, a turning point, and then decreased to 100˚C, the final point of discharge. Figure 5(a) comparison of oil flow with energy efficiency of NaCl for a flow rate of 1.45 kg/s reached to time of energy efficiency faster than the rates in 1.16, 0.87 and 0.58 kg/s for discharging at a temperature of 100˚C. Energy efficiency of flow rate 1.45 kg/s was 66% at 165 minutes, the flow rate of 1.16 kg/s was 70% at 165 minutes, flow rate 0.87 kg/s was 68% at 210 minutes and a flow rate of 0.58 kg/s was 67% at 275 minutes, respectively. Figure 5(b) comparison of oil flow with energy efficiency of NaNO3 for a flow rate of 1.45 kg/s reached to time of energy efficiency faster than the rates in 1.16, 0.87 and 0.58 kg/s for discharging at a temperature of 100˚C. Energy efficiency of flow rate 1.45 kg/s was 66% at 40 minutes, the flow rate of 1.16 kg/s was 70% at 45 minutes, flow rate 0.87 kg/s was 68% at 105 minutes and a flow rate of 0.58 kg/s was 67% at 60 minutes, respectively. Figure 5(c) comparison of oil flow with energy efficiency of KNO3 for a flow rate of 1.45 kg/s reached to time of energy efficiency faster than the rates in 1.16, 0.87 and 0.58 kg/s for discharging at a temperature of 100˚C.
 (a)
(a)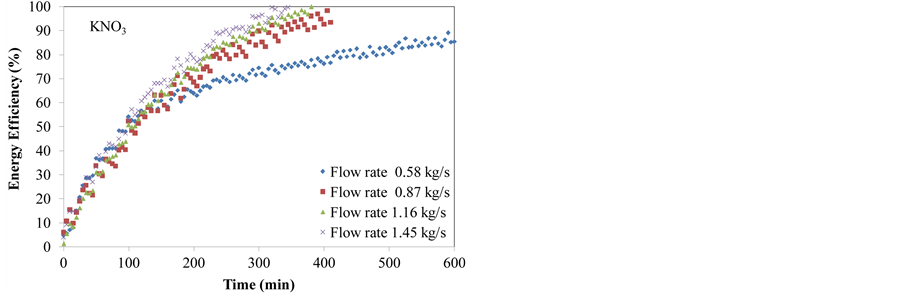 (b)
(b)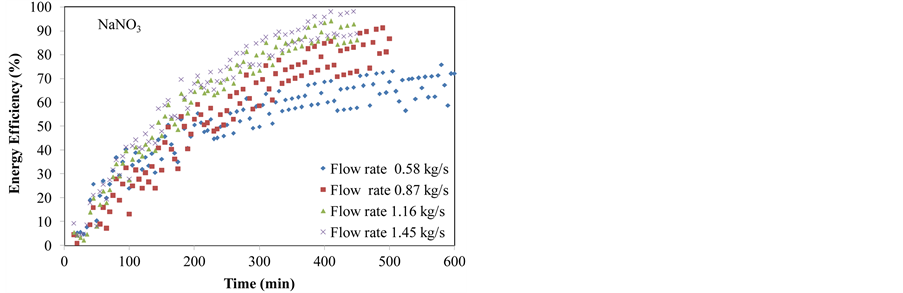 (c)
(c)
Figure 5. Variation of energy efficiency with bed temperature difference during discharging cycle in NaCl, KNO3 and NaNO3.
Energy efficiency of flow rate 1.45 kg/s was 66% at 40 minutes, the flow rate of 1.16 kg/s was 70% at 40 minutes, flow rate 0.87 kg/s was 68% at 40 minutes and a flow rate of 0.58 kg/s was 67% at 40 minutes respectively. For the thermal energy efficiency of NPCMs that compared for flow rate 1.45 were summarized as follows: flow rate, faster charging were optimum of flow rates 1.16, 0.87 and 0.58 kg/s respectively. The thermal energy efficiency of NaCl, KNO3 and NaNO3 were in the range of 66% - 70% for discharging at a temperature of 100˚C.
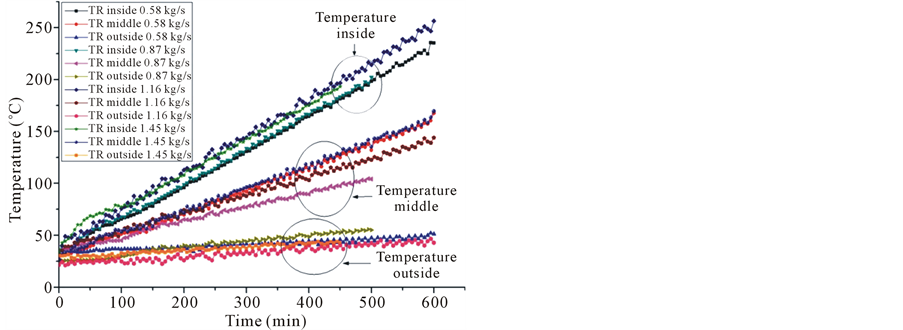
4.5. Radial Thermal Distribution
The study of the radial thermal distribution for thermal energy storage was using the three non-phase change materials that were selected for experimental investigations: NaNO, KNO3 and NaCl. The motor speed was adjusted to obtain the oil flow rates of 0.58, 0.87, 1.16 and 1.45 kg/s respectively. The radial flow rate of 1.45 kg/s was faster than of 1.16, 0.87 and 0.58 kg/s respectively, as shown in Figure 6. Figure 6(a) comparing the thermal distribution of temperature radial of the NaCl for TR inside the radial thermal distribution of temperature in the range of 185˚C - 220˚C, TR middle the thermal distribution of temperature in the range 95˚C - 150˚C and TR outside the thermal distribution of temperature in the range of 25˚C - 50˚C for experimental results compared at a time 500 min. Figure 6(b) comparing the thermal distribution of temperature radial position of the KNO3 for TR inside the thermal distribution of temperature in the range of 150˚C - 200˚C, TR middle the thermal distribution of temperature in the range 55˚C - 125˚C and TR outside the thermal distribution of temperature in the range of 25˚C - 45˚C for experimental results comparison at a time 500 min. Figure 6(c) comparing the thermal distribution of temperature radial position of the NaNO3 for TR inside the thermal distribution of temperature in the range of 125˚C - 200˚C, TR middle the thermal distribution of temperature in the range 65˚C - 25˚C and TR
 (a)
(a)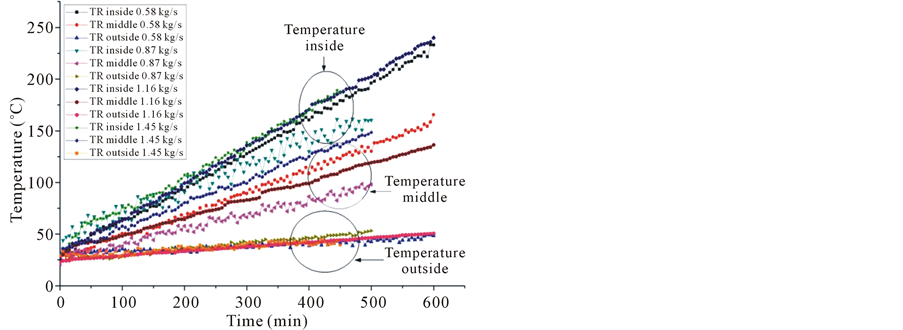 (b)
(b)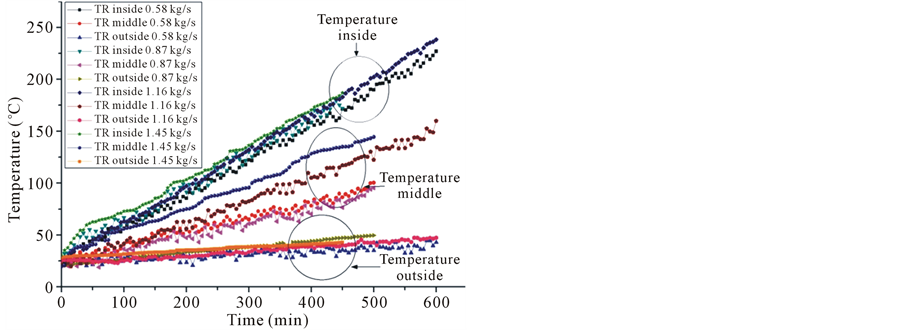 (c)
(c)
Figure 6. Flow rates and radial thermal distribution for thermal energy storage (a) NaCl (b) KNO3 (c) NaNO3.
outside the thermal distribution of temperature in the range of 25˚C - 40˚C for experimental results compared at a time 500 min. The thermal distribution of radial for thermal energy storage as follows: Thermal distribution radial of NaCl for TR inside, TR middle and TR outside were optimum of temperature down to NaNO3 and KNO3 respectively, due to the higher heat capacity and low thermal conductivity. Oil flow rates have resulted in the heat transfer for thermal distribution radial and physics properties of NPCMs.
5. Conclusion
The high solar thermal energy storage was presented in terms of thermal distribution as NPCMs experiments. For charging experiment, the increasing storage temperature depends on HTF temperature, flow rates, and initial temperature. The high heat transfer rate to storage medium was caused by a small flow rate but the storage temperature was closely increasing with the same temperature of other flow rates. The design of thermal storage from this conclusion is that the thermal storage with heat exchanger, appropriate HTF, motor pump for a slow charge, and the preheating for HTF discharge was used before discharge to heat HTF to turning point for rapid discharge process. The radial thermal distribution of NaCl for TR inside, TR middle and TR outside was optimum of temperature down to NaNO3 and KNO3 respectively, due to the higher heat capacity and low thermal conductivity. Oil flow rates have resulted in the heat transfer for radial thermal distribution and physics properties of NPCMs. Comparison of NPCMs with oil flow rates for NaCl was charging and discharging heat transfer than KNO3 and NaNO3 due to the high heat capacity and low thermal conductivity. The thermal stored NaCl ranged from 5712 - 5912 J; KNO3 ranged from 7350 - 7939 J and NaNO3 ranged from 6623 - 6930 J respectively. The thermal energy recovery of NaCl ranged from 4332 - 6028 J; KNO3 ranged from 6367 - 6887 J and NaNO3 ranged from 5453 - 7620 J respectively. The thermal energy stored for experimental results got with along the KNO3, NaNO3 and NaCl respectively. The thermal energy efficiency of NaCl, KNO3 and NaNO3 was in the range 66% - 70%.
Acknowledgements
The success of this thesis can be attributed to extensive support and assistance of the thesis advisor; Assistant Professor Dr. Sarayooth Vaivudh, the co-advisors; Associate Professor Dr. Wattanapong Rakwichian and Dr. Sukrudee Sukchai. I deeply thank for valuable advices and warm guidance, suggestions and encouragements throughout this study.
I would also like to thank: Nakhonratchasima Rajabhat University and Energy Policy and Planning Office (EPPO), Ministry of Energy Thailand, for sponsoring a Ph.D. scholarship, staffs of School of Renewable Energy Technology (SERT), Naresuan University for helps and useful suggestions, my dedicated friends for their warm supports and friendships. Thank you for research assist form Mr. Pongsak Jittabut and Dr. Pattanapong Jumrusprasert for revising English.
References
- Vaivudh, S., Rakwichian, W., Chindaruksa, S. and Sriprang, N. (2006) Heat Transfer of Charging and Discharging Experiment of High Thermal Energy Storage System by Thermal Oil as Heat Transfer Fluid. International Journal of Renewable Energy, 1, 17-21. http://www.sert.nu.ac.th/IIRE/V1N2(3).pdf
- Abhat, A. (1983) Low Temperature Latent Heat Thermal Energy Storage: Heat Storage Materials. Solar Energy, 30, 313-332. http://dx.doi.org/10.1016/0038-092X(83)90186-X
- Soontornchainacksaeng, T. (2005) Experimentation and Simulation of Thermal Energy Storage System with Non-Phase Change Materials. Journal of Mechanical Engineering, 50, 534-537.
- Somasundaram, S., Drost, M.K., Brown, D.R. and Antoniak, Z.I. (1993) Integrating Thermal Energy Storage in Power Plants. International Journal of Mechanical Engineering, 84-90.
- Soontornchainacksaeng T. and Tontiwongwatana, J. (1996) Simulation of Thermal Energy Storage with Water. Department of Mechanical Engineering, Faculty of Engineering, King Mongkut’s Institute of Technology North Bangkok, Bangkok.
- Michels, H. and Pitz-Paal, R. (2007) Cascaded Latent Heat Storage for Parabolic Trough Solar Power Plants. Solar Energy, 81, 829-837. http://dx.doi.org/10.1016/j.solener.2006.09.008
- Banaszek, J., et al. (1999) Experimental Study of Solid-Liquid Phase Change in a Spiral Thermal Energy Storage Unit. Applied Thermal Engineering, 19, 1253-1277. http://dx.doi.org/10.1016/S1359-4311(98)00120-3
- Khot, S.A., Sane, N.K. and Gawali, B.S. (2011) Experimental Investigation of Phase Change Phenomena of Paraffin Wax inside a Capsule. International Journal of Engineering Trends and Technology, 2, 67-71. http://www.ijettjournal.org/archive/ijett-v2i2p213
- Dietz, D. (1984) Thermal Performance of a Heat Storage Module Using Calcium Chloride Hexahydrate. Journal of Solar Energy Engineering, 106, 106-111. http://dx.doi:10.1115/1.3267552
- Regin, A. F., Solanki, S.C. and Saini, J.S. (2006) Experimental and Numerical Analysis of Melting of PCM inside a Spherical Capsule. Proceedings of Thermophysics and Heat Transfer Conference, San Francisco, 5-8 June 2006, 2006-3618.
- Roy, S.K. and Sengupta S. (1990) Gravity-Assisted Melting in a Spherical Enclosure: Effects of Natural Convection. International Journal of Heat and Mass Transfer, 33, 1135-1147. http://dx.doi.org/10.1016/0017-9310(90)90246-Q
- Khodadadi, J.M. and Zhang, Y. (2001) Effects of Buoyancy-Driven Convection on Melting Within Spherical Containers. International Journal of Heat and Mass Transfer, 44, 1605-1618. http://dx.doi.org/10.1016/S0017-9310(00)00192-7
- Shell Company (2010) Shell Heat Transfer Oil S2 High Performance Heat Transfer Fluid. http://s02.static-shell.com/content/dam/shell/static/ind/downloads/lubes-b2b/other-shell-lubricants/heat-transfer-oil.pdf