Energy and Power Engineering
Vol.06 No.09(2014), Article ID:49560,10 pages
10.4236/epe.2014.69021
Evaluation and Validation of Equivalent Five-Parameter Model Performance for Photovoltaic Panels Using Only Reference Data
Nouar Aoun1,2,3*, Rachid Chenni3, Boukheit Nahman1, Kada Bouchouicha2
1Department of Physics,
2Research Unit in Renewable Energies in the Saharan Medium, URER/MS, Development Centre of Renewable Energies, Adrar, Algeria
3MoDERNa Laboratory,
Email: *nouar.aoun@gmail.com
Copyright © 2014 by authors and Scientific Research Publishing Inc.
This work is licensed under the Creative Commons Attribution International License (CC BY).
http://creativecommons.org/licenses/by/4.0/


Received 27 June 2014; revised 1 August 2014; accepted 14 August 2014
ABSTRACT
This paper presents the modeling of electrical I-V verification of photovoltaic modules using five- parameter models based on the minimum usage of input data, which are usually provided by manufacturer’s datasheet. However, we vary them with a step of 10−4, the ideality factor  between 0.0 and 4 for each iteration in order to choose the
  value, which gives a minimal relative error of the maximum power point. Moreover, when
  is known, the other four parameters (i.e., Rs, I0, Iph and Rsh) are known. Finally, the effectiveness of this approach is then validated through comparison of the experimental results data under outdoor weather conditions.
Keywords:
Photovoltaic, Five-Parameters, Mono-Crystalline, Relative Error, Ideality Factor

1. Introduction
Due to the fossil fuels consumption, the increase of energy demand and the negative effect of pollution on the environment, the photovoltaic solar cell has become one of the promising green and renewable energy solutions. Ge- nerally, the three import points (i.e., maximum power points, short circuit current and open-circuit voltage) are provided on manufacturer datasheets under STC, i.e., 1000 W/m2, 25˚C and NOCT conditions, i.e., 800 W/m2, 47˚C.
For the modeling of (the) photovoltaic module, the use of equivalent circuits can be seen from the literature [1] -[4] . Reference [5] proposed an equivalent circuit called three-diode model. The third diode is to present the influence of the recombination of carrier and the leakage current. This model is more effective for the poly-sil- icon cells. The double exponential model [6] - [8] is the most accurate model, which contains seven unknown parameters. In general, this model is more accurate for polycrystalline silicon cells [9] .
To make the model easier to be solved, the equivalent circuit can be reduced to a circuit with a one-diode [10] - [14] . In addition, one diode model can be divided into two categories. The first is called the four parameters model [15] [16] , where the shunt resistance is neglected and considered as infinite. The second is called the five parameters model [17] - [19] , where the shunt resistance is considered as finite. A comparison of five different mathematical one-diode models was studied in detail in [20] . Reference [21] developed an empirical model to produce the current and voltage curve using five located points at the current-voltage curve. However, the method needs empirically coefficients parameters which are typically not available from the manufacturers datasheet. The coefficients are provided by the Sandia National Laboratory [22] .
A modified electrical five-parameter-model is presented in the present work. The multi-crystalline PV module is studied by the model under real meteorological conditions in the desert climate.
2. The Equivalent Circuit of a Solar Cell
The five-parameter model is one of the famous photovoltaic models in the scientific world. Figure 1 shows the one diode equivalent circuit which contains of a current source , a one diode (D), and series/parallel resistances (
 and
and , respectively).
The characteristic equation model is given by Equation (1).
 . (1)
. (1)
where  is the photocurrent (A),
  is the reverse saturation current (A), q is the electron’s charge (1.602 × 10⁻¹⁹˚C),
  the ideality factor,
  is Boltzmann’s constant and
  is the temperature of the
  junction (K),
  the series resistance
  and
and  the shunt resistance
 .
.
The five unknown parameters necessities to estimate before to solve Equation (1) are: γ, I0, Iph, Rs, and Rsh. The ideality factor value γ is indicative of the recombination mechanism, it has been observed in the  -Si cells. The increasing of solar radiation from 1.6 to 1.1 includes a decrease of the ideality factor in even range [23] . Moreover, at the three important manufacturer points at STC (i.e., short circuit, open circuit tension and maximum power points), Equation (1) can be written as:
Short-circuit current: ,
, 
 (2)
(2)
Open circuit tension: ,
, 
 (3)
(3)
Maximum power point: ,
, 
 (4)
(4)
In [24] , the Newton-Raphson method was chosen to calculate the series resistance value and also its convergence time for various initial value of series resistance . In this work, the authors developed this method to find the values of the four unknown parameters
 ,
,  ,
,  and
and  at various ideality factor values
 . To simplify the calculations, several authors take an ideality factor fixed value. In this paper we vary with a step of
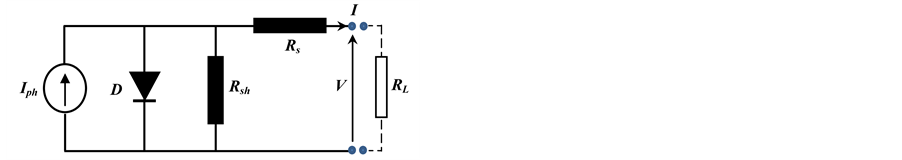
Figure 1. One-diode equivalent circuit for a PV panel.
10−2, the ideality factor  between 0 and 3, for each iteration, in order to choose its value which gives a minimal relative error of the maximum power. Reference [24] used the following relationship, Equations (5)-(7) relating to the photo-current
 , the saturation current
 , and shunt resistance
 .
.
 (5)
(5)
 (6)
(6)
 (7)
(7)
where:
 (8)
(8)
 (9)
(9)
 (10)
(10)
and
 (11)
(11)
The derivative of the maximum power point as expressed in Equation (12):
 (12)
(12)
The Equation (1) derivative compared to the tension can be expressed by:
 (13)
(13)
We introduce Equation (12) in (13), and then we define a  function given by:
 (14)
(14)
As  and
and  are depending on
 , the
, the  function behaves so. For the series resistance
 , we suppose that the initial value of the crystalline PV cells is given by the approximate function [25] .
 (15)
(15)
with the constants: .
.
 (16)
(16)
We note that Equation (16) is independent of material properties of the solar cell [26] .
3. Effect of Outdoor Condition on the Parameters
The unknown electrical parameters (i.e.,  ,
,  ,
,  ,
,  and
and ), was measured under standard test condition (1000 W/m2 and 25˚C) were rarely found in outdoor climate [27] . Moreover, the dependence of the parameters on the real conditions is described in Equations (17)-(21) [27] .
 (17)
(17)
 (18)
(18)
 (19)
(19)
 (20)
(20)
 (21)
(21)
where  is the band gap energy.
3.1. The Cell Temperature
To predict the performance of PV modules, it is necessary to know the PV cell temperature. In the literature, the modeling of PV cell temperature is obtained by several correlations mathematic models as a function of solar irradiance, ambient temperature and wind speed, etc., [28] [29] . Equation (22) is used to calculate the PV-cell temperature [30] .
 (22)
(22)
NOCT is the Nominal Operating Cell Temperature which is estimated at 20˚C, 0.8 kW∙m−2 and
3.2. The Maximum Power Point Current and Voltage
At any operating condition the maximum power point current and voltage in Equations (23) and (24) can be obtained by iterative method, we used the instrument fsolve in MatLab [31] .
 (23)
(23)
 (24)
(24)
3.3. Short Circuit Current and Open Circuit Voltage
Short circuit current and open circuit voltage of the panel at a cell temperature and irradiance other than the reference values, can be obtained by simultaneously solving Equations (2) and (3), using fsolve in MatLab/Simu- link [22] .
4. Outdoor Tested Photovoltaic Module
To validate the five parameter model we used an experimental data extracted from specific desert climate environment. The outdoor exposure tests were started on March 21-23, 2013 within the Research Unit in Renewable Energies in the Saharan Medium, Adrar, Algeria. A mono-crystalline silicon solar cell, i.e., S-Energy SM- XXXMH1 Series PV module was experimentally selected to perform the characterization and modeling method, Table 1 shows the electrical specifications in the module reference conditions. Table 2 shows the electric parameters calculated by the proposed model.
The measurements of the I-V photovoltaic characteristics were performed with a data acquisition MP-160 I-V curve tracer and a CM11 type Kipp & Zonenpyranometer (last calibrate February 2011) was used to collect the measurements of meteorological radiation data.
Also, the MP-160 I-V curve tracer was used for determining the important points (i.e.,  ,
,  ,
,  and
and ) and for tracing the IV curves. The panel temperature was calculated using Equation (22).
The maximum power point for a PV module and the relative error of maximum power point described by the model of this paper according to ideality factor, are illustrated in Figure 2 and Figure 3. The graph represented in Figure 2, reveals that the value of  we give a maximum power almost equal to that of the manufacturer.
It is noted that the maximum power point of the PV modules studied in this article is calculated according to the manufacturer datasheet by producing the maximum power point current and voltage, i.e., . This appears clearly in Figure 3, where the relative error is very weak for a value γ which corresponds to 1.58.
The manufacturer gives under the test standard conditions (1000 W/m2 with 25˚C) that the maximum power point equal to 250.2 W, and the simulation gives us . However, the value of the maximum power relative error is 5.63%.

Table 1. The modules nominal electrical specifications.
Table 2. Electrical parameters model for the selected PV module.
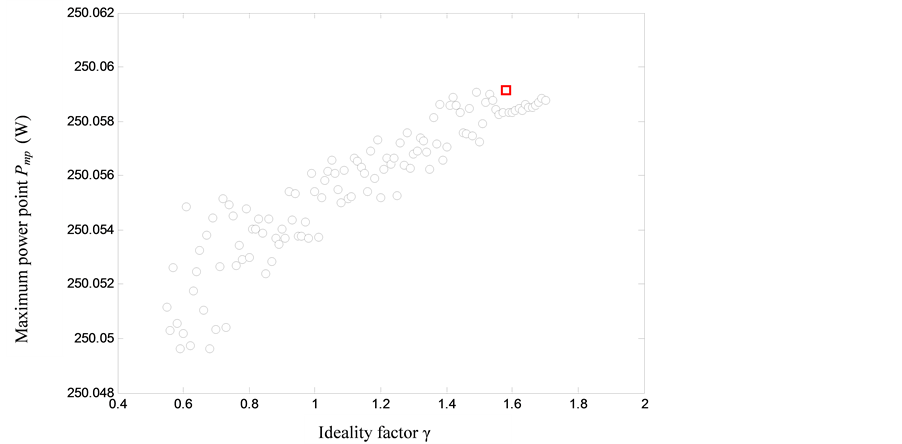
Figure 2. Maximum power point Pmp for different accepted values of ideality factor at SRC.

Figure 3. Relative Error for Pmp for different accepted values of ideality factor γ at SRC.
Figure 4 and Figure 5 indicate the current-voltage and power-voltage of all acceptable values of S-energy PV panel at SRC. It is observed that the majority of the simulated values results are in very good agreement with the three important points: short circuit current, maximum power point and open circuit voltage.
To verify also the model of this paper, it is necessary to observe the curves resulting from the five parameters under varied atmospheric conditions. However, Figure 6 and Figure 7 show the I-V and P-V characteristics of S-energy modules in outdoor conditions. Scattered points are the experimental results and solid line is the model results. It can be seen that the I-V and PV curves extracted with the method of this paper is on a good agreement at the current zone with experimental dataset. But at the zone of voltage and maximum power there is a difference between experimental and calculated values. The differences between the experimental data and the calculated values was occurred as a result of limitations in the cell model itself, as well as in the methods used to calculate cell temperature.
For the verification of the model at the three important points (i.e.,  ,
,  and
and ), Figure 8 to Figure 10 show the comparison between the simulated and experimental values of these points during the test days.
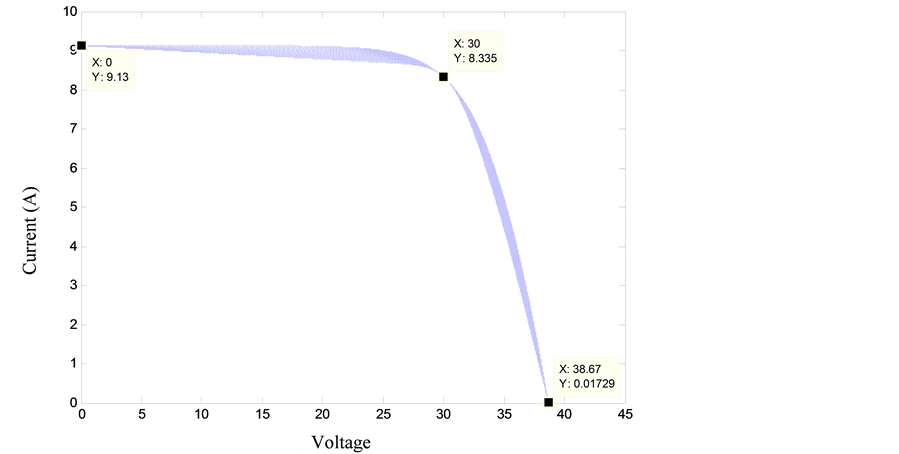
Figure 4. Current-Voltage curves at SRC at different values of ideality factor γ.
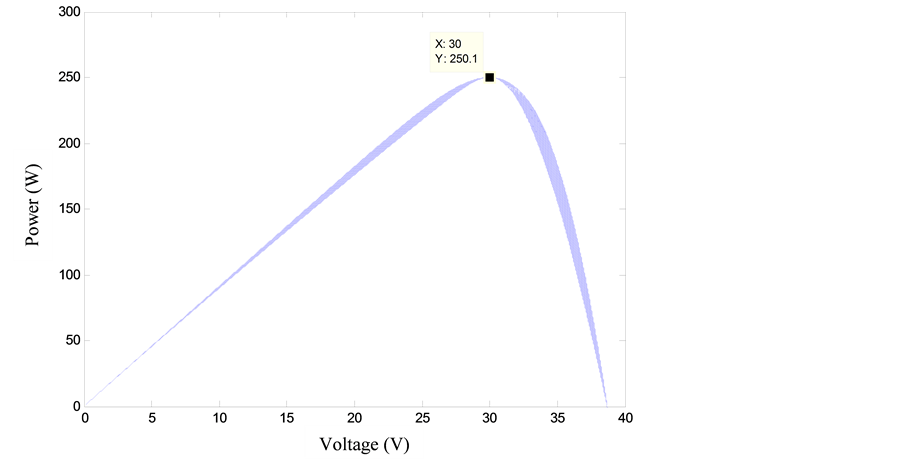
Figure 5. Power-Voltage curves at SRC for different values of ideality factor γ.
To compare the estimate results with the experimental measurements, the statistical parameters i.e., the root mean square error (RMSE) and the correlation coefficient  are used. The values of root mean square error RMSE and the correlation coefficient
  of maximum power point are respectively 11.0121 W and 0.9743. The correlation coefficient is greater than 0.97, a good agreement between the simulated and measured values is observed. However, the values of root mean square error RMSE and the correlation coefficient
  of short circuit current are respectively
In Figure 10 we observe a remarkable deviation between simulated and experimental values. However, the values of root mean square error RMSE and the correlation coefficient  of open circuit voltage are respectively 2.1746 V and 0.0677. By far, the open-circuit voltage point
  is more temperature dependent than the short circuit current
  [28] . From this, the disparity was also supposed to be mainly caused by the error estimate by the module temperature, which was theoretically measured.
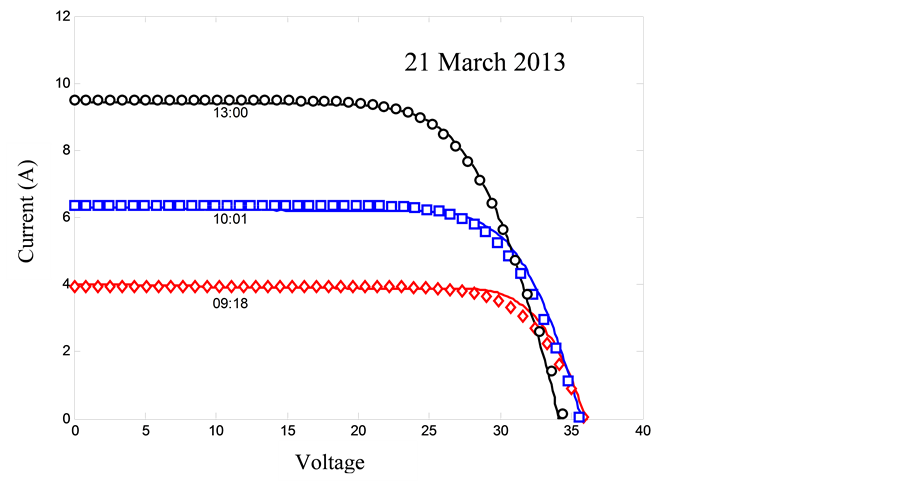
Figure 6. I-V characteristic curves (data from
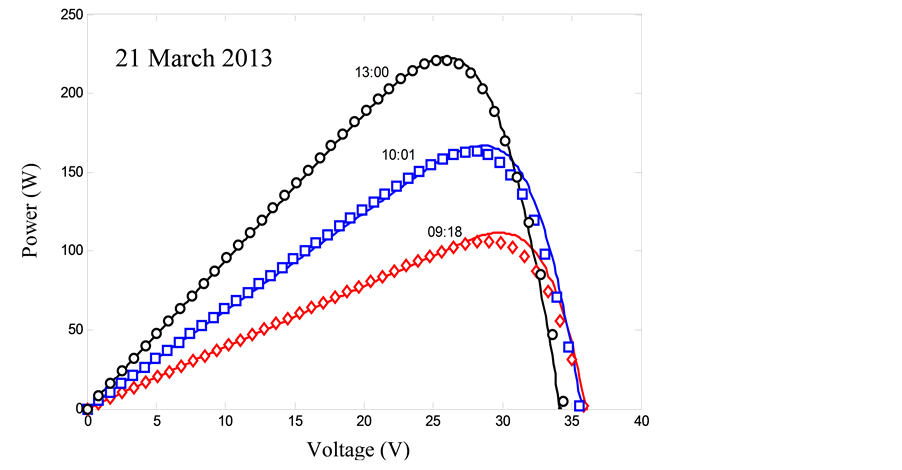
Figure 7. P-V characteristic curves (data from
5. Conclusions
In this paper, the modeling of the photovoltaic five-parameter-model was proposed. This approach is based on datasheet parameters with a minimum of input information to find and calculate the parameters ,
,  ,
,  ,
,  and
and  at STC (25˚C, 1000 W/m2).
The model accuracy was also analyzed through comparison between experimental data and simulation results using mono-crystalline PV-panel in outdoor climate. The plot of I-V and P-V curves extracted by the method of this paper is in a good agreement at the current zone with experimental data, but in the voltage zone and the maximum power zone there is a difference between experimental data and the calculated value. To present the model accuracy more clearly, the maximum power point, short circuit current and open circuit voltage during the three test days were described and evaluated. The agreement between the theoretical estimates and the experi-
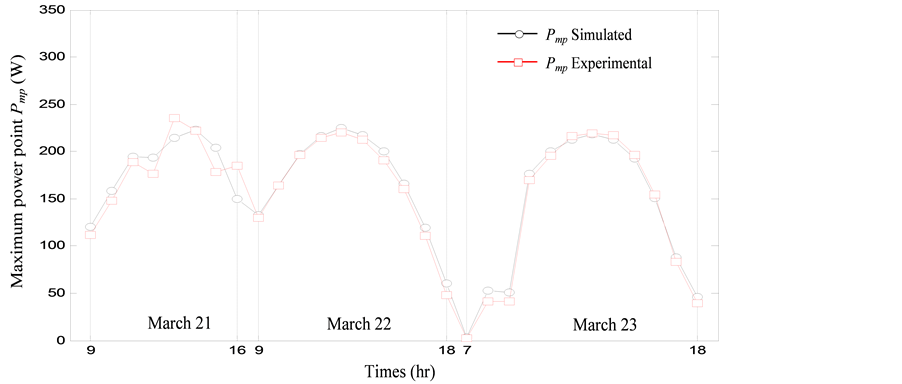
Figure 8. The simulated and experimental values of maximum power point during the three test days.
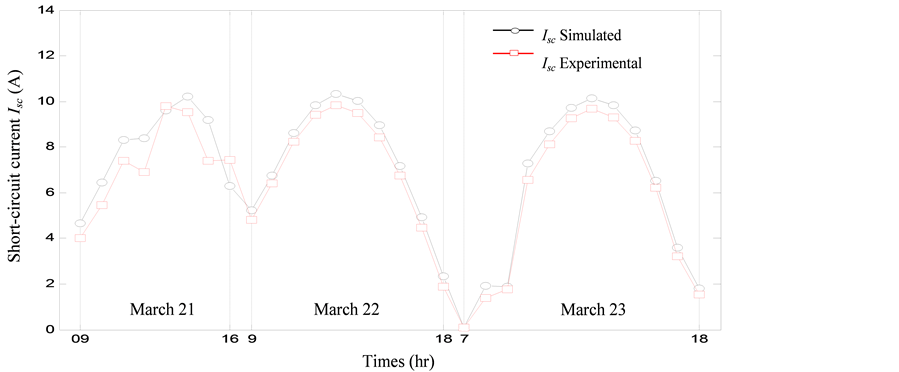
Figure 9. Simulated and experimental values of short-circuit current during the three test days.
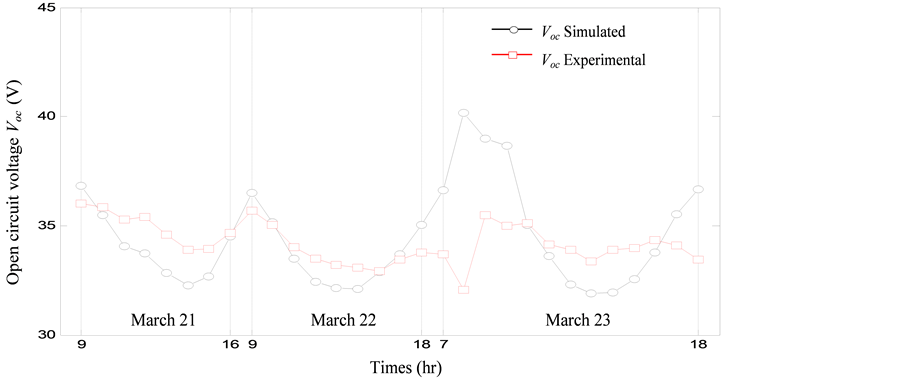
Figure 10. The simulated and experimental values of open circuit voltage during the three test days.
mental data of the maximum power point and short circuit current is very good in the whole days. The root mean square error RMSE and the correlation coefficient  of the maximum power point and short circuit current respectively is 0.9743 and 0.9743, which is very satisfactory. By far, we observe a remarkable deviation between theoretical estimate values and experimental data of the open-circuit voltage point Voc. However, the values of root mean square error RMSE and the correlation coefficient R2 of open circuit voltage are 2.1746 V and 0.0677, respectively.
Acknowledgements
The authors express their gratitude to
References
- Orioli, A. and
- Ding, K., Zhang, J., Bian, X. and Xu, J. (2014) A Simplified Model for Photovoltaic Modules Based on Improved Translation Equations. Solar Energy, 101, 40-52. http://dx.doi.org/10.1016/j.solener.2013.12.016
- Karamirad, M., Omid, M., Alimardani, R., Mousazadeh, H. and Heidari,
- Aoun, N., Chenni, R. and Bouchouicha, K. (2014) Experimental and Validation of Photovoltaic Solar Cell Perfor- mance Models in Desert Climate. Applied Mechanics and Materials, 492, 135-142. http://dx.doi.org/10.4028/www.scientific.net/AMM.492.135
- Nishioka, K., Sakitani, N., Uraoka, Y. and Fuyuki, T. (2007) Analysis of Multicrystalline Silicon Solar Cells by Modified 3-Diode Equivalent Circuit Model Taking Leakage Current through Periphery into Consideration. Solar Energy Material and Solar Cells, 91, 1222-1227. http://dx.doi.org/10.1016/j.solmat.2007.04.009
- Adamo, F., Attivissimo, F.,
- Veissid, N., Bonnet, D. and
- Chan, D.S.H. and Phang, J.C.H. (1987) Analytical Methods for the Extraction of Solar-Cell Single and Double-Diode Model Parameters from I-V Characteristics. IEEE Transaction on Electron Devices, 34, 286-293.
- Gow,
- Ma, T., Yang,
- Villalva,
-
- Siddiqui,
- Tian, H., Mancilla-David, F.,
- Chenni, R., Makhlouf, M., Kerbache, T. and Bouzid, A. (2007) A Detailed Modeling Method for Photovoltaic Cells. Energy, 32, 1724-1730. http://dx.doi.org/10.1016/j.energy.2006.12.006
-
- Lo Brano, V. and Ciulla, G. (2013) An Efficient Analytical Approach for Obtaining a Five Parameters Model of Photovoltaic Modules Using Only Reference Data. Applied Energy, 111, 894-903. http://dx.doi.org/10.1016/j.apenergy.2013.06.046
- Peng, L., Sun, Y. and Meng, Z. (2014) An Improved Model and Parameters Extraction for Photovoltaic Cells Using Only Three State Points at Standard Test Condition. Journal of Power Sources, 248, 621-631. http://dx.doi.org/10.1016/j.jpowsour.2013.07.058
- Lo Brano, V., Orioli, A., Ciulla, G. and
- Ciulla, G., Lo Brano, V.,
- King, D., Boyson, W. and Kratochvill, J. (2004) Photovoltaic Array Performance Model. SAND2004-3535, Sandia National Laboratories,
- De Soto, W., Klein, S.A. and Beckman, W.A. (2006) Improvement and Validation of a Model for Photovoltaic Array Performance. Solar Energy, 80, 78-88. http://dx.doi.org/10.1016/j.solener.2005.06.010
-
- Mustapha, B. (2006) Modélisation et Simulation d’un Système de Pompage Photovoltaïqu. Master’s Thesis, Oran University, Algeria.
-
- Benghanem, M. (2009) Low Cost Management for Photovoltaic Systems in Isolated Site with New IV Characterization Model Proposed. Energy Conversion and Management, 50, 748-755. http://dx.doi.org/10.1016/j.enconman.2008.09.048
- Attivissimo, F., Adamo, F., Carullo, A., Lanzolla, A.M.L., Spertino, F. and Vallan, A. (2013) On the Performance of the Double-Diode Model in Estimating the Maximum Power Point for Different Photovoltaic Technologies. Measure- ment, 46, 3549-3559. http://dx.doi.org/10.1016/j.measurement.2013.06.032
- Skoplaki, E., Boudouvis,
- Topic, M., Brecl, K. and Sites, J. (2007) Effective Efficiency of PV Modules under Field Conditions. Progress in Pho- tovoltaics: Research and Applications, 15, 19-26. http://dx.doi.org/10.1002/pip.717
- Luque, A. and Hegedus, S. (2003) Handbook of Photovoltaic Science and Engineering. John Wiley & Sons Ltd., Chi- chester. http://dx.doi.org/10.1002/0470014008
- Quarteroni, A., Saleri, F. and Gervasio, P. (2010) Calcul Scientifique Cours, Exercices Corrigés et Illustrations en Matlab et Octave. 2nd Edition, Springer-Verlag, Italia.
NOTES

*Corresponding author.