Energy and Power Engineering
Vol.5 No.9(2013), Article ID:39783,14 pages DOI:10.4236/epe.2013.59059
Energy and Cost Analysis of Cement Production Using the Wet and Dry Processes in Nigeria
Mechanical Engineering Department, Covenant University, Ota, Nigeria.
Email: olayinka.ohunakin@covenantuniversity.edu.ng
Copyright © 2013 Olayinka S. Ohunakin et al. This is an open access article distributed under the Creative Commons Attribution License, which permits unrestricted use, distribution, and reproduction in any medium, provided the original work is properly cited.
Received March 13, 2013; revised April 13, 2013; accepted April 20, 2013
Keywords: Wet Process; Dry Process; Cement; Crushing; Milling; Nigeria
ABSTRACT
The study evaluates the energy consumption of both wet and dry processes cement manufacturing plant in Nigeria. Energy consumption data collected for the period 2003 to 2011 were used to estimate the energy consumption of the crushing, milling, agitation, burning, grinding and bagging operations. The total energy evaluation was based on the three primary energy sources which include electrical, combustion and human. The total estimated energy intensities were 6545 MJ/ton and 4197 MJ/ton for wet and dry processes respectively. The percentage consumption of energy in each operation is 93.68 and 90.34% (burning), 2.11and 4.33% (milling), 0.43 and 0.67% (crushing), 1.39 and 0% (agitation), 2.12 and 3.90% (grinding), and 0.27 and 0.75% (bagging) of the total energy inputs for the wet and dry processes respectively. Furthermore, the average total energy cost of production showed that wet process is approximately 40% more cost intensive in cement production than the dry process while at the same time it is cost effective to run production on energy through gas powered plant than the national grid.
1. Introduction
Cement and/or clinker (cement primary input) is a commodity being produced in over 150 countries of the world [1]. It is an essential input into the production of concrete needed for building purposes and other construction related activities. According to Madlool et al. [2], world demand for cement was predicted to increase from 2283 million tonnes in 2005 to about 2836 million tonnes in the year 2010 [2]. The growth witnessed in recent days is largely driven by rising production in emerging economies and developing countries, especially in Asia. In 2006, almost 70% of the world production was in Asia (47.4% in China, 6.2% in India, 2.7% in Japan and 13.2% in other Asian countries) and about 13.4% in Europe [3].
In Nigeria, cement production grew rapidly from 2 million tonnes in 2002 to 17 million in 2011 [4]. This has led to the Nigeria cement industry accounting for 63.6% of the West African region’s cement output in 2011. Daily production is in excess of sales having recorded a zero importation from January 2012 to date and in the process of formalizing the exportation of cement to Economic Community of West African States (ECOWAS) and other neighboring countries. With the new Ibeshe cement factory by Dangote Group (commissioned in February, 2012), the country’s production capacity is expected to hit 39.4 million metric tonnes per annum thereby recognizing Nigeria as a cement producing country.
The cement sub-sector is one of the most energy consuming industries and it consumes approximately 12% - 15% of total industrial energy use [2,5]; since the industry sector plays a significant role in global energy consumption, its demand can be said to be majorly determined by population and socio-economic activities of a country. Large volumes of CO2 are however being emitted during cement production and it is believed that this sector represents 5% - 7% of the total CO2 anthropogenic emissions [6,7]. Since the associated energy used in the item production is extensively based on fossil fuels, environmental issues are further heightened and are of great importance. Therefore, a detailed review on the energy use and savings is necessary to identify energy wastage so that necessary measures could be implemented to reduce energy consumption in this sub-sector [2].
The escalating production of cement in the Nigeria thus calls for a proportionate rise in energy need and cost, and environmental issues relating with the CO2 emission. According to Fadare et al. [8], energy cost constitutes a major component of the overall production cost in manufacturing industries; it accounts for about 60.75% of the direct manufacturing cost of cement [9], hence energy utilization efficiency is a major determinant of the pro- fitability of manufacturing system.
In Nigeria, approximately 40 to 50 per cent of cement manufacturing cost is energy related; each tonne of cement requires 60 - 130 kg of fuel oil or its equivalent and about 105 kWh of electricity, depending on the cement variety and process type employed [10]. Cement production spreads across five geo-political zones due to the vast deposit of raw materials (Table 1). Kilns are majorly being fired by the use of heavy fuel oil (LPFO), coal and natural gas. However, the dearth of natural gas supply in the northern part of the country has restricted its use in kiln firing to plants located in the southern region.
In Adeloye [11], the unit cost of fuel component for cement production is as low as $6 per tonne in China as opposed to $30 per tonne in Nigeria; this has contributed largely to the high and persistent rise in unit cost of cement production. There is thus the need for the adoption of energy efficiency in cement production in Nigeria. Recently, there has been an increasing interest in using energy analysis techniques for energy-utilization assessments in order to attain energy saving, and hence financial savings [5]. In this study, in-depth energy evaluation is carried out on a large scale cement production firm, whose mode of operation is based on both the wet and dry processes by evaluating specific energy cosumption including electric, combustion, human as well as total energy of its various units of operation with a view to optimizing the plants’ energy consumption. Various energy savings measures peculiar to the industry were also presented.
2. Methodology
The plant adopted for the study has a wet production capacity of 1 million tonnes per year and a dry process output of 1.2 million tonnes per year. Six operation units are identified for the wet process while five units are identified for the dry process. The operation units considered for the purpose of this work include crushing, milling, agitation, burning, grinding and bagging (Figures 1 and 2). For each of these operation units, energy input was accounted for by noting and quantifying the type of energy that was used. The primary energy sources being utilized in the plant are electrical, combustion and manual energy; combustion energy is consumed only during the burning operation in cement processing. An inventory of the electrical motors with their respective
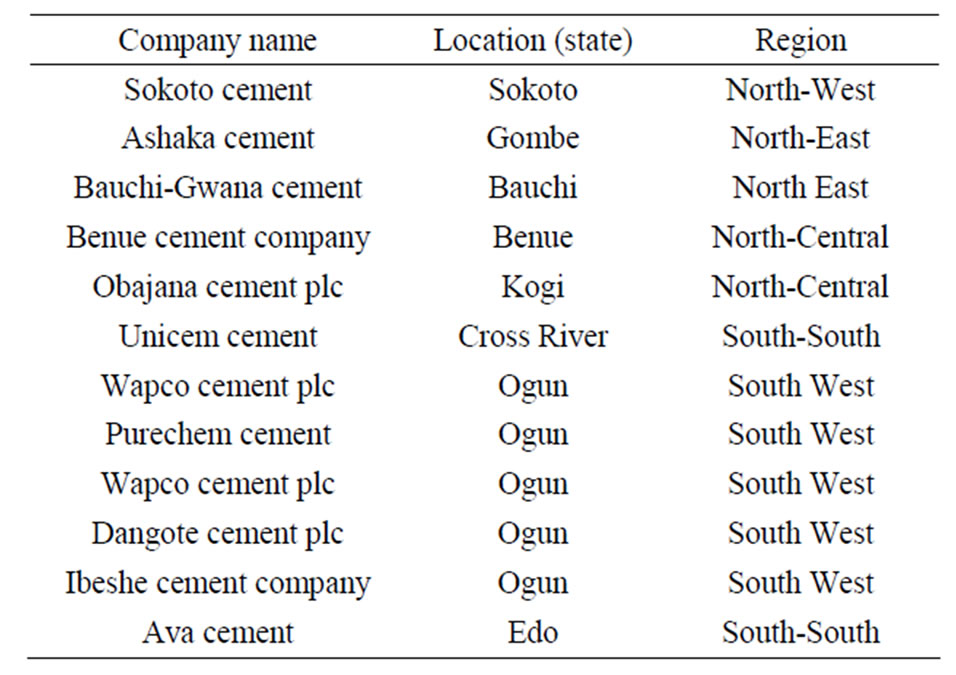
Table 1. Locations, capacities and status of cement companies in Nigeria.
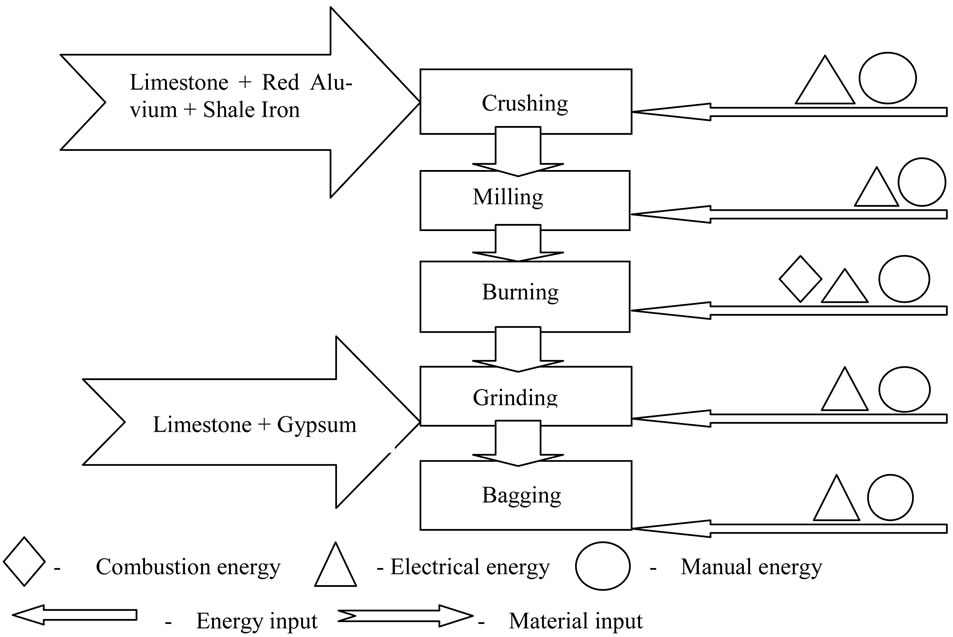
Figure 1. Material and energy flow diagram for dry process manufacturing of cement.
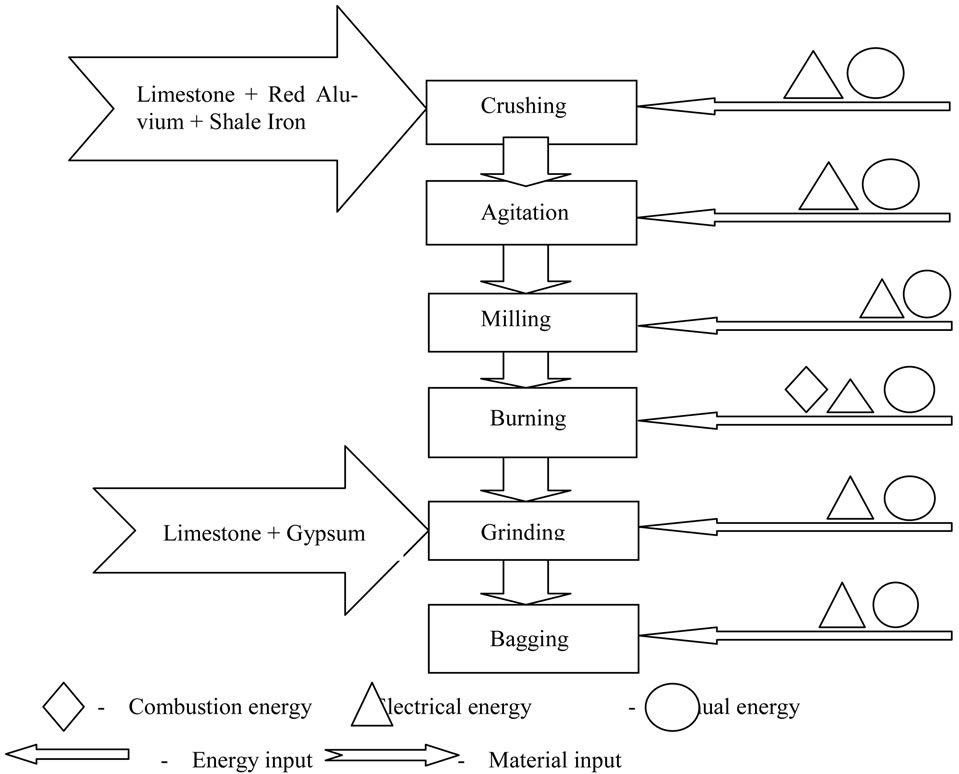
Figure 2. Material and energy flow diagram for wet process manufacturing of cement.
power ratings, power ratings of the other machines and heaters, personnel involved, time required for production and material flow in each of the units operation alongside with the units capacities were all collated from the respective departments in the production plant. The production processes were monitored and data for an eight year period ranging from 2003 to 2010 were collected.
2.1. Estimation of Energy Input
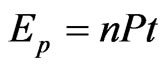
Energy inputs which comprise electrical, combustion and manual energy for each unit of operations were calculated yearly for the eight year period. According to Fadare et al. [8], the electrical energy usage by the equipment in kWh, was obtained as the product of the rated power of each motor and the number of hours of operation expressed in Equation (1); a motor efficiency of 80% was assumed to compute the electrical inputs mathematically as:
 (1)
(1)
where Ep is the electrical energy input, n is the electric motor efficiency, t is time taken in hours and P is power rating of each electric motor.
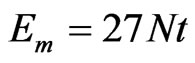
In Odigboh [12], at maximum continuous energy consumption rate of 0.30 kW and conversion efficiency of 25%, the physical power output of a normal human labourer in tropical climate is approximately 0.075 kW and sustained for an 8 - 10 hours workday. Hence, employing the current minimum wage paid by the federal government (Table 2), the cost of manual energy per unit operation was calculated in equation (2) as the product of the manual energy consumption and the unit cost of manual energy [12].
 (2)
(2)
where Em is the manual energy in MJ, 27 is the average 9.46%, 11.73 and 14.8% of the total energy required by the wet and dry production processes respectively (Table 5).
The lowest energy intensities came from manual energy which occupied about 0.42 to 0.83% and 0.45 to 2.21% for the wet and dry processes respectively with the study period.
As shown in Table 6, among all the operations undertaken in the wet process of cement manufacturing, burning operation has the highest consumption of the total energy required for manufacturing, ranging from 91.60%

Table 2. Manual energy cost per kWh.
power of a normal human labour in MJ, N is the number of persons involved in an operation while t in hours, is the useful time spent to accomplish a given task.
Combustion energy was estimated based on the volume of natural gas consumed in the burning operation and converted to appropriate energy units for analysis.
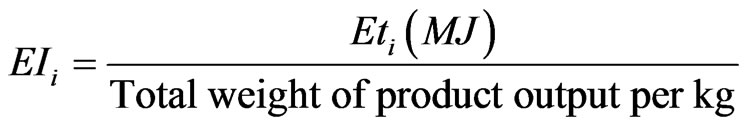
2.2. Estimation of Energy Intensity 
The energy consumed per unit product (energy intensity) for each of the unit operation  and the average energy intensity
  for cement production by either the dry or wet process is expressed in (3) and (4) as given in [8]:
 (3)
(3)
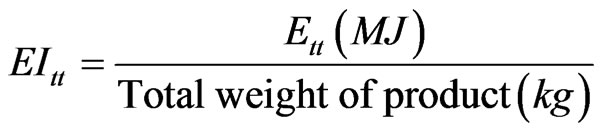 (4)
(4)
where  and
and  are the sums of energy inputs per unit operation and sum of energy inputs for all operations respectively.
3. Results and Discussion
Production of cement by the dry and wet processes follows the energy and mass flow diagrams shown in Figures 1 and 2 respectively. The electrical, manual and combustion energy consumption together with the material mass flow are allotted to each unit operations with the dry cement operation having five unit operations (crushing, milling, burning, grinding and bagging) and the wet cement process involves six units which includes crushing, agitation, milling, burning, grinding and bagging as indicated in the figures. Comprehensive description of cement manufacturing is given in [2]. The unit operations were carried out in continuous process and the energy inputs into each of the operations were accounted for by noting and quantifying the type of energy that was used. The energy consumption data that were obtained provided useful information on the source of energy requirement for each unit of operation.
Tables 3 and 4 show the computed total amount of energy requirement needed for cement production using the wet and dry processes respectively for year 2003; similar step is employed for the remaining study period (2004-2010) as summarized in Tables 5 and 6. The respective average total energy intensities were computed as 6545 MJ/ton and 4197 MJ/ton for the wet and dry processes from 2003 to 2010.It can further be deduced within the study period, that the overall combustion energy intensity ranged from approximately 90 to 92% for the wet process and 84 to 87% for the dry process whereas the proportion of electrical energy is between 7.28 and
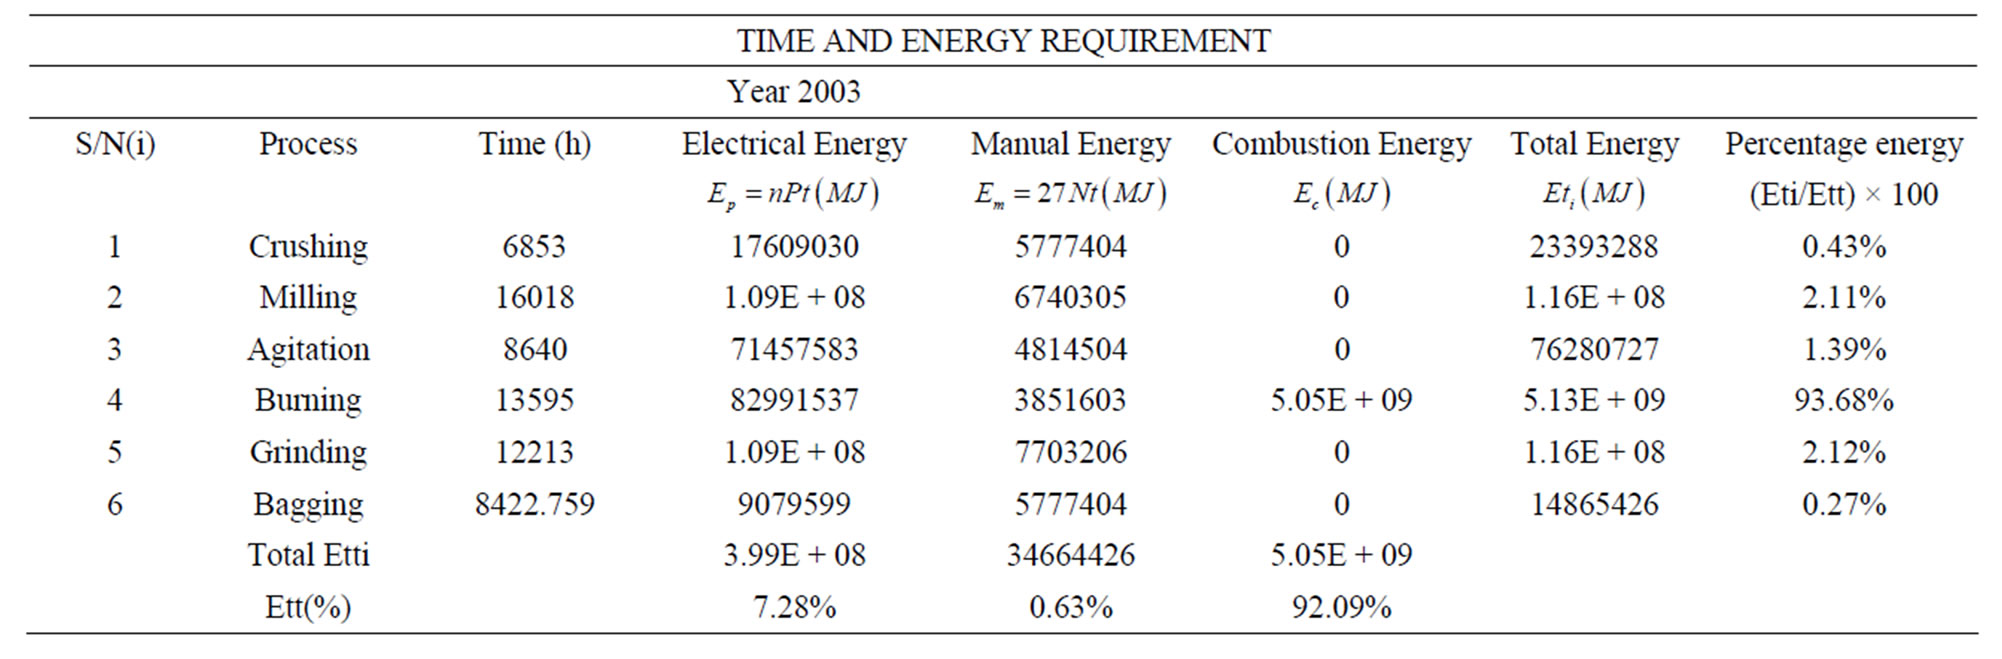
Table 3. Time and energy requirement for the wet process year 2003.
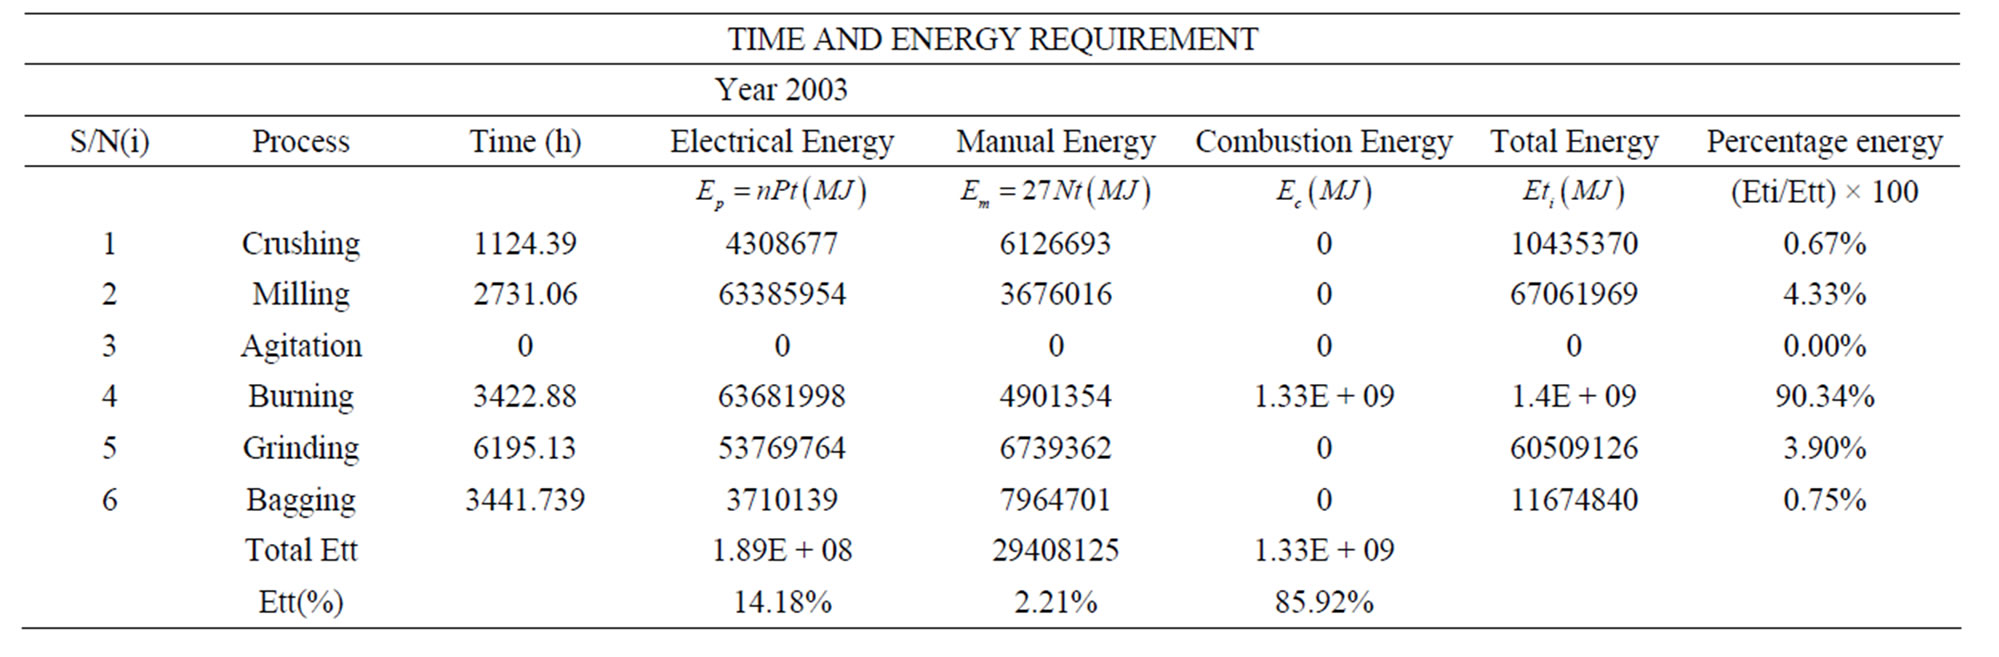
Table 4. Time and energy requirement for the dry process year 2003.
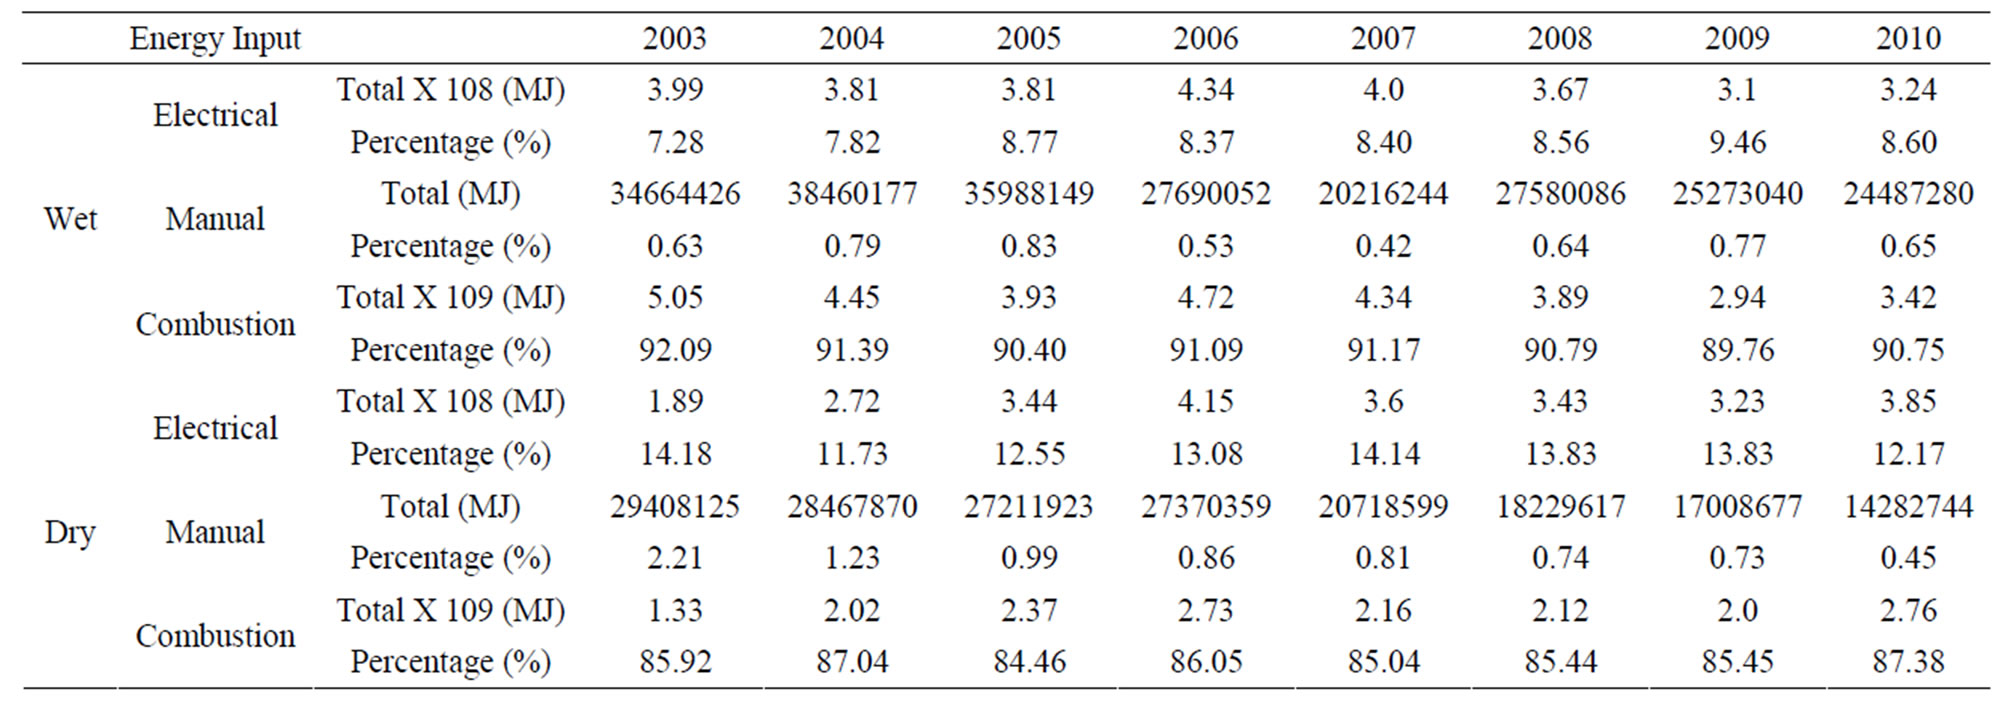
Table 5. Primary energy consumption pattern for wet and dry processes for year 2003-2010.
of the total energy in 2009 to 93.68% in 2003. Crushing operation ranged from about 0.19 to 0.48% while milling, agitation, grinding, and bagging operations ranged from 1.94 to 2.34%, 1.39 to 2.30%, 2.12 to 3.25% and 0.27 to 0.45% of the total energy respectively within the period. Similarly with the dry process (Table 6), burning consumed 89.02 to 90.34% of the energy representing the highest share, whereas milling and grinding consumed 3.95 to 4.35% and 3.70 to 5.78% respectively whilst 0.54 to 0.70% and 0.42 to 0.75% of the energy used for cement production were used for crushing and bagging respectively.
In addition, the wet cement processing is also found to consume approximately 5995.59 MJ/ton of overall energy intensity and employ about 35% of combustion energy per tonnage of cement more than the dry operation
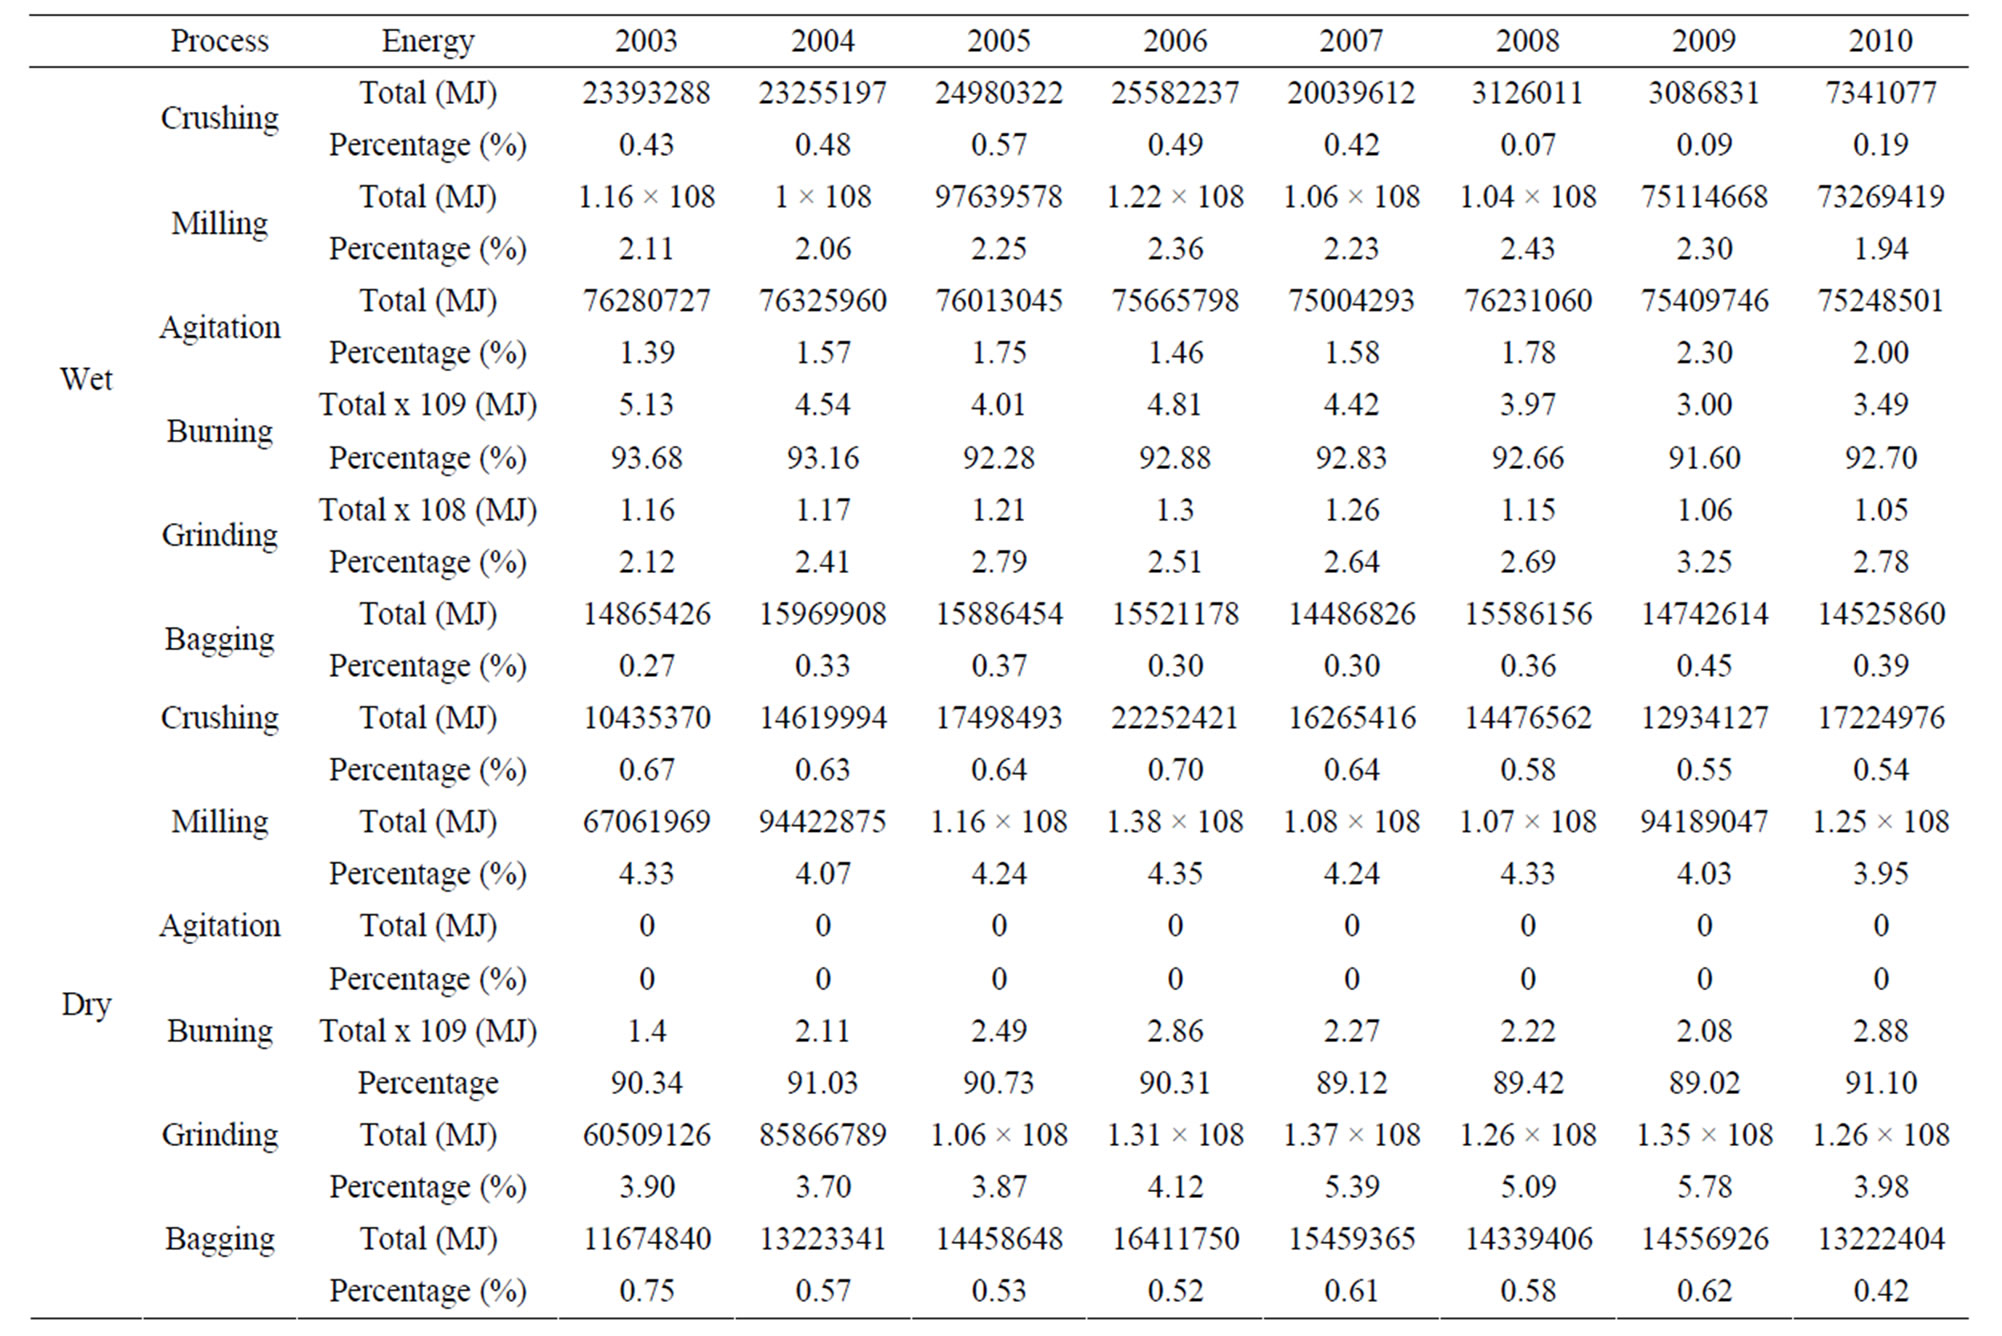
Table 6. Energy consumption pattern of different operations for the wet and dry processes in the cement plant for the year 2003 to 2010.
whereas the dry cement process consumes 3609.75 MJ/ ton. The high energy consumption of the wet process over the dry can be attributed to the mix preparation method adopted prior to burning of clinker in the kiln (water being added to the raw materials to form raw thick slurry), whereas the dry process is only based on the preparation of fine powdered raw meal by grinding raw material followed by drying. The required evaporation of wet slurry before calcinations makes the wet process more energy intensive and expensive than the dry process. This is further reflected in Figure 3.
3.1. Electrical Energy Intensities Per Unit Operation
Figures 4 and 5 depict the electrical energy intensities per unit operation for the wet and dry processes respectively. It can be observed that grinding operation consumes the highest electrical energy input of 146 MJ per tonnage of product in the wet manufacturing process of cement production, followed by burning, milling, agitation, crushing and bagging with 118, 90, 22, 19 and 15 MJ/ton in that order. However, in the dry process, burning has the highest electrical intensities among all the operations with an approximate value of 170 MJ/ton whereas grinding, mill-

Figure 3. Combustion energy intensities.
ing, crushing and bagging consume 141, 115, 18 and 15 MJ/ton of electrical energy input respectively. Dry process is not subjected to agitation operation.
Furthermore, going by Figures 4 and 5, electrical energy intensity consumed in the burning operation of dry process is about 31% higher than that in the wet process of cement. The dry process cement kiln consumes more electrical energy per ton because of the multiple induced draft fans used in the control of air movement through the cyclones and the length of the kiln; the wet process
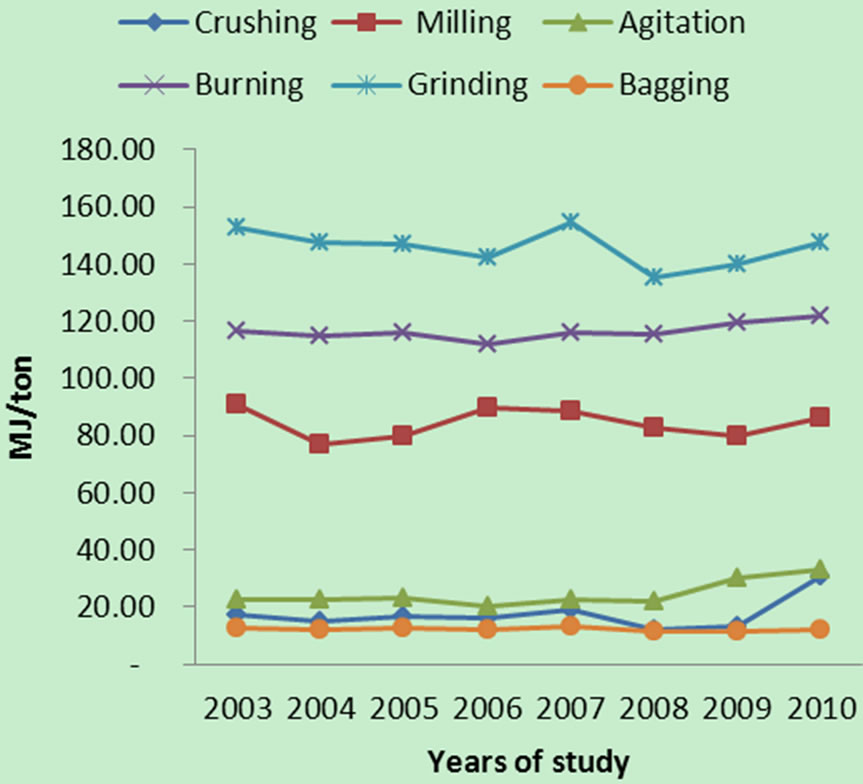
Figure 4. Electrical energy intensities for different process in wet process plant.
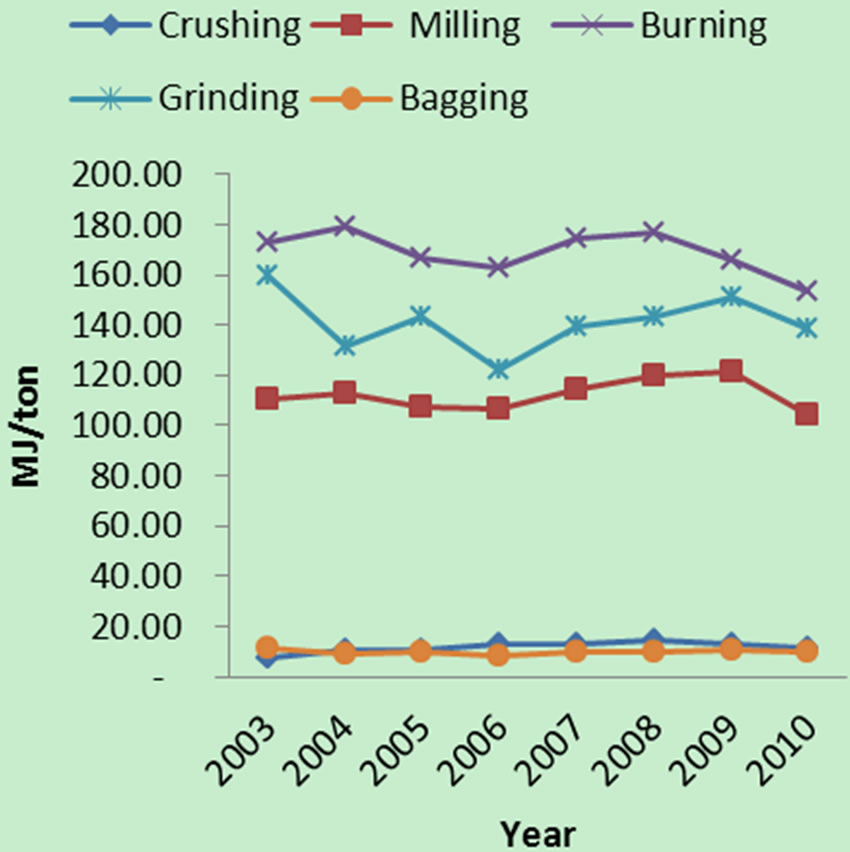
Figure 5. Electrical energy intensities for different process in dry process plant.
cement kiln only makes use of one induce draft fan along the length of the kiln with no cyclones attached.
3.2. Manual Energy Intensities
Manual energy is required for both wet and dry manufacturing process of cement. Figure 6 shows manual energy intensities for the different operating units in cement production; over the study period, crushing operation requires the highest manual energy intensities for the wet process and bagging for the dry process, followed by the grinding operation and the lowest being the crushing for the dry process and agitation for the wet process. It was also observed during the course of the research work that kiln operation has the highest level of skilled labour, because of the level of system and process so-
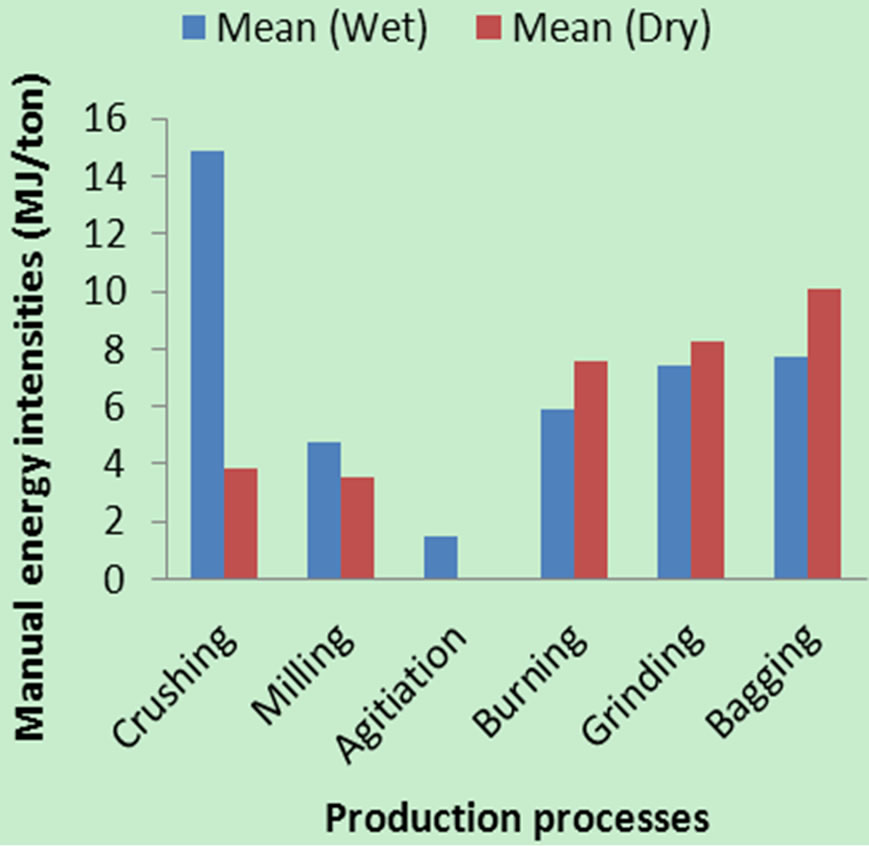
Figure 6. Manual energy intensities for the wet and dry processes within the study period.
phistication, while bagging operation has the highest level of unskilled labour.
3.3. Cost Analysis
The national grid and gas turbine power plant are the two primary sources of electrical energy utility in the cement plant under study.The use of natural gas fired power plant by manufacturers during production is very necessary to ensure smooth production operations and protection of sensitive manufacturing equipment due to the persistent power outages (energy crisis) being witnessed in all sector of the country. A situation whereby 0% power outage involving the use of national grid for the total production time, and situation of 100% power outage involving only the use of electrical power from the gas turbine power plant are considered in calculating the cost of energy inputs of the plant.
The cost of electrical energy based on the national grid was calculated as the product of the energy consumption per unit operation and unit cost of energy (Tables 7 and 8) while the electrical energy cost based on the gas powered plant was computed as the product of the gas consumption of the power plant in standard cubic feet (scf) and the unit cost of gas (Naira per standard cubic feet) as listed in Table 9. The current minimum wage per month by the Federal Government (Table 2) was used to compute the unit cost of manual energy and the appropriate cost/kWh generated in accordance with Equation (2).
The energy costs of the different unit operations for the production of cement by wet and dry process, with the use of national grid and gas turbine power plant as separate sources of electrical energy for year 2003 are given in Tables 10-13 while Tables 14-17 depict the summary of cost values for the duration of study.
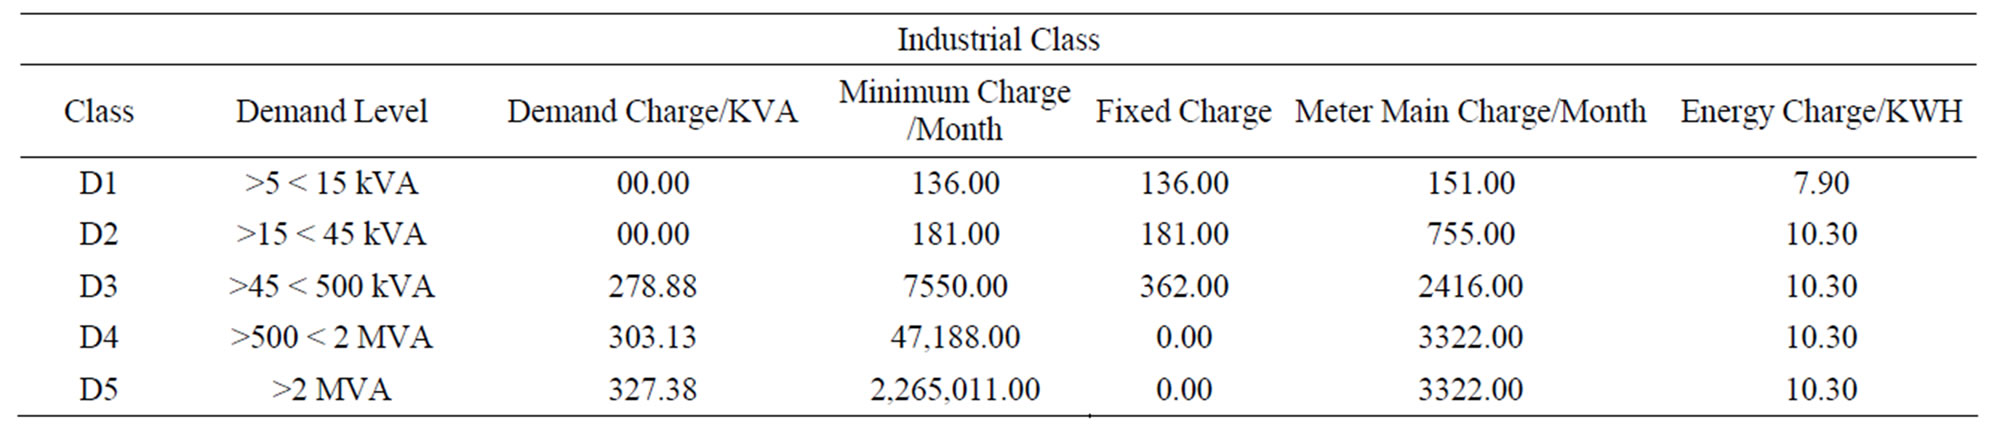
Table 7. Electrical energy tariff schedule from July 1st. 2009 from Power Holding Company of Nigeria (PHCN).
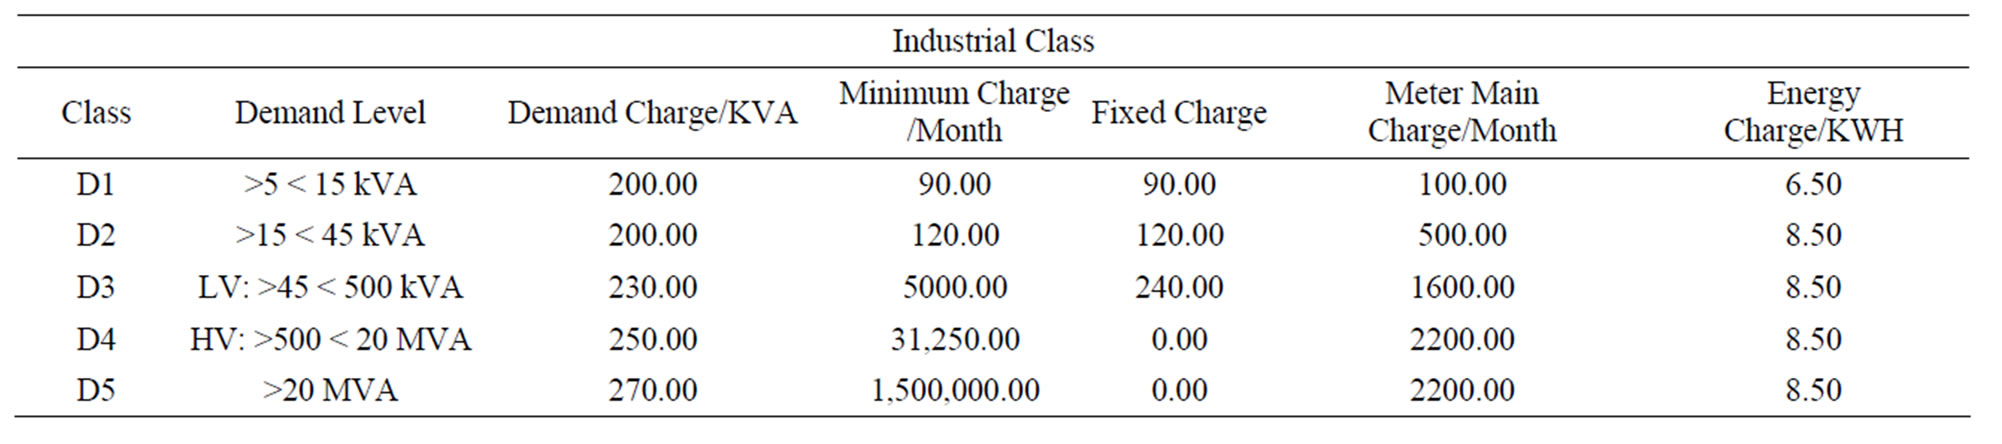
Table 8. Electrical energy tariff schedule from February 1st. 2002 to June 30th. 2009 from Power Holding Company of Nigeria (PHCN).
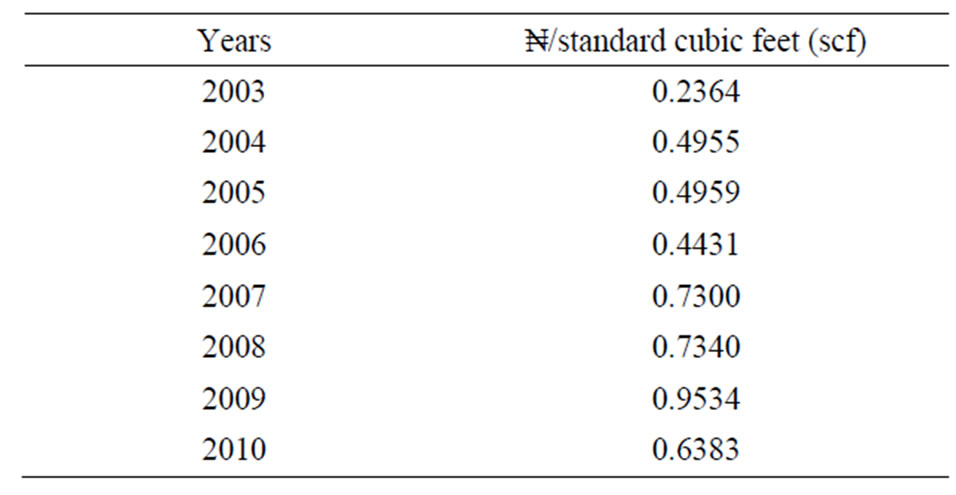
Table 9. Price of natural gas in Naira per standard cubic feet.
3.4. Total Energy Cost Using Combustion Energy, Manual Energy and Electrical Energy from National Grid and Gas Turbine Plant for Wet and Dry Processes
It can be observed as computed in (Table 14) that the average total energy cost of cement production by the wet process using power from national grid and manual energy during the study period has the highest in 2009 and the least in 2003. Among the constituents of the estimated total cost of energy, combustion cost records the highest average followed by electrical cost and the least being manual energy as 63, 25 and 13% respectively. It can also be seen from the table that the highest in combustion energy cost is obtained in 2009 representing 73.31% for the year while manual energy cost representing 14.22% in 2003 gave the lowest in the study period. In the same vein, for the cost of producing cement using the dry process, the largest portion is obtained in 2010 and the lowest in 2003. However, cumulative average of the constituent costs gave combustion energy as the highest of the total cost with 51% and the lowest as 15% with the manual energy for the whole duration of study. All the study year gave the largest cost estimate as combustion energy and the least estimate as manual energy in both the dry and wet technique of cement production.
Table 15 depicts the total energy cost using power supply from gas turbine plant and manual energy for the wet and dry processes. It shows similar trend in cost with Table 14; for the two production processes, cumulative average of combustion energy cost has the highest values having 67 and 59% while that for manual energy has the least values with 14 and 17% for the wet and dry techniques respectively; also, across the study duration, cost of combustion energy is the highest in 2009 and electrical energy is the least in 2003 for the two processes. Furthermore, the average total energy cost of production showed that wet process is approximately 40% more cost intensive in cement production than the dry process. However, comparing the two tables, it is cheaper to run production on energy based on gas powered plant than the national grid.
Table 16 consists of energy cost for each production operations for the wet and dry processes using power supply from national grid. It can be observed that burning operation consumes the largest energy as reflected in the cost with 70 and 64% for the wet and dry processes in that order, followed by grinding, milling, agitation (wet), bagging whereas the least is in crushing operation with 2.5 and 3.3% for the wet and dry techniques respectively for the study period; the dry process is not employ agitation operation. On the yearly basis within the study period,
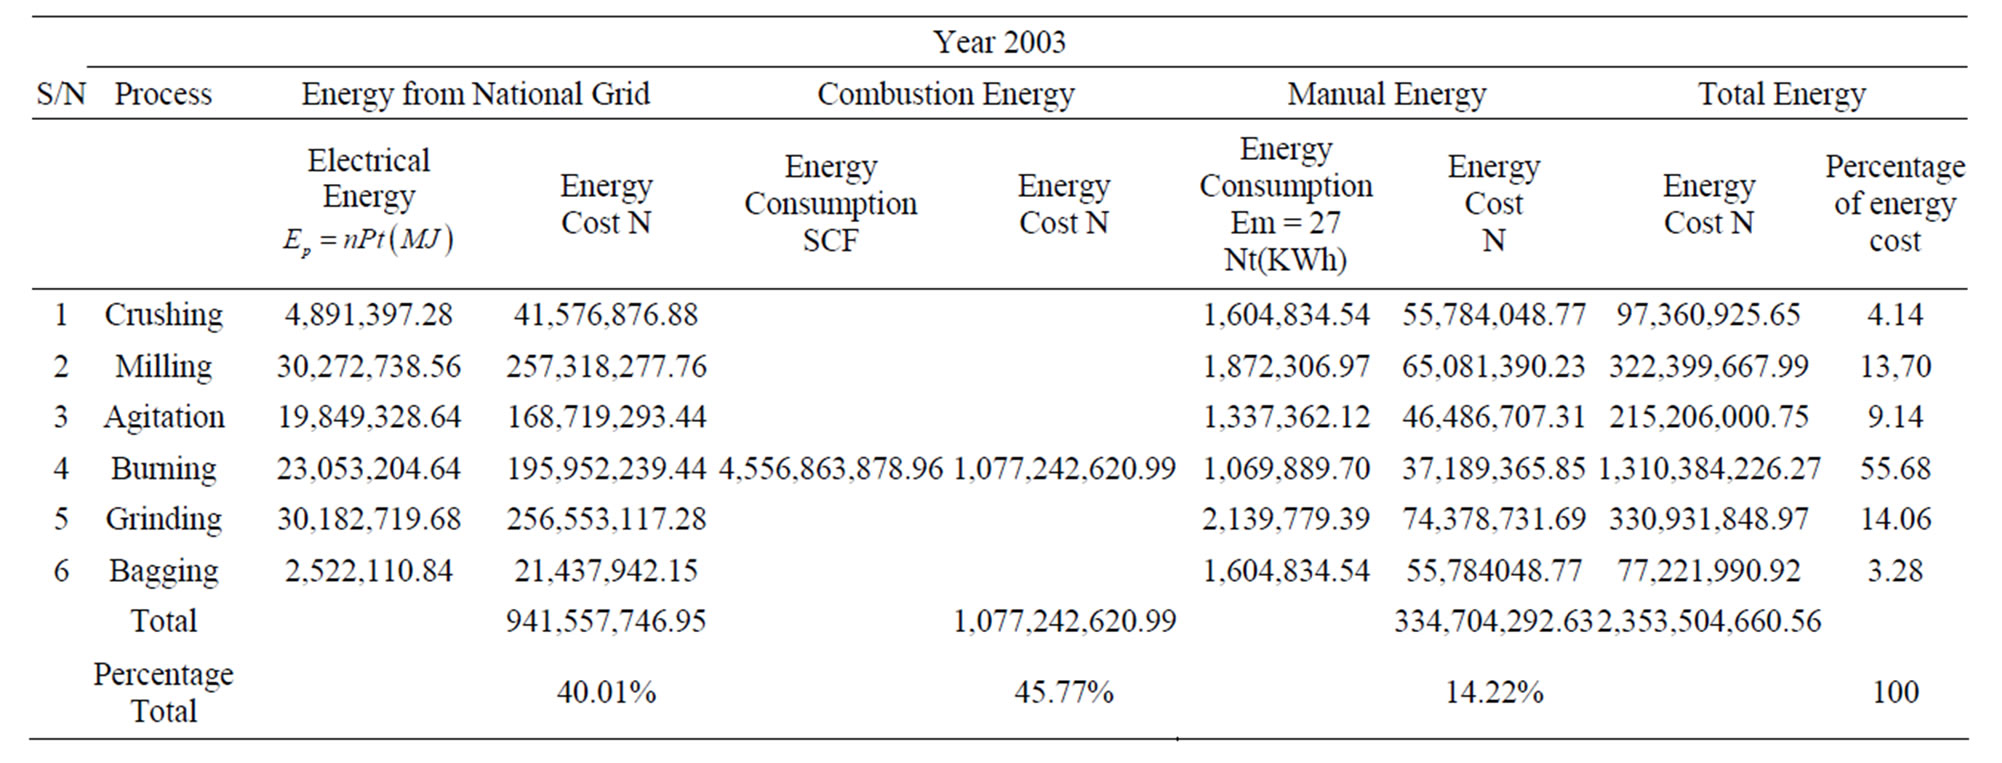
Table 10. Total energy cost using combustion energy, manual energy and electrical energy from national grid supply for wet process.
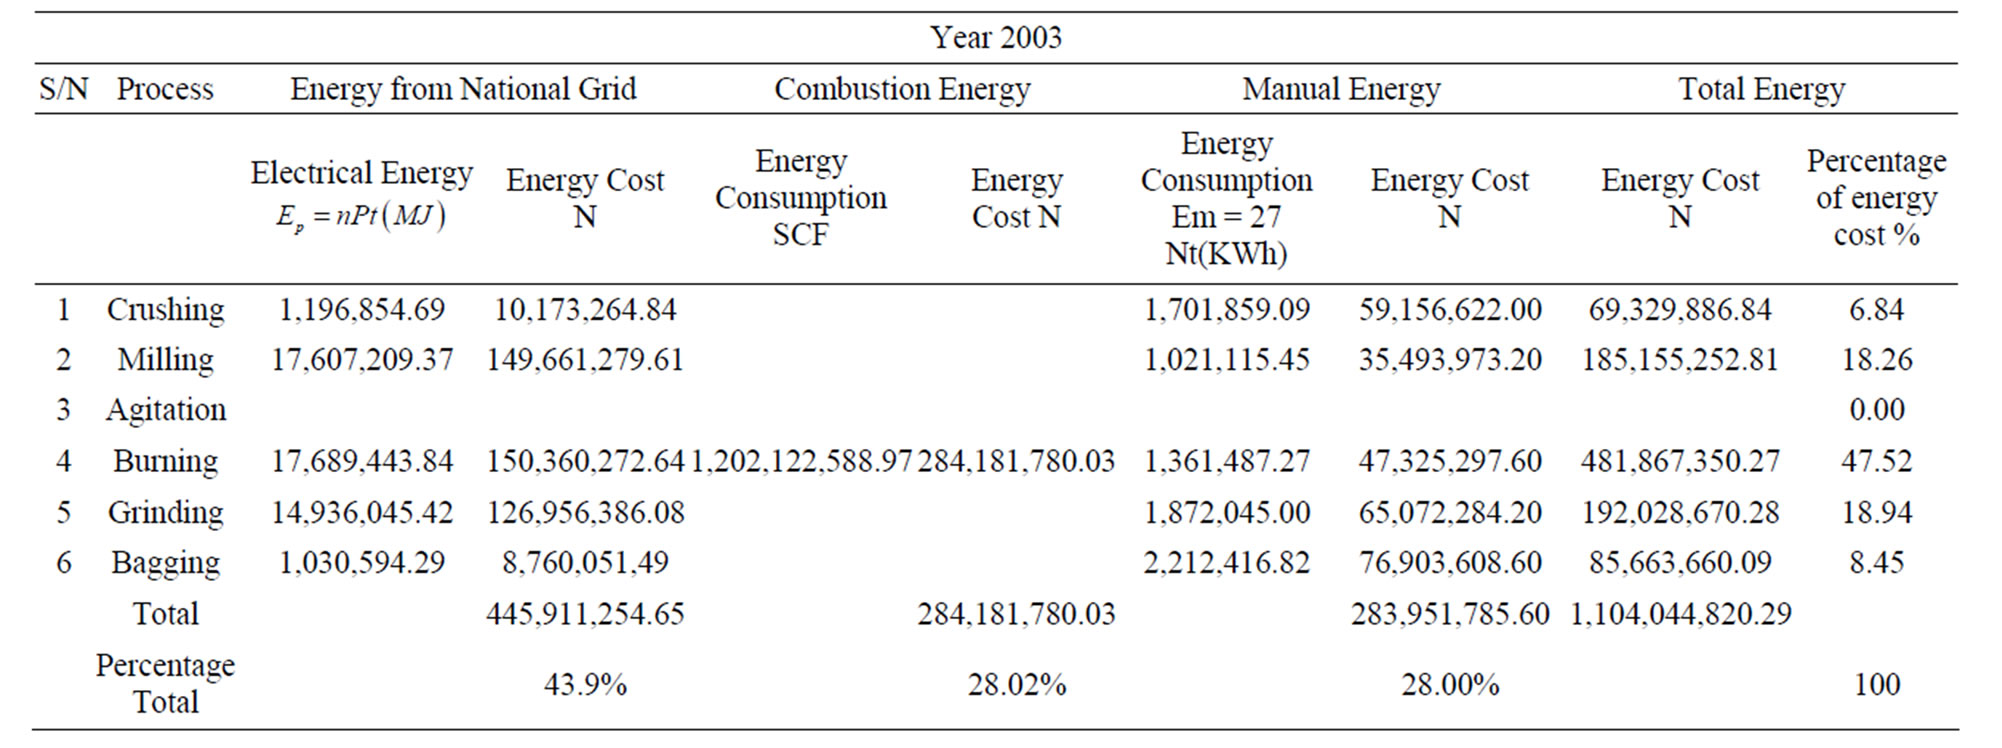
Table 11. Total energy cost using combustion energy, manual energy and electrical energy from national grid supply for dry process.
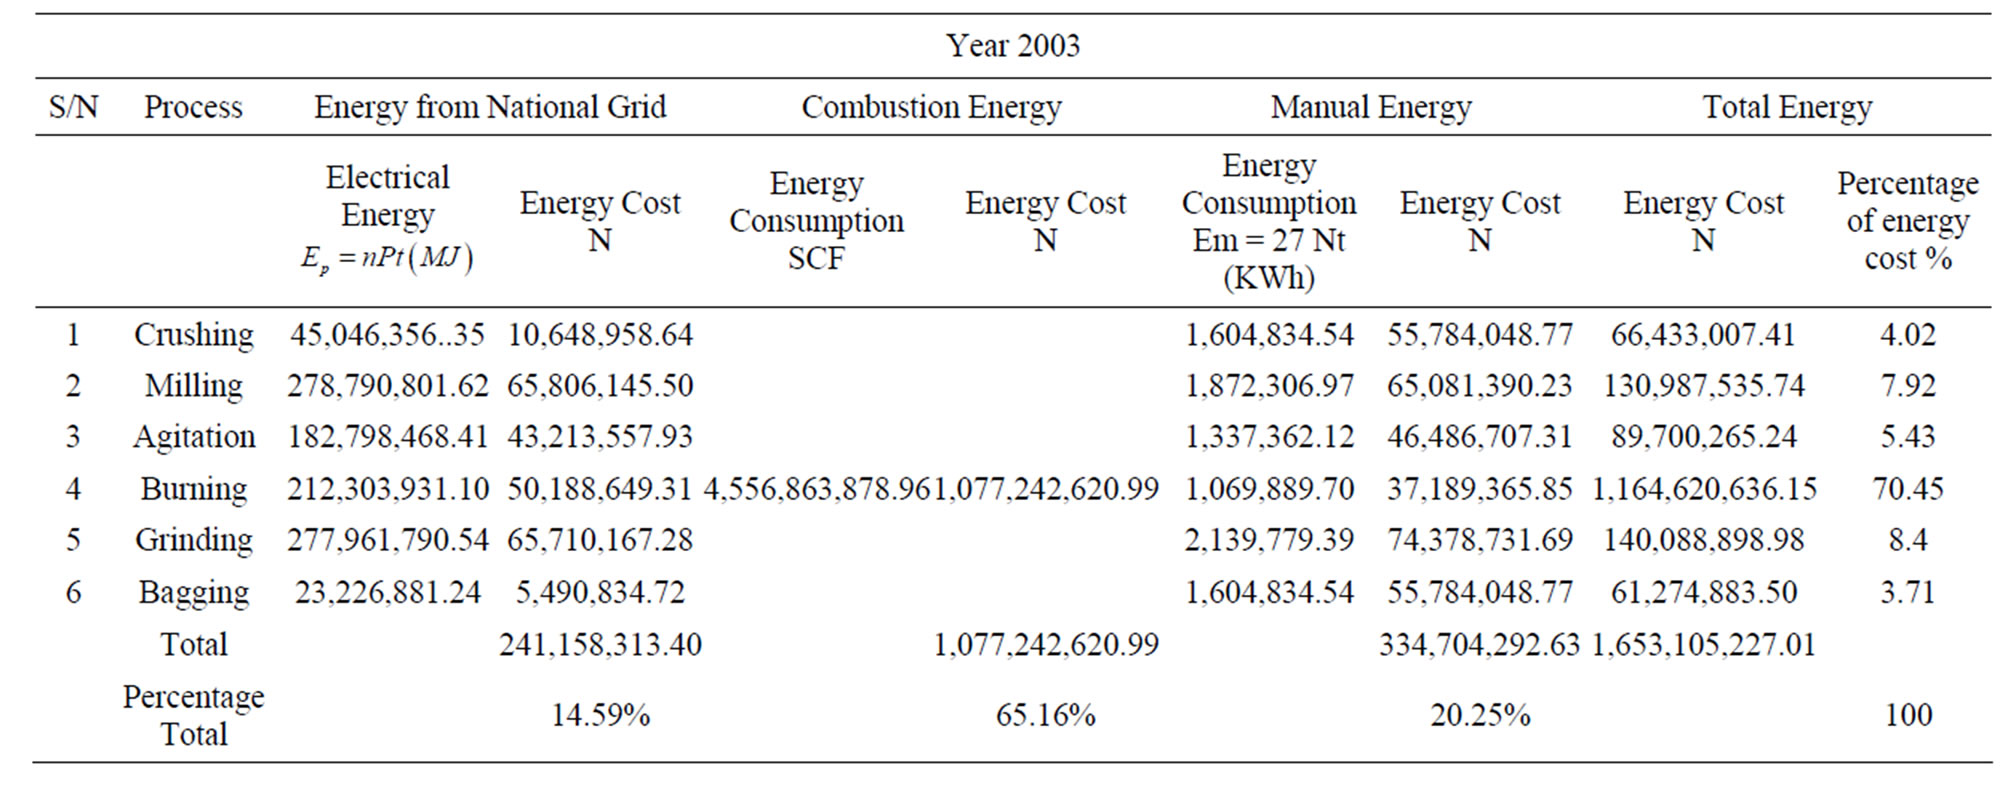
Table 12. Total energy cost using combustion energy, manual energy and electrical energy from gas turbine power plant supply for wet process.
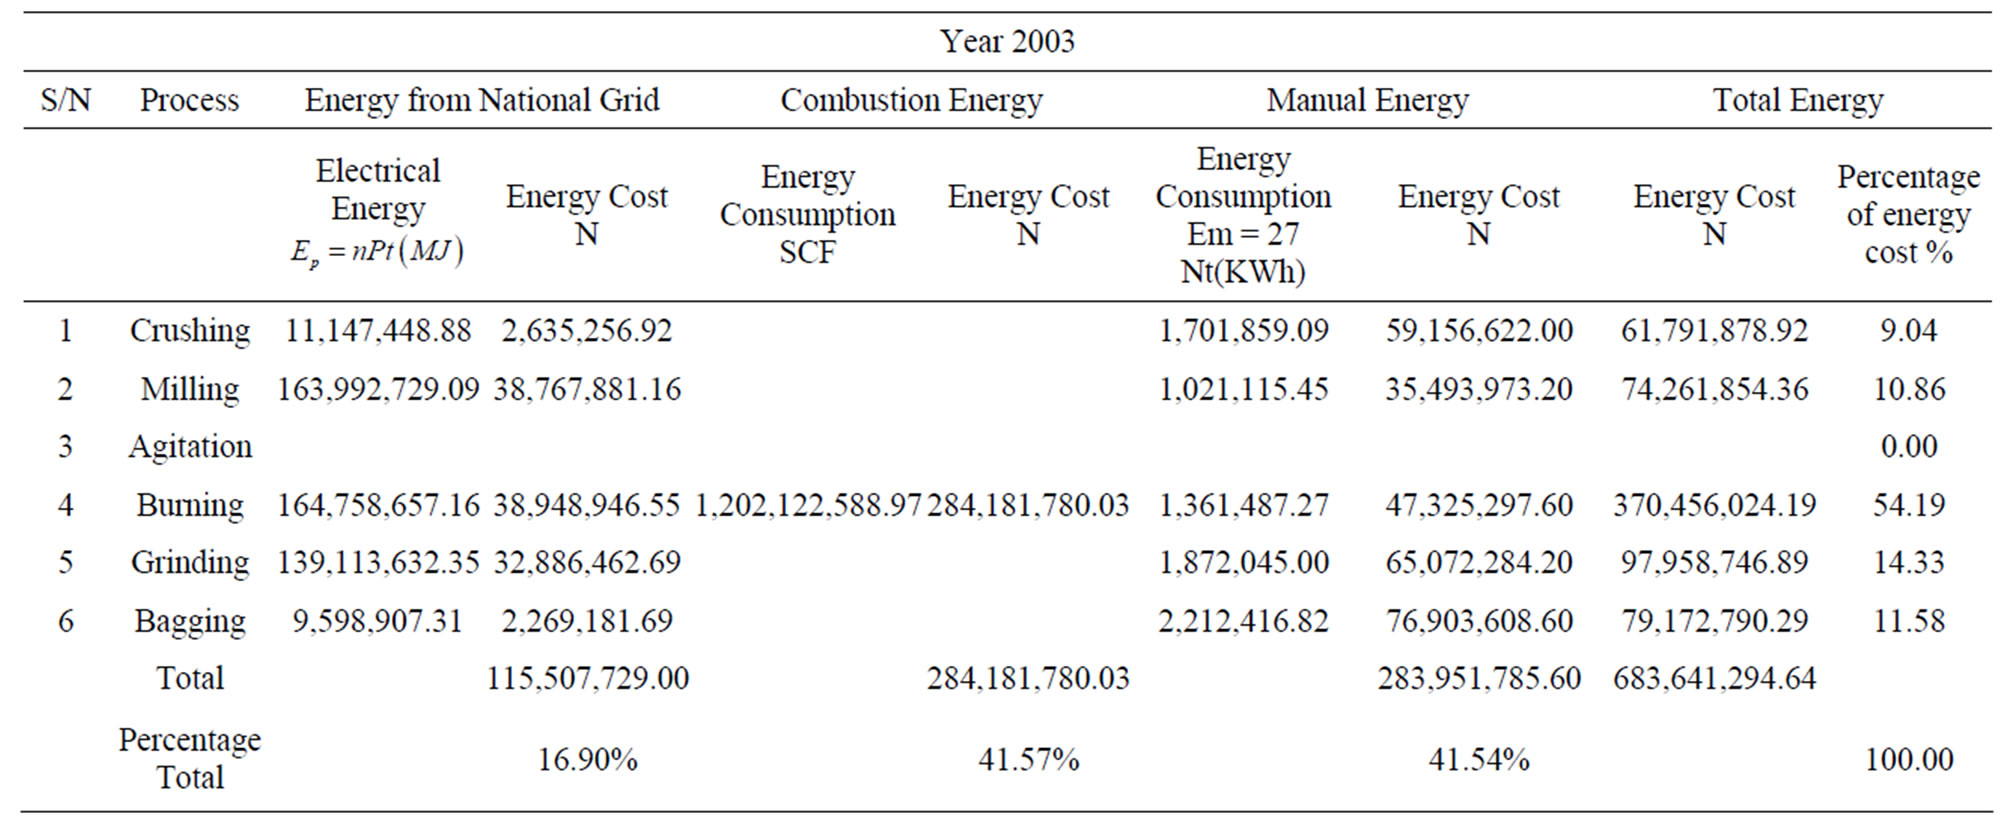
Table 13. Total energy cost using combustion energy, manual energy and electrical energy from gas turbine power plant supply for dry process.
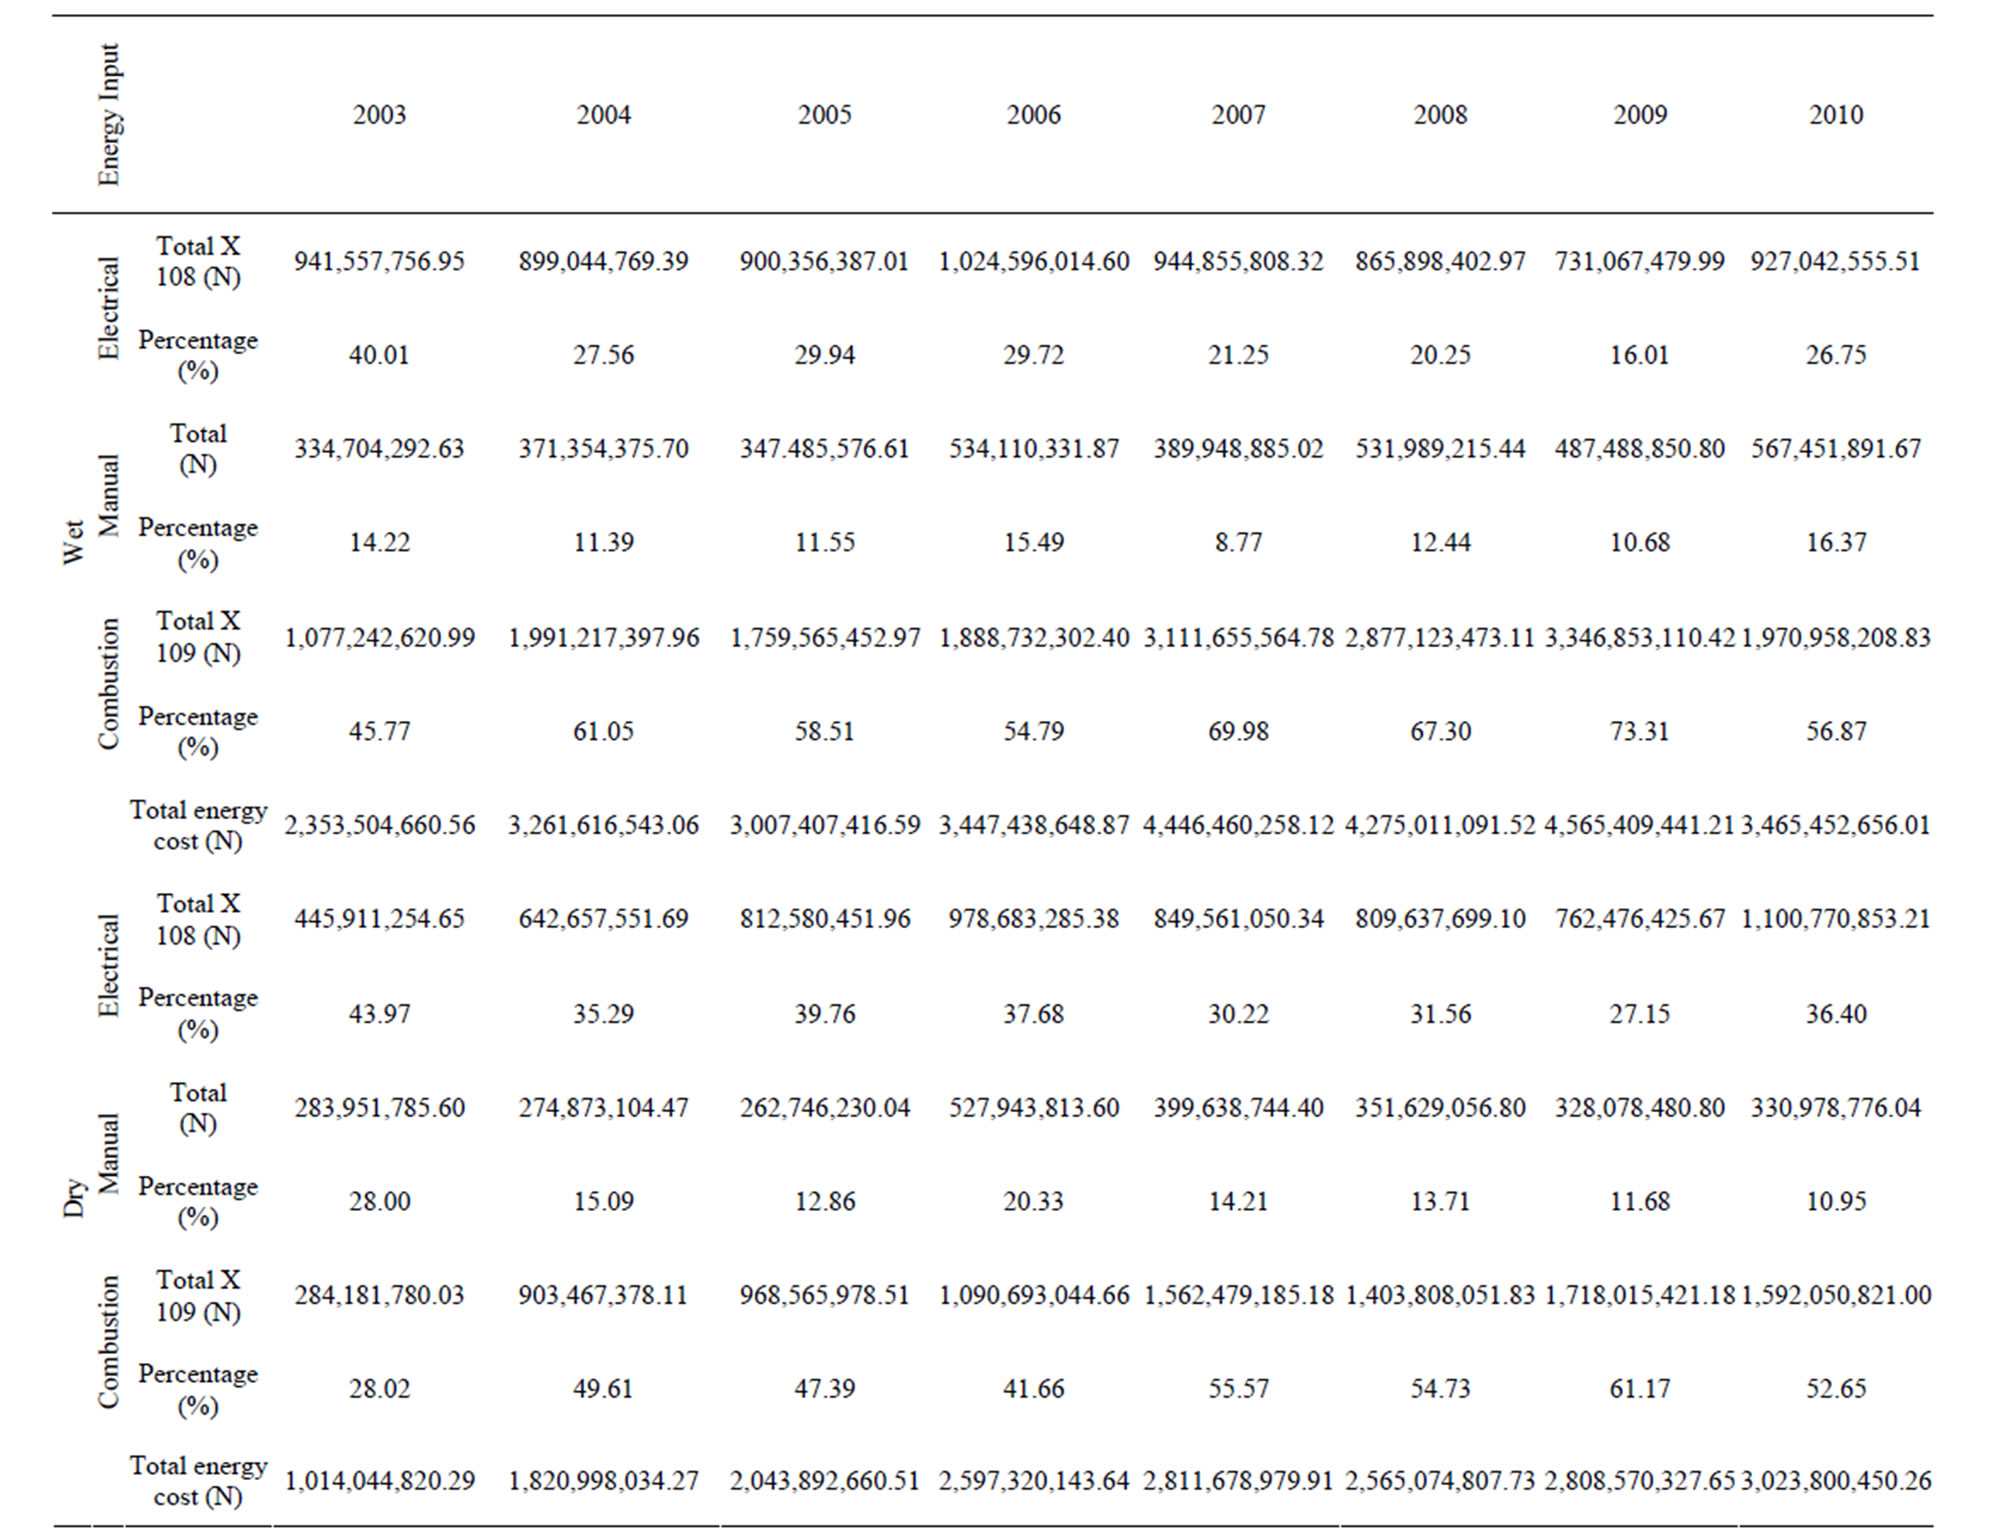
Table 14. Total energy cost using combustion energy, manual energy and electrical energy from National grid supply for wet and dry processes.
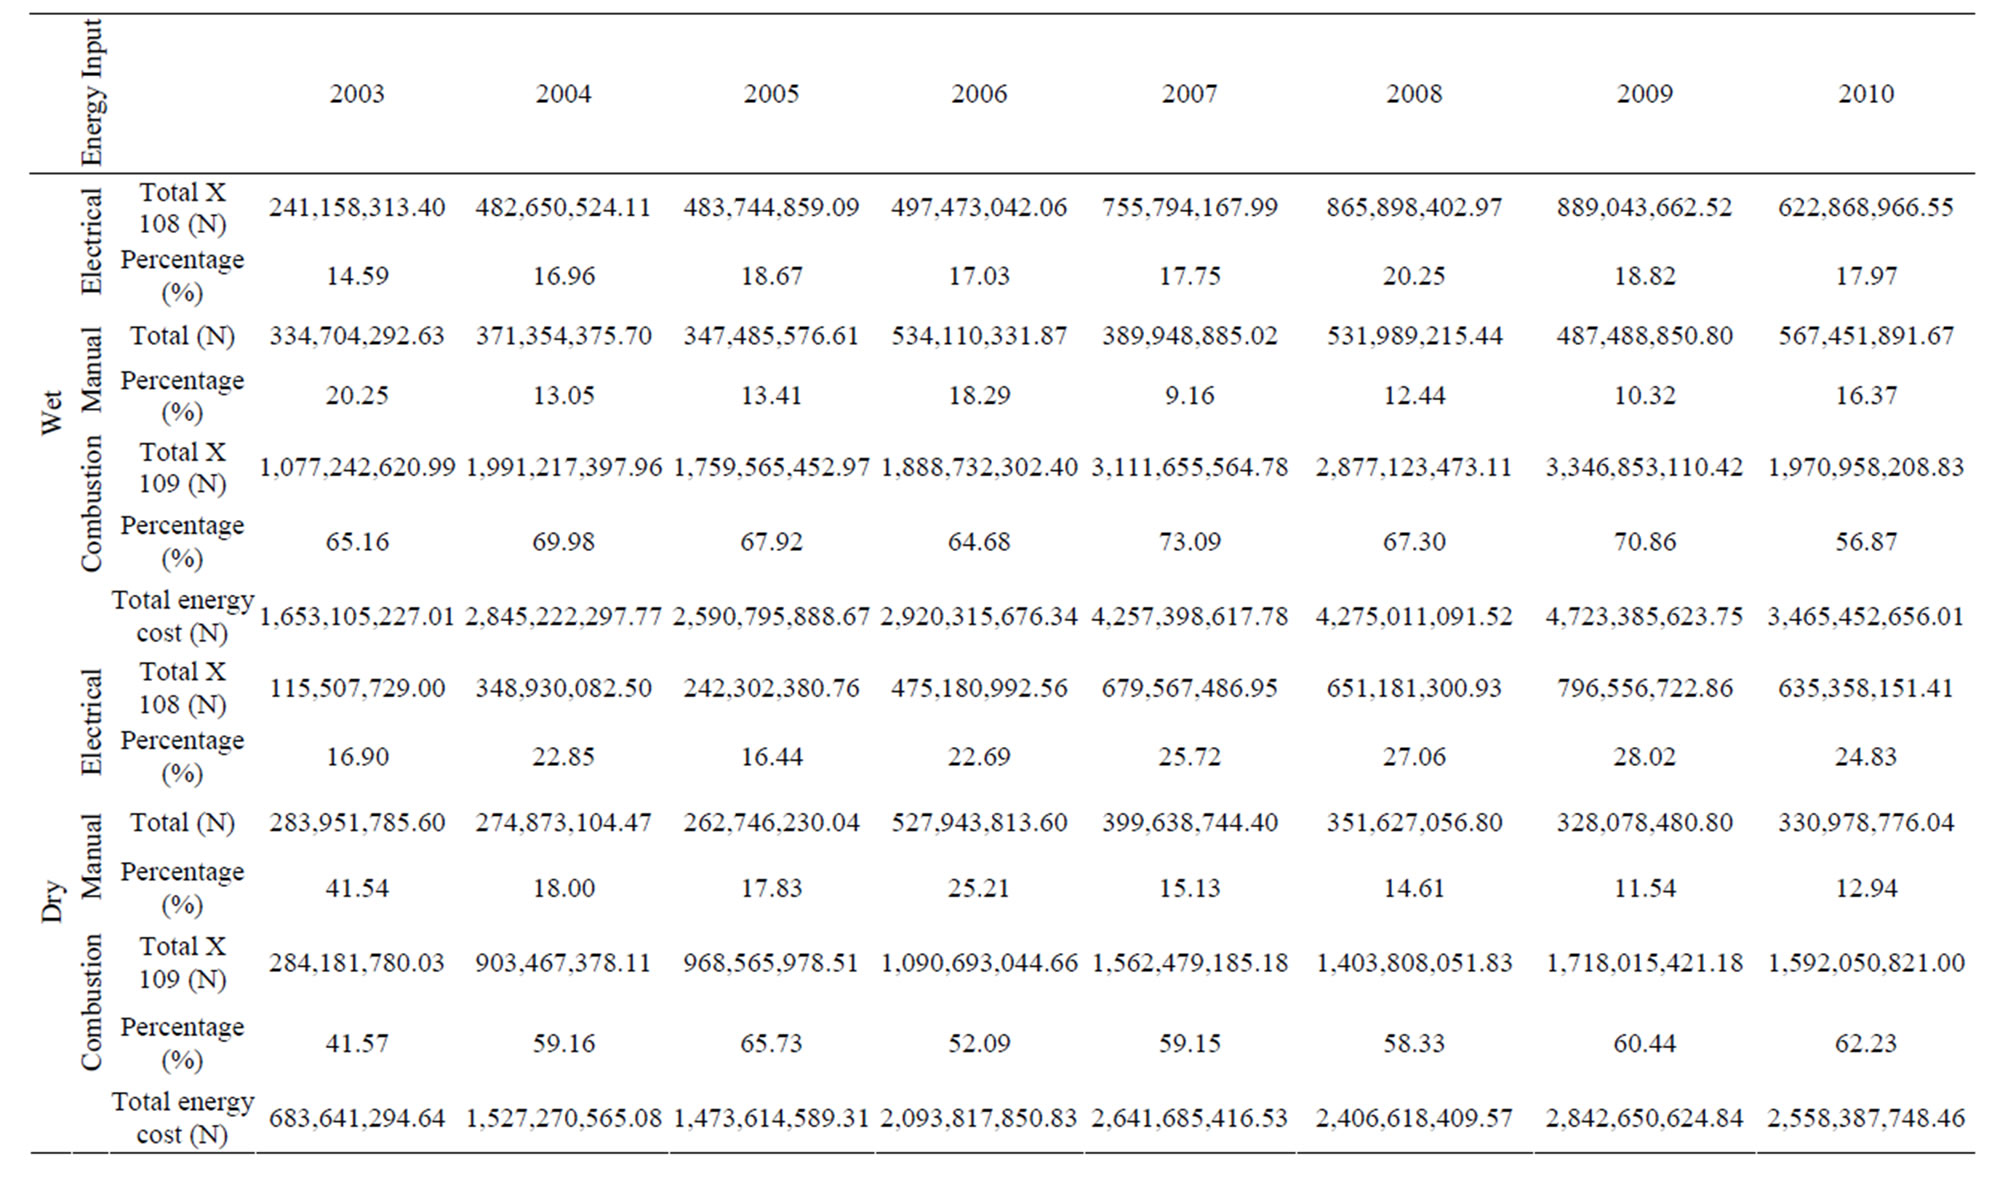
Table 15. Total energy cost using combustion energy, manual energy and electrical energy from gas turbine power plant supply for wet and dry processes.
burning operation had the highest cost in 2009 representing 77.96% while crushing represents 0.74% for 2010 for the wet process. However, using power supply from turbine power plant based on natural gas for the two processes (Table 17), burning operation consumes the largest energy as reflected in the total average cost for the study period with 72 and 69% respectively for the wet and dry processes while the least energy is consumed in bagging (wet) and crushing operation (dry) with 3.3% and 3.2% respectively. Furthermore, on the yearly basis within the study period, burning operation had the highest cost in 2009 with 75.96% while crushing represents 1.16% of the cost computed for 2010 for the wet process; dry process has the highest portion of cost in burning as 72.39% in 2010 while the least cost is given by the crushing operation as 1.69% in 2010.
3.5. Energy Cost Per Tonnage of Cement Produced by the Wet and Dry Process
The average energy cost per tonnage of cement by wet and dry processes for the period of study (2003-2010) is represented in Figures 7 and 8.
Approximate values of ₦5551.72and ₦3174.13 per ton for electrical energy supplied from national grid were computed for wet and dry processes in that order while ₦5,382.46 and ₦2,960 per ton for the electrical energy supplied from gas turbine power plant were calculated for wet and dry processes respectively. The comparative analysis of average cost per tonnage gave reduction in ₦/ton of approximately ₦169.26/ton and ₦214.13/ton for the wet and dry process based on electrical energy from national grid and gas turbine power plant respectively; a resulting change in source price of electrical energy by 55.85% more on the dry process than wet process was obtained.
3.6. Energy Efficiency Options Available in the Industry
Various aspects of the cement manufacturing processes has been found to consume and/or waste energy. Opportunities for either reducing this energy consumption or recycling them where appropriate are being continuously sort out for. The following are considered necessary in optimizing energy consumption in a cement manufacturing process: 1) plant retrofits (process modification and design modification) as included in Table 18) energy efficient best practices in cement manufacturing. Burning operation takes place in the kiln and has been discovered from the study as the most energy intensive operation in this research work.This is followed by grinding, milling, agitation (wet), bagging and crushing respectively; these operations can be targeted for energy consumption reduction with the application of economically viable energy efficient tech-
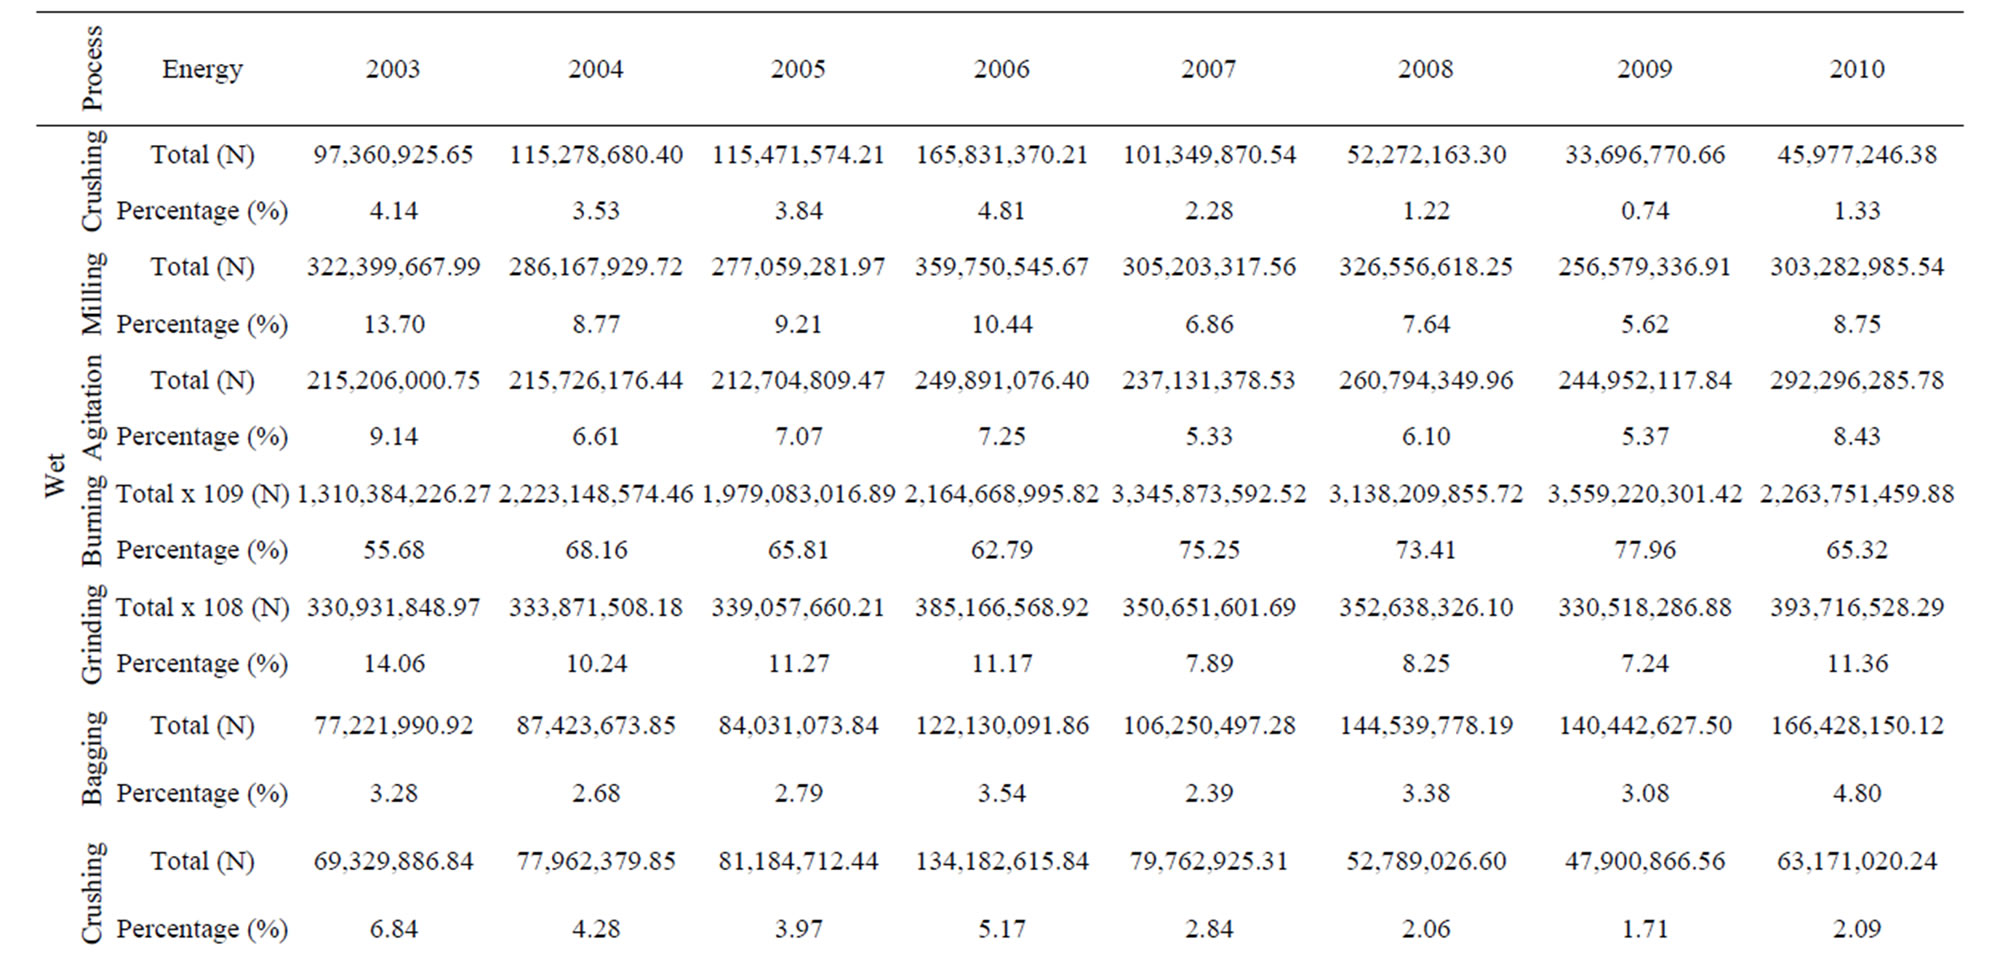

Table 16. Total energy cost using combustion energy, manual energy and electrical energy from National grid supply for wet and dry processes.

Figure 7. Energy cost per tonnage of wet process cement in Naira (₦).
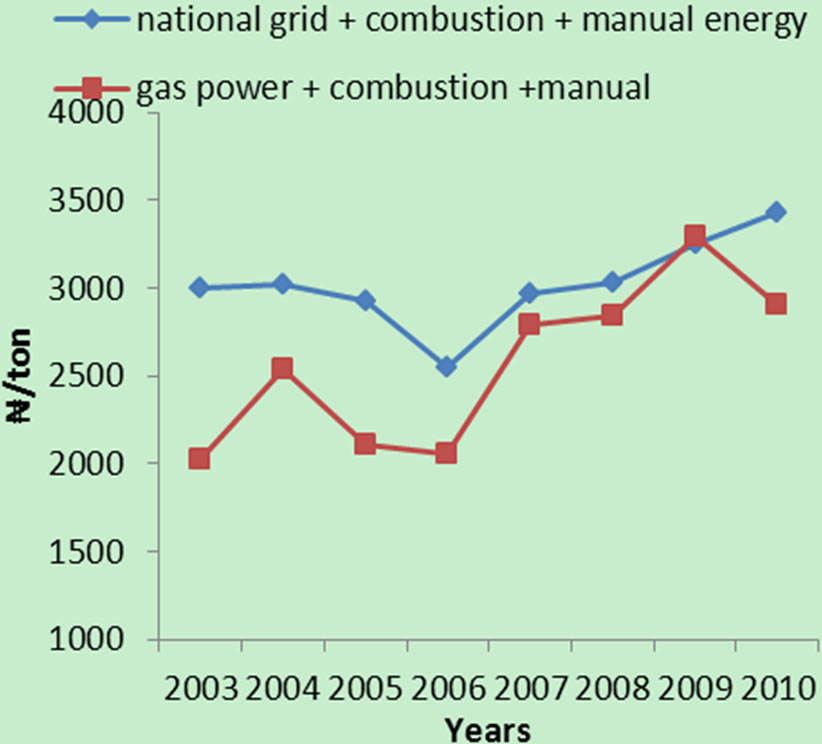
Figure 8. Energy cost per tonnage of dry process cement in Naira (₦).
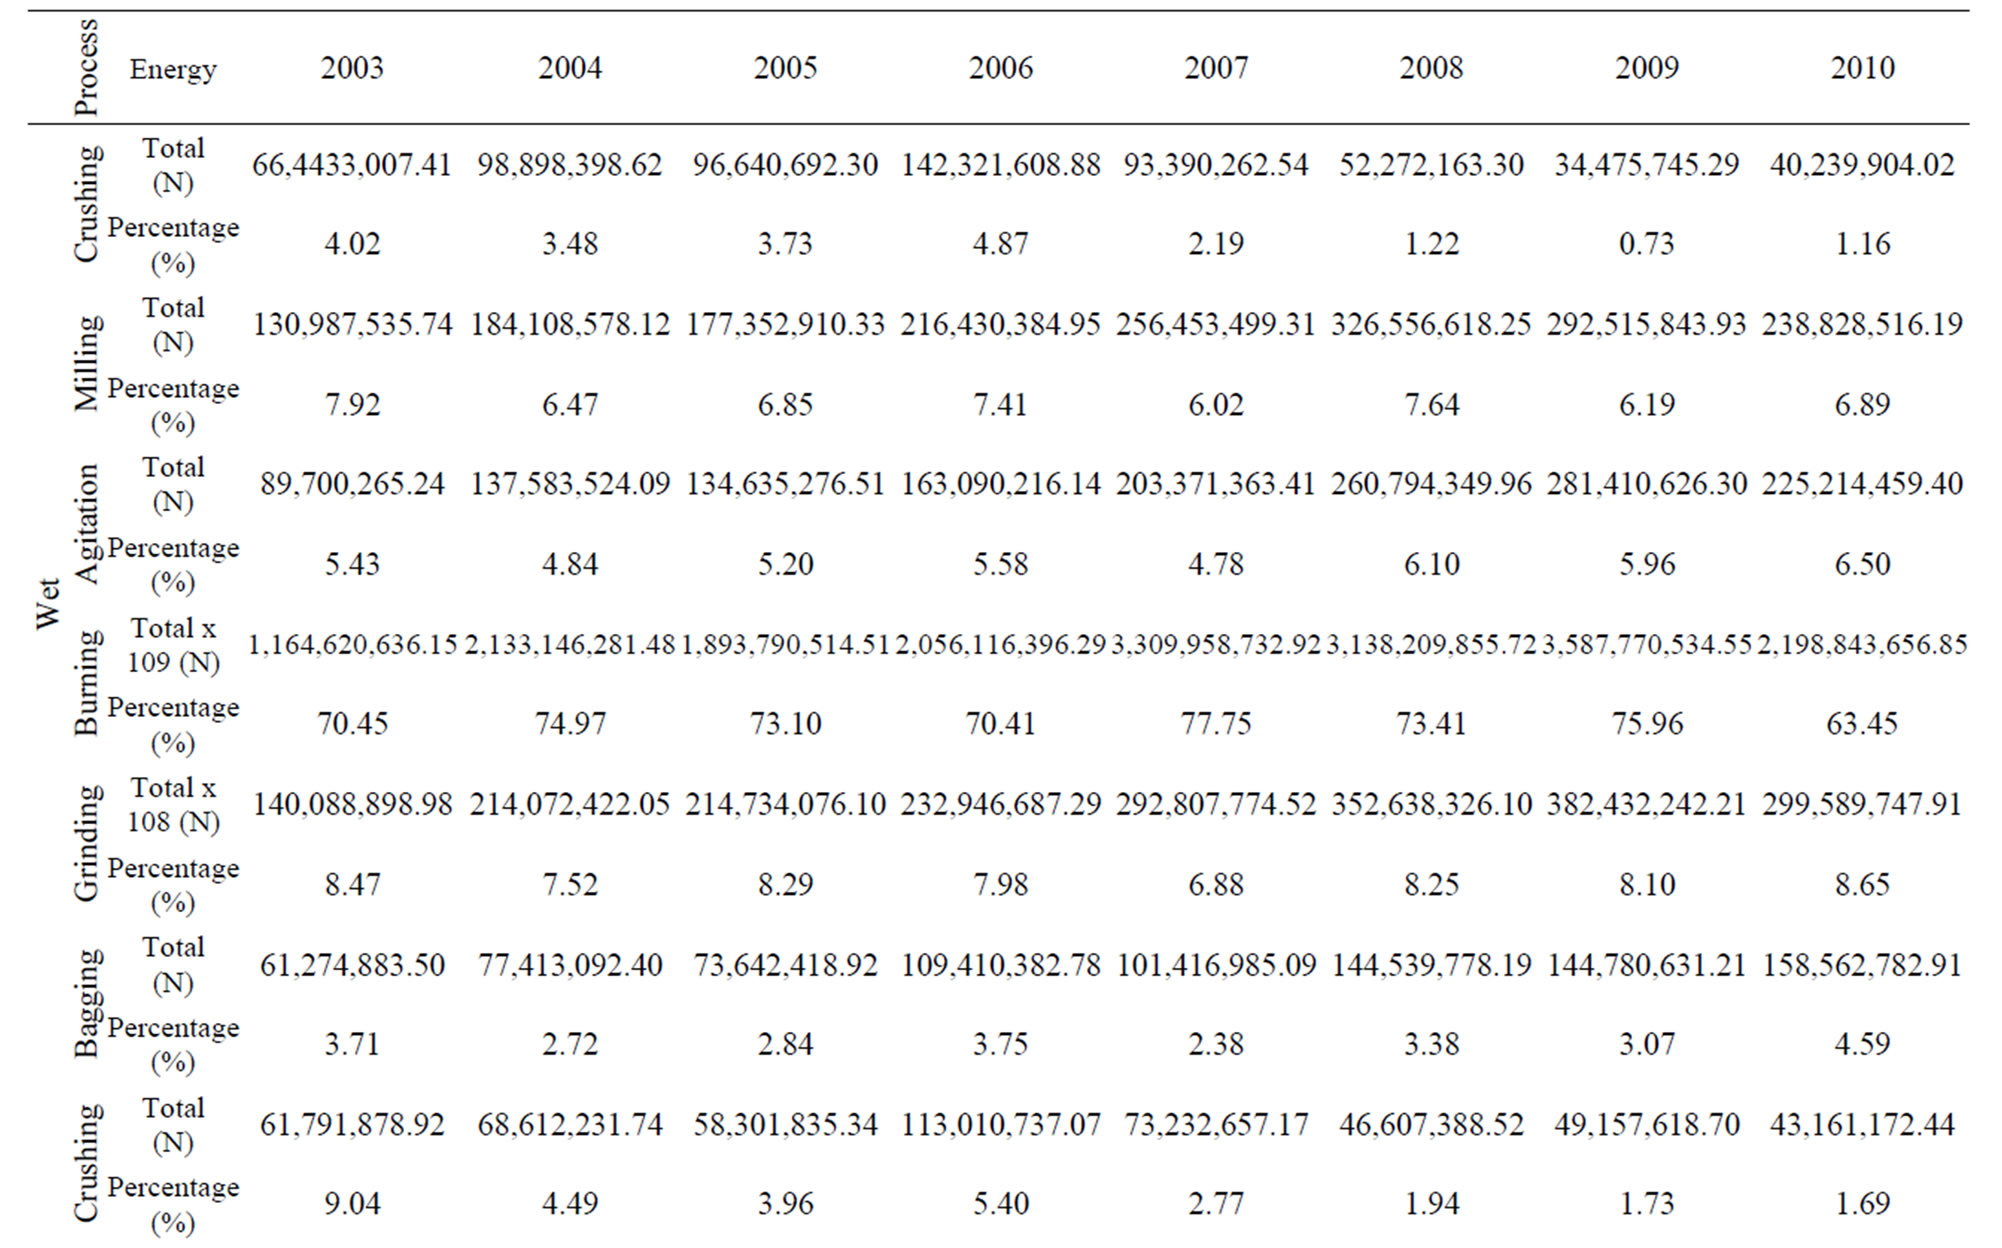
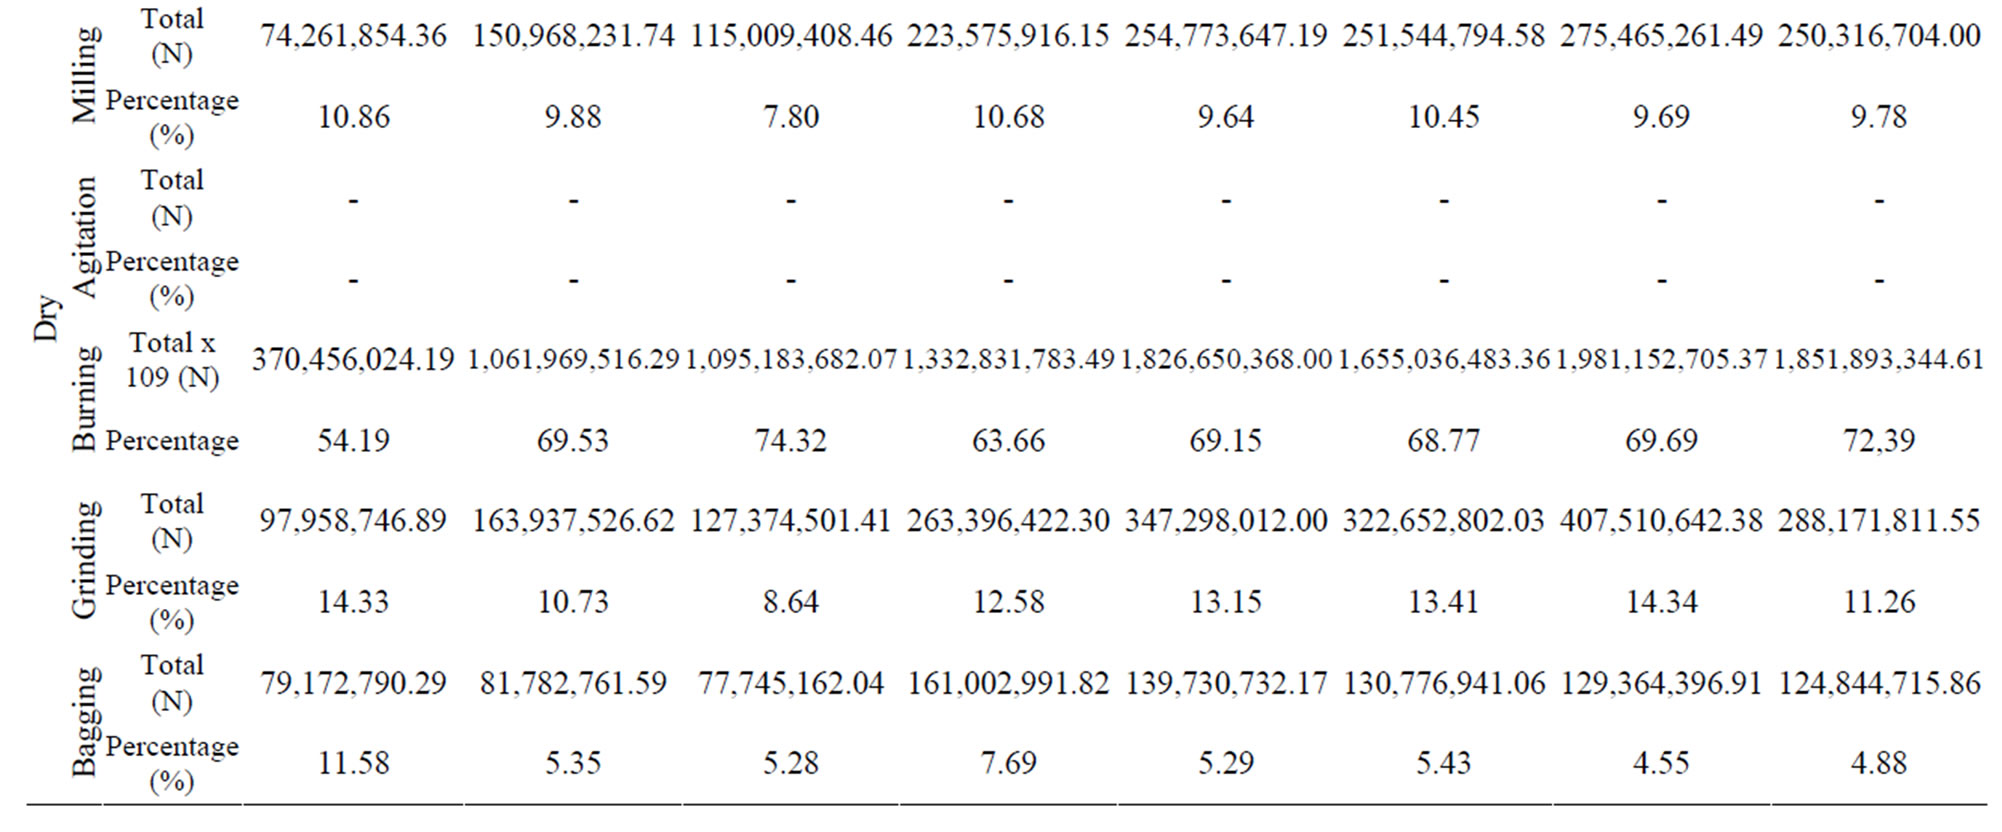
Table 17. Total energy cost using combustion energy, manual energy and electrical energy from gas turbine power plant supply for wet and dry processes.
nologies.
A lot of energy has been observed to be lost in the form of waste heat through the kiln exhaust gas and the air discharged from the clinker cooler stack where the temperature could be as high as 315 and 215˚C respectively [2]. Re-direction of these high temperature gases through a wasteheat recovery steam generator for electricity production has been considered as a means of making the process more efficient. Energy consumption can also be reduced through the addition of pre-calciner to lower the specific fuel consumption and reduce thermal NOx emission. Improvement in the efficiency of electric motors, replacement of all old/obsolete devices together with the use of adjustable speed drives (ASDs) for various electric motors can result into large energy and cost savings. Various other energy efficient best practices adopted to save energy and hence GHG emissions reduction in a cement industry were comprehensively discussed in
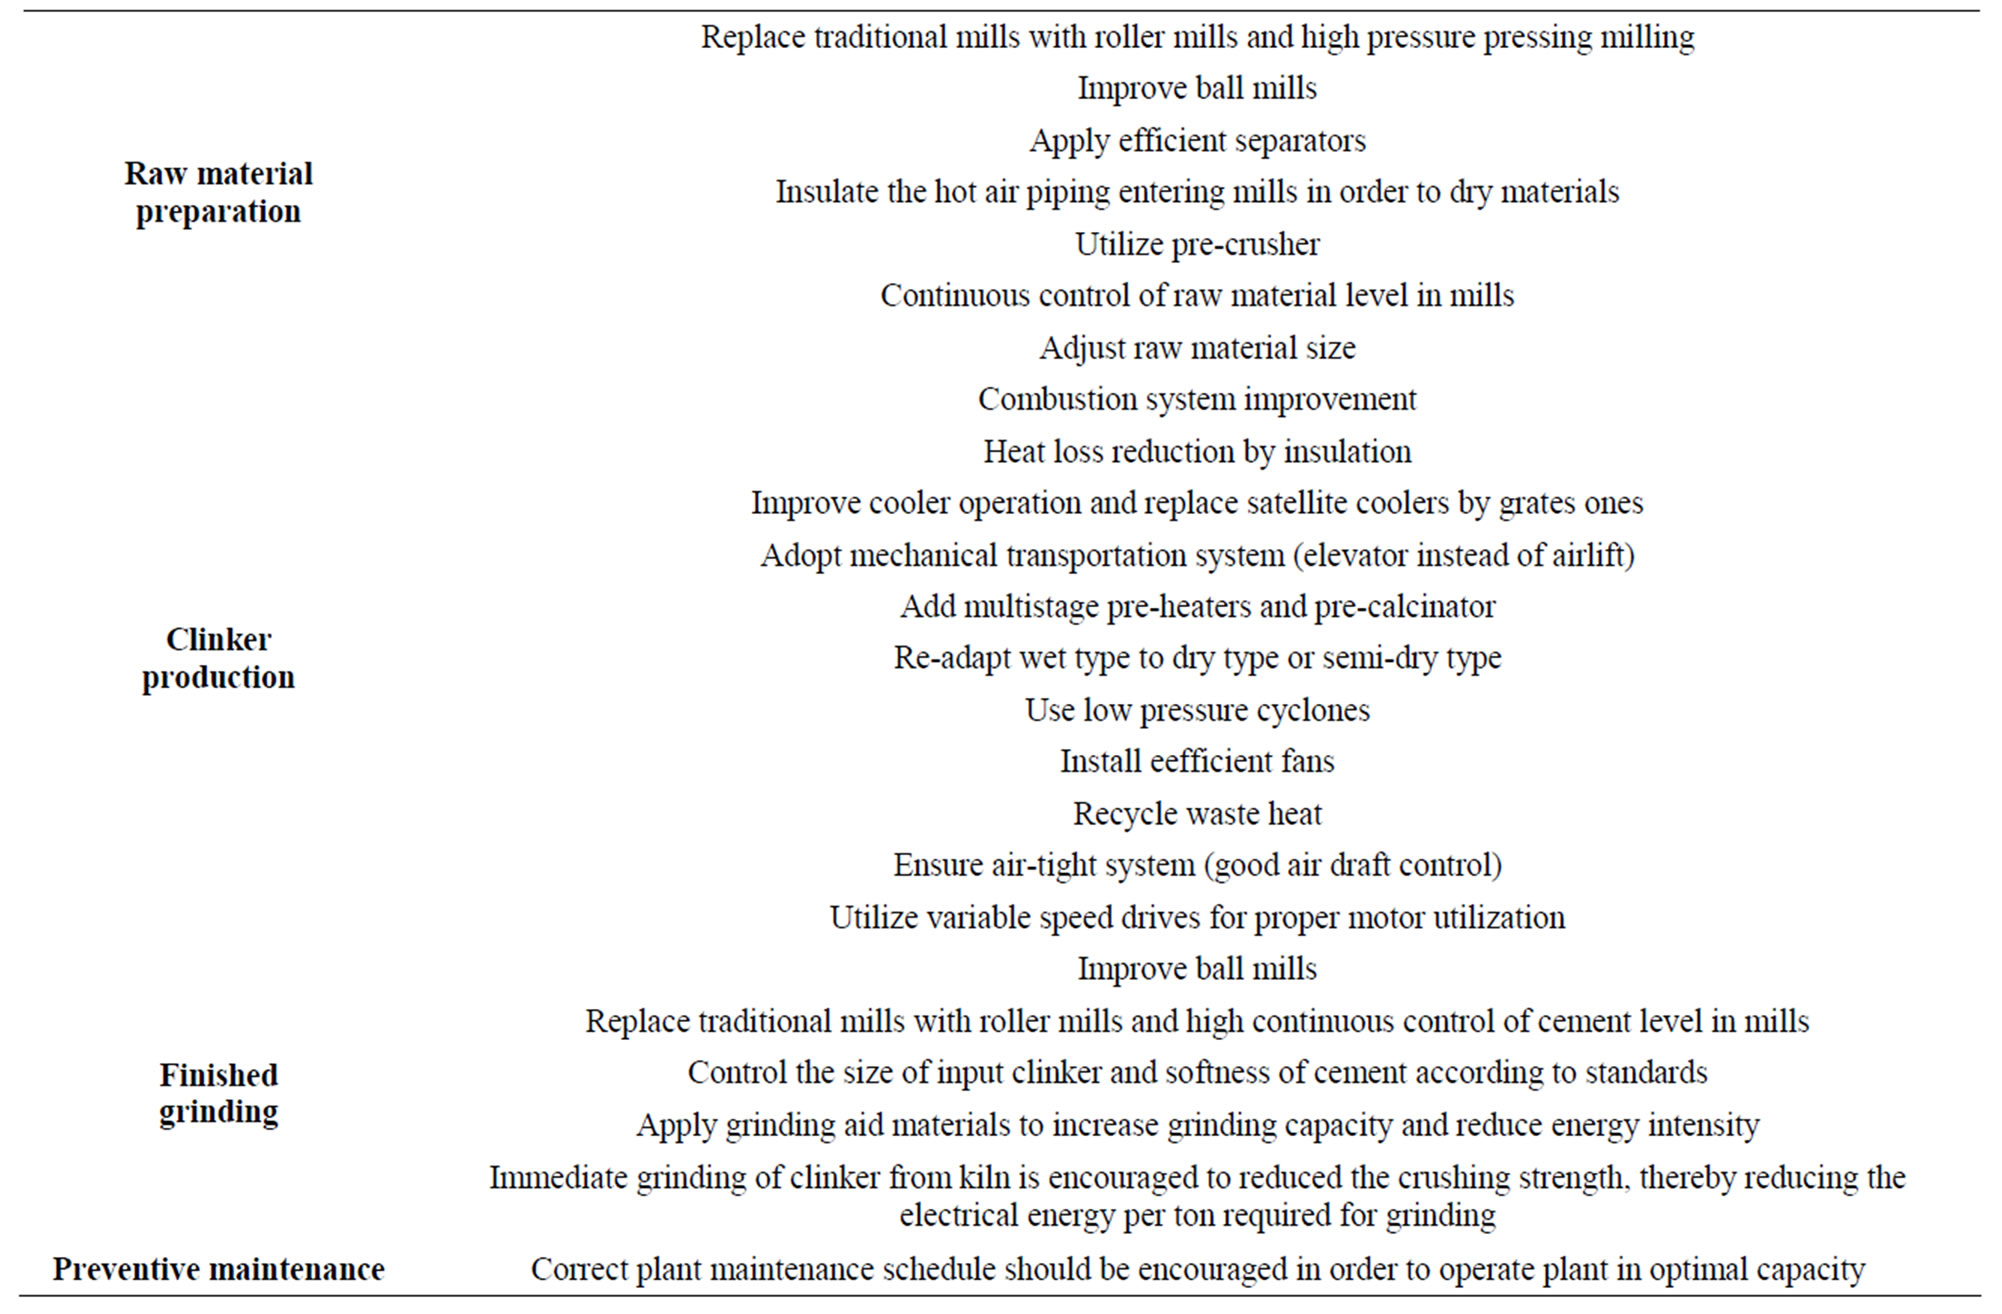
Table 18. Process and design modifications.
[2,13,14].
4. Conclusions
An investigation of the energy consumption for the production of cement by wet and dry processes in Nigeria was carried out. From the study, the following observations were made:
• Combustion, electric and human energy constituted the major portion of the energy input in the production of cement by the wet and dry processes.
• The total estimated energy intensities were 6545 and 4197 MJ/ton for wet and dry process respectively. Furthermore, energy utilization is less intensive for the dry process than the wet cement manufacturing technique.
• The most energy intensive operation of all the operations in cement production was the burning operation consuming about 93% and 90% of the total energy input for the wet and dry processes respectively. Significant amount of heat is wasted in burning. Therefore, improvements can be made in this section to reduce heat loss or recycle heat.
• It has been observed that dry process is more efficient compared to wet process. It has been proved to reduce the energy consumption by 40% than wet process because extra energy is needed in wet techniques to remove moisture contained in wet slurry.
• Wet process plants which are energy inefficient and still available in the country should be replaced or upgraded to reduce its overall energy consumption.
REFERENCES
- T. Engin and V. Ari, “Energy Auditing and Recovery for Dry Type Cement Rotary Kiln Systems—Acase Study,” Energy Conversion and Management, Vol. 46, No. 4, 2005, pp. 551-562. http://dx.doi.org/10.1016/j.enconman.2004.04.007
- N. A. Madlool, R. Saidura, M. S. Hossaina and N. A. Rahim, “A Critical Review on Energy Use and Savings in the Cement Industries,” Renewable and Sustainable Energy Reviews, Vol. 15, No. 4, 2011, pp. 2042-2060. http://dx.doi.org/10.1016/j.rser.2011.01.005
- US Department of Energy, “Energy and Emission Reduction Opportunities for the Cement Industry,” 2012. http://www1.eere.energy.gov/industry/imf/pdfs/eeroci_dec03a.pdf
- http://tribune.com.ng/index.php/news/48440-nigeria-has-not-imported-cement-in-9-months-cman
- A. Avami and S. Sattar,”Energy Conservation Opportunities: Cement Industries in Iran,” International Journal of Energy, Vol. 3, 2007, pp. 101-110.
- M. Schneider, M. Romer, M. Tschudin and H. Bolio, “Sustainable Cement Production—Present and Future,” Cement and Concrete Research, Vol. 41, No. 7, 2011, pp. 642-650. http://dx.doi.org/10.1016/j.cemconres.2011.03.019
- M. G. Rasul, W. Widianto and B. Mohanty, “Asessment of Thermal Performance and Energy Conservation Opportunities of a Cement Industry in Indonesia,” Applied Thermal Engineering, Vol. 25, No. 17-18, 2005, pp. 2950-2965. http://dx.doi.org/10.1016/j.applthermaleng.2005.03.003
- D. A. Fadare, O. A. Bamiro and A. O. Oni, “Energy and Cost Analysis of Organic Fertilizer Production in Nigeria,” Energy, Vol. 35, 2010, pp. 332-340. http://dx.doi.org/10.1016/j.energy.2009.09.030
- G. O. Unachukwu, “Energy Efficiency Measures Investigation in Cement Company: BCC Case Study,” Nigerian Journal of Renewable Energy, Vol. 10, No. 1-2, 2003, pp. 85-92.
- http://www.proshareng.com/news/download.php?Item=2619.pdf
- http://www.nigerianbestforum.com/blog/?p=59984
- E. U. Odigboh, “Machines for Crop Production,” In: B. A. Stout and B. Cheze, Eds., CIGR Handbook of Agricultural Engineering Plant Production, American Society of Agricultural Engineers, 1997, pp. 1-21.
- E. Worrell and C. Galitsky, “Energy Efficiency Improvement and Cost Saving Opportunities for Cement Making,” Ernest Orlando Lawrence Berkeley National Laboratory, 2008.
- E. Worrell, N. Martin and L. Price, “Potentials for Energy Efficiency Improvement in the US Cement Industry,” Energy, Vol. 25, 2000, pp. 1189-1214. http://dx.doi.org/10.1016/S0360-5442(00)00042-6