Energy and Power Engineering
Vol.5 No.2(2013), Article ID:29416,13 pages DOI:10.4236/epe.2013.52014
Promoting Alternative Energy Programs in Developed Countries: A Review
1SEC Chair in Power System Reliability and Security, Electrical Engineering Department, King Saud University, Riyadh, KSA
2Ministry of Water and Electricity, Riyadh, KSA
Email: yasir@ksu.edu.sa
Received December 11, 2012; revised January 15, 2013; accepted January 28, 2013
Keywords: Renewable Energy; Resource Management; Environment; Cost Assessment
ABSTRACT
This paper presents a review of the promoting programs of solar and wind energies in different countries including Germany, Austria, France, Spain, Great Britain, Italy, Japan, USA, Australia, China and India with an emphasis on Germany as a notable example. The success of each program is discussed in detail. The results of the investigation conducted in the paper have shown that some renewable energy laws have proven to be extremely successful. Among such laws, is the Renewable Energy Act (EEG) in Germany, which guaranteed 20 years of stable prices for green power and has already brought many homeowners and businesses to install photovoltaic modules and to feed their electricity into the national grid. By the year 2010, the clean production of electricity by renewable energies in Germany has risen to around 202,000 GWh. In addition, about 70 million tons of CO2 emissions in 2009 were avoided through the use of renewable energies in electricity generation in Germany.
1. Introduction
The continuous dependence of many countries on energy imports, growing demand and consequent price increases and climate change and environmental pollution through the use of fossil fuel have increased dramatically. This, along with other factor such as finite sources of energy sources, has led many countries towards development of alternative energies that are effective and environmental friendly by promoting new green technologies through policies and international agreements.
This paper presents promoting programs of solar and wind energies in different countries including Germany, Austria, France, Spain, Great Britain, Italy, Japan, USA, Australia, China and India with an emphasis on Germany as a notable example. The success of each program will be discussed in detail.
2. Introduced Support Programs for Renewable Energies Worldwide
2.1. Germany
To promote the development and use of renewable energies, many supporting programs have been introduced in Germany since 1990 (see Table 1). The most important and successful ones are Renewable Energy Act (EEG) in 2000 and its predecessor, the Law on Electricity Feeding into the Grid for Renewable Energy (StrEG) and the Renewable Energy Heat Act (EEWärmeG).
2.1.1. Law on Feeding Electricity to the Grid (StrEG)
The StrEG was decided in December 1990 and since 1991 it has been the governing law on the dispatch of electricity from renewable energy sources in the network grid. The conditions of supply and payment of electricity from renewable energy sources are regulated at a national level. It obliges grid operators to accept and transfer all the offered power produced by renewable energy plants. The renewable energy owners are assured average price of electricity coupled with remuneration.
This Law on Feeding Electricity into the Grid was replaced on April 1, 2000 by Renewable Energies Act (EEG).
2.1.2. Renewable Energies Act (EEG)
The Law on Feeding Electricity into the Grid (StrEG) was replaced by the Renewable Energy Act (EEG) in 2000. It regulates the purchase of electricity produced from renewable energy sources by power suppliers or network operators and determines the remuneration of renewable energy plant operators (owners). Anyone who generates electricity and heat from renewable energy sources in Germany and feeds it into the grid has the right to receive incentive by the Renewable Energies Act (EEG). This
Table 1. German support programs for renewable energies [1].

Act supports many homeowners, investors and enterprises to install photovoltaic modules and wind turbines and to feed electrical energy into the national power grid.
The owners obtain up to 20 years long a guaranteed fixed payment for their generated power in which the payment depends on the renewable energy sector, size and type of facilities, the amount of generated power, the year of commissioning and location. Based on EEG Act the renewable energy can be produced from hydropower, wind power, solar radiation energy (photovoltaic and solar power plants), geothermal, landfill gas, sewage gas, biomass and methane gas.
The EEG Act was revised, expanded and updated in 2004 and 2009 including modifications of the amount of remuneration. This is justified by the ever decreasing cost and improving the efficiency of solar systems. Further modifications are planned for the year 2012.
After Fukushim crises an energy revolution occurred in Germany with new expected energy laws. Germany plans to close all the 19 nuclear power plants by 2021 in stages. The first power plant was already shut down in two years and the last nuclear power plant will be stopped around 2021.
2.1.3. Advantages of the EEG Act
The EEG has brought many benefits. It is applied to both companies and citizen participants. Every citizen can now supply electricity from renewable energy sources to the grid. Participants are assured of their investments through power purchase guarantee, non-discriminatory network access and equity costs through customized fixed feed-in tariffs for different renewable energy technologies. The payments of renewable energy are recovered by additional costs allocated to all consumers per pay-asyou-go financing.
2.1.4. Renewable Energy Heat Act (EEWärmeG)
The Renewable Energy Heat Act (EEWärmeG) has been introduced to complement the Renewable Energies Act (EEG) and encourage the continued development of renewable energy for heating and cooling energy in buildings. It was first applied in January 2009 and has obliged owners of new buildings to cover their buildings energy needs in proportion with renewable energy. This may include geothermal, solar thermal or biomass.
Alternatively, similar climate friendly measures have also been implemented such as increased insulation, heat from combined heat and power or waste heat [2]. The obligation applies to the use of heat and cooling for both new and old buildings under certain conditions for up to December 31, 2014.
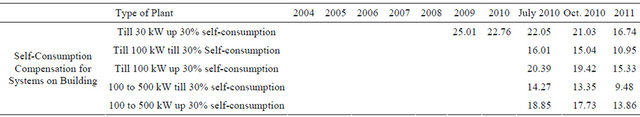
2.1.5. Feed-in-Tariff for Photovoltaic
The current feed-in-tariff in the respective years is shown in Tables 2 and 3. The compensation depends on system type, rated power, and year of commissioning and remains constant for 20 years. As shown in Table 2, the feed-in-tariff is gradually reduced as the rated power is increased. For example, for a 40 kW system commissioned in 2009, the first 30 kW is compensated at 43.01 cents/kWh while the remaining 10 kW is paid at rate of 40.9 cents/kWh. The contract lasts until 2029.
The feed-in-tariff has been reduced from year to year. 5% reduction was applied for the years 2004 to 2008. The reduction was increased to 8% and 9% in 2009 and 2010 respectively. Further reduction of 13% and 3% were added on 01/07/2010 and also on 01/10/2010 respectively.
The payment per kilowatt-hour injected from photovoltaic systems to the grid is higher than the price that a consumer pays to the power operator for its electricity consumption. So, the system operator pays consumers incentives for their own use of their photovoltaic generated power as shown in Table 3.
The total installed new PV power generation capacity has grown steadily in Germany in 2010 and has reached 17,000 MW. The energy supply has surpassed 12,000 GWh in 2010 (see Figure 1). This growth of photovolTable 2. Electricity feed-in tariff for photovoltaic systems [3].

Table 3. Current price for owners of photovoltaic systems [3].
taics has been created not only by the secured feed-intariffs, but also by the minimum generated PV electricity required from new buildings in several communities. With this cumulative installed capacity, Germany is the world’s largest producer of PV electricity.
2.1.6. Feed-in-Tariff for Wind Energy
The promotion of renewable energies such as wind energy is also regulated by the Renewable Energies Act (EEG).
2.1.6.1. Feed-in-Tariff for Offshore Plants The total wind turbines installed in Germany in 2010 reached an output of approximately 27,000 MW (see Figure 2) of which one sixth is provided by the onshore facilities while the remaining is by offshores. Both types produce about 42,000 GWh. The relatively large number of installed MW is due to the government support.
Owners of offshore wind plants receive an initial feedin-tariff of 13 cents/kWh at least 12 years until 2014 after which it decreases by 5% annually until 2015 (see Table 4).
The EEG based promotion is applied after the period of 12 years by which the wind plants receive 3.5 cents/ kWh till 2014. After 2015, the controlled subsidy rates for electricity from offshore wind turbines also decreases during the entire duration of the remuneration by about 5% on a per year basis.
2.1.6.2. Feed-in-Tariff for Onshore Plants The StrEG was introduced in January 1991 giving a rapid compensation to onshore wind power facilities for their produced power at initial rate of 8.49 cents/kWh.
After replacing the StrEG in 2000 with the Renewable Energies Act (EEG), the initial rate was increased to 9.2 cents/kWh. From 2009, the incentive was based on a regression of 1% per year as shown in Table 5.
In the early years, depending on the efficiency of the wind turbine, an initial rate of 9.2 cents/kWh is paid for a minimum of 5 years. Following this period, the rate is lowered to start from 4.92 cents per kWh where the promotion extends over 20 years.
2.1.7. Market Incentive Program to Promote Renewable Energies
The “market incentive program” is used, among other programs, to promote the solar technology on existing buildings in the following different application areas:
• Space heating;
• Combined water heating and space heating;
• Provide process heat;
• Solar cooling;
• Solar collector systems, which supply the heat predominantly a thermal power network.
This program is funded by the environmental tax levied by the Green Party on gasoline and electricity. For the installation of solar collectors to an area of 40 m2 for hot water, the promotion of BAFA (Federal Office of Economics and Export Control) is EUR60 per m2, but not less than EUR410 [6]. Solar collectors for combined water and space heating, supply process heat or solar cooling are encouraged by a fund of EUR105 per gross collector area of 40 m2 [6]. It is possible to get further support measures, such as low-interest loans, from banks and grants from German states [7].
New support regulations for the market incentive program were introduced on March 15th, 2011. The basic subsidy for solar collectors for combined water and space heating increases to EUR120 on 30 December 2011, then it was reduced to 90 EUR/m2 [8].

Figure 1. Evolution of electricity generation and installed capacity of photovoltaic systems in Germany [4].

Figure 2. Installed capacity and development of electricity generation from wind turbines in Germany [4].
Table 4. EEG promotion rates for wind turbines (onshore) in Germany [5].

Table 5. EEG promotion rates for wind turbines (onshore) in Germany [5].

The bonus for replacing old boiler (without condensing technology) with new condensing boiler is now set at 600 Euros (previously EUR400) until 30 December 2011, after which it becomes 500 Euros [8].
The combine bonus for solar thermal plus heat pump or solar thermal plus biomass amounts was increased from EUR500 to EUR600 until 30th of December 2011 [9], then, it went back to EUR500. In addition to the basic subsidy granted by BAFA (Federal Office of Economics and Export Control), different special bonuses, some of which are cumulative, have also been incorporated [9].
The installed collector area has reached 15,000,000 m2 in 2011 (Figure 3). This area was heated by over than 5.6 GWh.
2.1.7.1. Tax Benefits Large-scale commercial solar systems are exempted from the Value Added Tax (VAT). They also can be depreciated over a period of 20 years [10].
2.1.7.2. Low Interest Rates on Loans Various loan programs for private and commercial investors offer favorable interest rates and repayment periods over several years.
2.1.8. Results and Achievements of Incentive Programs in Germany
2.1.8.1. Clean Energy The Renewable Energies Act (EEG) together with its predecessor, the Electricity Feed (StrEG), has initiated a clean power supply. The EEG has resulted in share increase of renewable energies in gross electricity consumption from 6.4% in 2000 to 16.8% in 2010, more than doubling in just ten years period [11].
Table 6 and Figure 4 [12,13] show the development of electricity supply from renewable sources from 1990 to 2010. The fixed target for 2020 is to reach 30% renewable penetration.
Germany enjoys a mix of various fossil energy sources. The renewable energy accounted for nearly 17% in 2010 while the nuclear power represented nearly 22 percent of the energy mix. The planning of the abolition of nuclear power plants in Germany over the next few years would increase the use of renewable energies.
2.1.8.2. Benefits of EEG is Higher than Cost The added generation of electricity from renewable energy sources increases the available supply in the electricity market. This has caused the price of electricity on

Figure 3. Development of collector and heat from solar thermal plants in Germany [4].
Table 6. Percentage of renewable energies in electric generation in Germany [14].
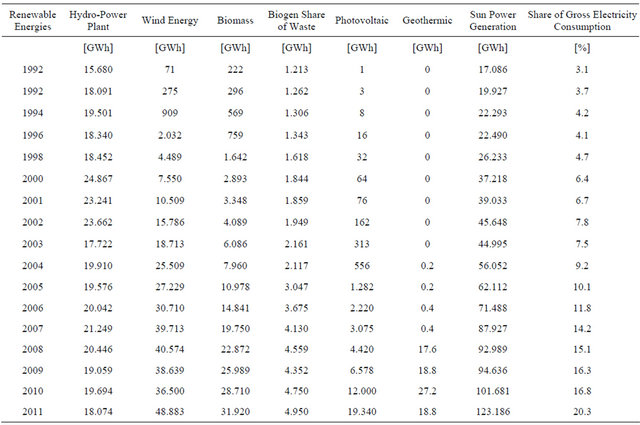

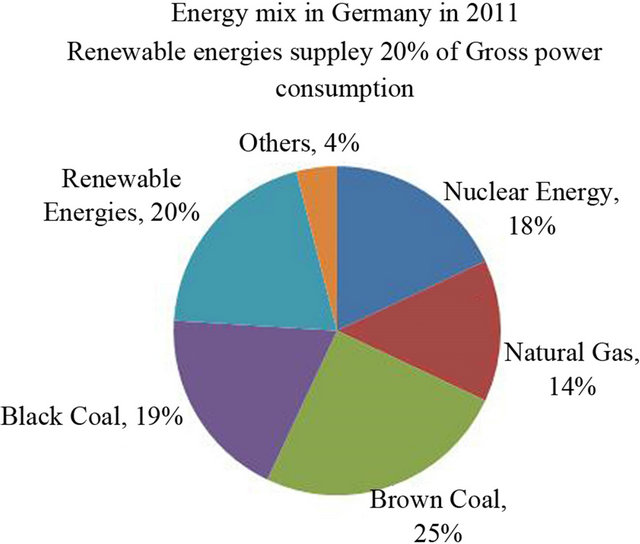
Figure 4. Energy mix in Germany in 2010 and 2011 [12,13].
the wholesale market to fall significantly due to price damping effect (“merit-order effect”). In 2006, this effect led to cost savings of around five billion Euros (Figure 5).
In addition, 3.4 billion euros of fuel imports, environmental and climate damage cast was avoided. So, the additional costs of EEG levy of about 3.2 billion euros were recovered from the overall economic savings of more than nine billion Euros.
2.1.8.3. EEG Provides Investment Incentives The fact that the electricity production has doubled from renewable energies in Germany within a few years is due to the Renewable Energy Act (EEG) and the previous law on feeding electricity into the grid (StrEG). This is a must requirement of investment especially for small and medium-sized enterprises to be able to build production capacities and energy systems. The result was a total saving of more than six billion Euros in 2006.
The share of renewable energy in the electricity mix in 2007 surpassed the target of 12.5 percent, originally intended only for 2010, because the guaranteed feed-intariff subsidy rates provided an incentive for the fulfil-
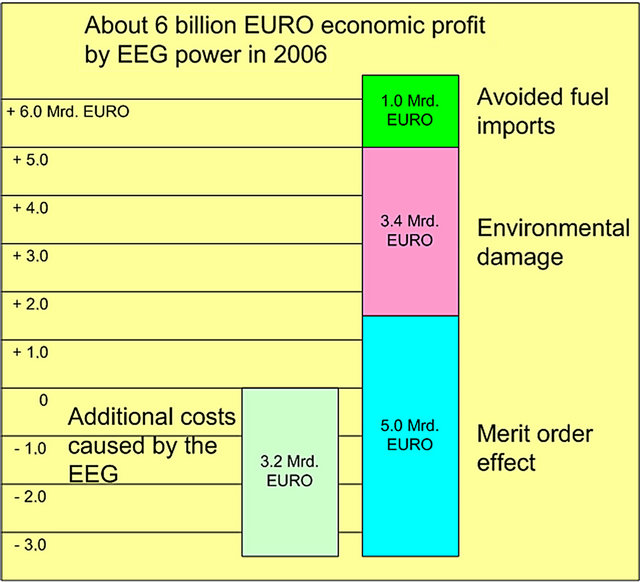
Figure 5. Profit from the EEG power in 2006 [15].
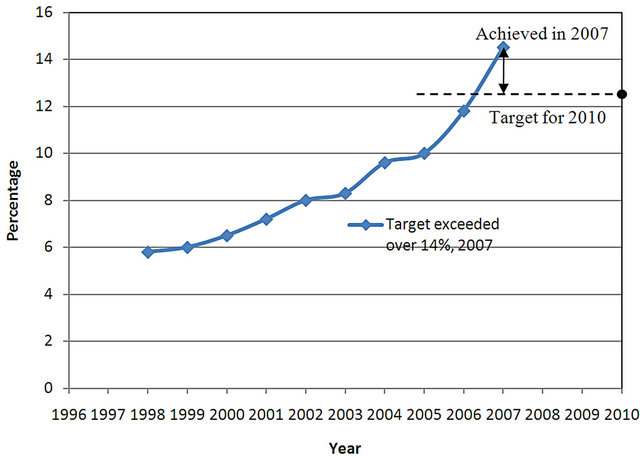
Figure 6. Fixed target for electricity from renewable energy sources in Germany [15].
ment of political goals (Figure 6).
In a quota system that would be economically absurd, because the target markets acts at the same time as a lid. Beyond the target rate, the current cannot be profitable marketed [15].
2.1.8.4. Avoidance of Greenhouse Gas Emissions through the Use of Renewable Energies in Electricity Sector The dependence on fossil fuels, which are still the main fuel source for electricity production, will be reduced by the use of renewable resources. The high level penetration of renewable energy production has a major contribution in greenhouse gases reduction and acidifying air pollutants in Germany. In 2010, electricity sector avoided over 76 million tons of greenhouse gases (Figure 7).
The amount of power tempered by the EEG alone led to a greenhouse gas reduction of around 58 million tones of CO2 which corresponds to two thirds of the total greenhouse gas reduction. The major reduction of greenhouse gas caused by electricity generation was primarily due to hydropower plants until 1990.
Today, the wind energy is making the largest contribution of 37% reduction while the total biomass eliminates 31%. The newly installed capacity of photovoltaic systems has avoided 7 million tones of CO2 equivalent greenhouse gases. Geothermal energy has a small share of electricity generation, so that the greenhouse gas avoidance is still well below one million tons of CO2 [16]. As a result, an annual estimated environmental and climate damage of 3.9 billion euros was avoided.
By the year 2020, about 250 million tons of CO2, referred to 2007, should be avoided in order to achieve the planned climate protection target (−40% GHE compared to 1990).
The expansion of renewable energies would provide 75 million tons of CO2, a reduction of about 30% of the total amount [17].

Figure 7. Avoided greenhouse gas emissions through the use of renewable energies in the electricity sector [16].
2.1.8.5. Creation of Jobs Successful renewable technologies have been developed and installed in the market.
The expansion of renewable energies in Germany creates more jobs than in past years. About 340,000 jobs were created in 2010 in the renewable energy market place (Figure 8) [18]. The EEG law secured employment in all industries. In the area of biomass most jobs were created (35.9% of 340,000) followed by solar energy (35.5%), then by wind energy (28.3%).
2.1.8.6. Development of Future Alternative Energy Sector Through the EEG law, the German economy is a main player in the international market of alternative energies. The German solar companies get benefits from strong market growth of the alternative energy sector. Sales of renewable energies in Germany in 2009 were 33 billion euros. The largest share of the sales of renewable energy was for solar energy followed by biomass and wind power. The investment in facilities for the use of renewable energies in Germany in 2009 amounted to approximately 18 billion Euros. Investment in facilities for the use of renewable energy sources in Germany in 2009 amounted to about 18 billion Euros. By far, the highest in 2009 was the investment in photovoltaic systems followed by Investment in wind turbines, biomass plants, solar thermal, geothermal and hydropower plants [19].
The avoided costs of energy imports were 1.3 and 1.7 billion euros in 2007 and 2010 respectively [17]. The economic benefits of renewable energies in Germany outweigh the costs invested. The total costs incurred by the EEG law are 3.3 billion Euros and the estimated benefits by reducing the wholesale price of electricity, the savings in energy imports, and avoidance of external costs in power generation is 9.4 billion Euros [20].

Figure 8. Workers in the field of renewable energies in Germany between 2004 and 2010 [18].
2.1.8.7. EEG Engine for Innovation in Germany The EEG is a successful technology policy tool. The annual reduction in remuneration for new bioenergy, wind and solar systems exerts a pressure on costs to operators and manufacturers. This makes the systems more efficient, reliable and cheaper. An innovative industry has established itself successfully selling its equipment locally as well as globally. The export quotas for wind and hydroelectric power have already been spent well over 70 percent and a similar development is expected to continue for solar and bio-energy [17].
2.2. Support Programs Worldwide
The German support programs for renewable energies have become international most famous model in recent years. In more than 100 countries around the world the support of renewable energies is already using the same or a similar model introduced and implemented in Germany. In the European Union, the German support method sets as a tool for the development of renewable energies. In addition to Germany, which adopted in 1991 a compensation system (feed-in-tariff) that has now also been used in Estonia (1998), Finland, France (2001), Greece, Latvia, Lithuania, Luxembourg, the Netherlands (2003), Austria (2003), Portugal (1988), Slovenia (2002), Spain (1994), the Czech Republic (2002), Hungary (2003) and Cyprus (2004). Tables 7-10 show the Feed-in-tariffs for photovoltaic and wind energy with the installed and planned capacities in some countries in the world. Five countries including Japan, India, Australia, USA and China are ready to work out the details, approve and introduce the “Feed-in-Tariff” for renewable energies.
Table 7. Feed-in-tariff for photovoltaic, installed und planned capacities in some European countries [1-24].
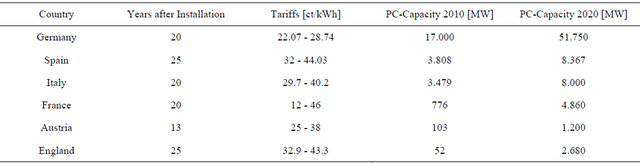
Table 8. Feed-in-tariff for wind energy, installed and planned capacities in some European countries [1-24].
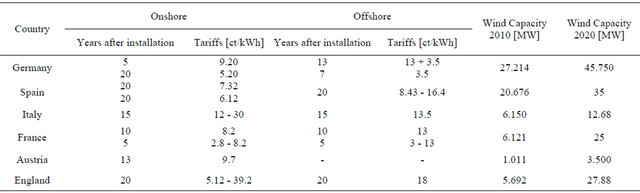
Table 9. Feed-in-tariff for photovoltaics, installed and planned capacities in some countries in the world [1-24].
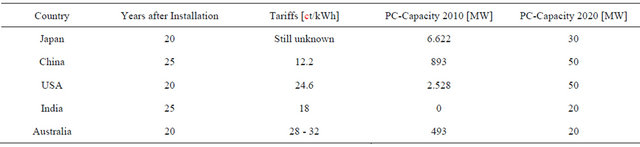
Table 10. Feed-in-tariff for wind energy installed and planned capacities in some countries in the world [1-24].

3. Promotion and Status of Renewable Energies Worldwide
Renewable energies are becoming more and more important worldwide. Their use increases steadily counting an important component of global energy supply. Wind, solar, hydropower, geothermal and biomass can provide energy to all continents with more security and promote economic development. Due to the worldwide government supports, the capacity of renewable energy generation has increased rapidly in recent years. The gross electricity generation capacity in the world in 2010 reached 4950 GW with a capacity of 1.313 GW renewable energies representing a share of 26%.
Worldwide, the largest energy capacity (1.005 GW) is provided by hydropower (Figure 9) representing 16.1% of the world electricity (Figure 10).
The installed capacity of photovoltaic grew from 2004 to 2009 at an annual average increase of 40% as shown in Figure 11. In 2010, the solar PV production reached a global level of 40 GW which is almost double the capacity in 2009. This was because of governmental incentives programs and the continued decline in PV modules prices.
The EU dominates the global PV market with 80% share (Figure 12). New 17 GW was installed in 2010, enough to power more than 10 million European households.
For the first time ever, Europe added in 2010 more photovoltaic than wind power, led by Germany and followed by Italy. Germany has added more PV (7.4 GW) than the whole world in 2009 and ended in 2010 with 17.3 GW of existing capacity [4].
The installed capacity of wind turbines increased in 2010 by an annual average of 27% reaching198 GW (Figure 13).
The top five countries (China, USA, Germany, Spain and India) dominate the total installed wind capacity in the globe with 74% (Figure 14). In 2010, China dominated the expansion by 8 GW in just 6 months reaching a total of 52 GW at the end of June.
The majority of European markets of renewable energy in 2011 recorded a stronger growth than previous year. First is Germany with an increase of 766 MW to a
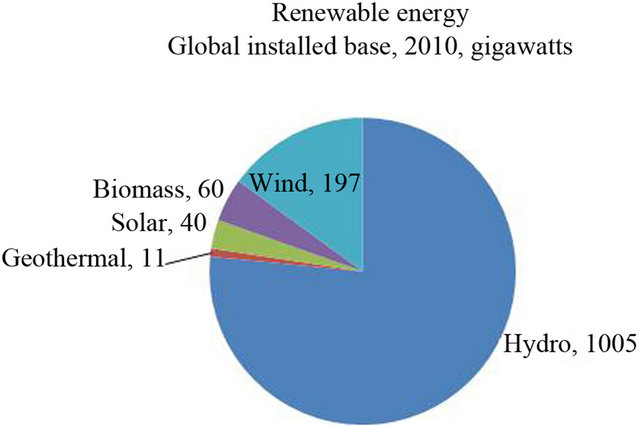
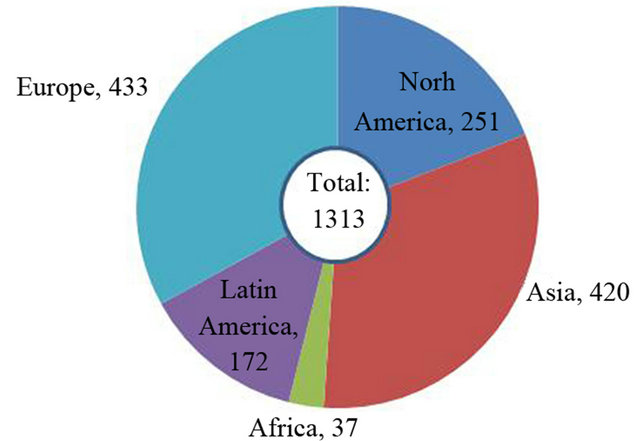
Figure 9. Renewable electric power capacity, existing at the end of 2010 [18].

Figure 10. Renewable energy share of global electricity production, 2010 [21].

Figure 11. Solar PV, existing world capacity, 1995-2010 [22].
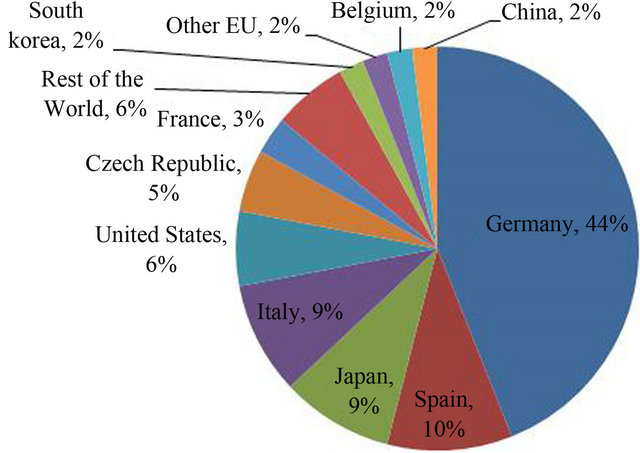
Figure 12. PV-capacity, top 10 countries, 2010 [22].
total power of 27 981 MW (766 MW, 27981 MW), followed by Spain (484 MW, 21150 MW), France (400 MW, 6606 MW), the UK (504 MW, 5707 MW) and Portugal (260 MW, 3960 MW). Only France and Denmark showed a lower expansion than in the first half of 2010. Denmark flew out of the top 10, whereas Portugal is now in 10th Position [23]. On the other side of the Atlantic, US built 2252 MW in the period from January to June 2011, which was 90% higher than the same period of 2010.
A relatively high growth can be observed in Canada where 603 MW were installed in the first half of the year, most of them in Ontario [23]. For the second half of 2011, new installations of 25,500 MW are expected, which would result in an additional building of a total of 43,900 MW. At the end of 2011, the total global wind power capacity is expected to reach 240,500 MW, which is equivalent to 3% of world energy demand [23].
A record of 211 billion dollars investments in renewable energies was reached in 2010, which was roughly a third more than total investments in 2009 (160 billion dollars), and more than five times the investment in the year 2004 (see Figure 15). Europe, for the first time, added wind power capacity more than photovoltaic.
Utility companies invested 143 billion dollars in renewable energy and biofuel projects [21]. This increase was mainly due to the incentive funding programs of many countries.
4. Conclusions
The results of this research and development work can be summarized as follows:
1) The EEG law has proved a high successful tool in the broad market of renewable technologies for electricity generation.
2) The Renewable Energy Law (EEG) guarantees 20 years of stable prices for green power and has already brought many homeowners and businesses to install photovoltaic modules and to feed their electricity into the national grid.
3) By the year 2010, the clean production of electricity by renewable energies in Germany has risen to around 202,000 GWh.
4) About 70 million tons of CO2 emissions in 2009 were avoided through the use of renewable energies in electricity generation in Germany.
5) The economic benefits of the EEG law exceed its cost by several times.
6) The acceptance and payment guarantee by the EEG provides incentives for new investments in renewable power generation.
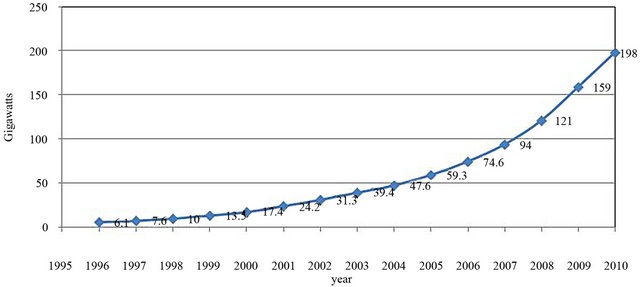
Figure 13. Wind power, existing world capacity, 1996-2010 [22].
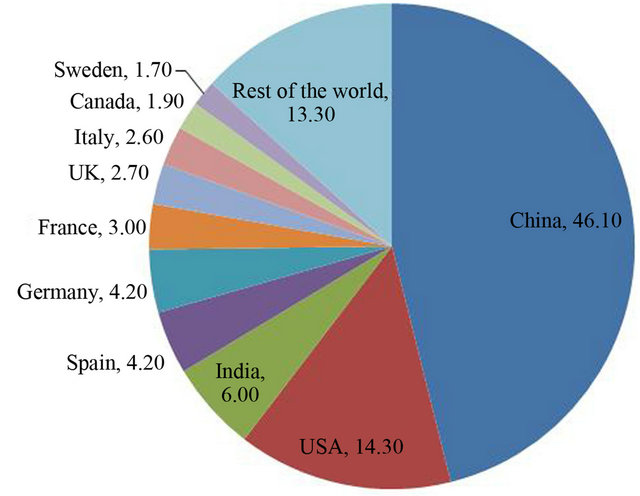
Figure 14. Wind-capacity (%), top 10 countries, 2010 [24].
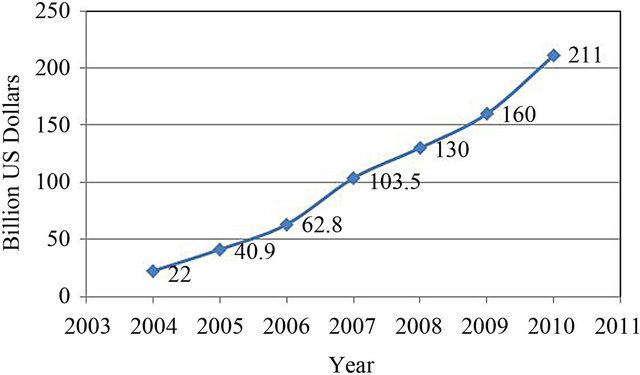
Figure 15. Global new investment in renewable energy, 2004-2010 [21].
7) The introduction of various feed in tariff programs and especially the EEG Laws has created more than 400,000 jobs.
REFERENCES
- Eurosolar.org, “25 Years Tschernobyl—Time Bomb Atom Energy—Nuclear Phase-Out Now!” IPPNW-Congress, Berlin, Urania, 8-10 April 2011, p. 14. www.tschernobylkongress.de
- Domovita-Haustechnik GmbH, “Collection of Information about Energy and Eergy Laws,” Energy Laws, pp. 1-3. www. de/zusatz/energiegesetze/Erneuerbare.pdf
- Wikipedia, “Renewable-Energies-Laws,” Photovoltaic Performance-Based Support Rates in ct/kWh. www.de.wikipedia.org
- Federal Ministry for Environment, Nature Conservation and Reactor Safety (BMU), Working Group on Renewable Energies-Statistics (AGEE-Stat), “Development of Renewable Energies in Germany in 2011,” 2011. www.erneuerbare-energien.de
- H. Herminghaus, “EEG-Support for Wind Power in Germany,” Stand, 2011. www.umweltbewusst-heizen.de
- Federal Office of Economics and Export control, “Base-, Bonusund Innovation Support Solar,” Stand, 2009. www.markus-energie.de
- J. J. Oppermann GmbH & Co. KG, “Renewable Energies, Support and Credits for Solar Collectors.” www.alternative-energiequellen.com
- Press Office of Consumer Schleswig Flensburg, “Support Renewable Energies.” www.schleswig-flensburg.de
- Agency for Climate Protection, “E-Heating Laws and Solar Thermal & Wood,” 2011, pp. 48-49. www.agentur-fuer-klimaschutz.de
- Allianz-Knowledge, “Government Support for Solar Energy Use Worldwide.” www.wissen.allianz.de
- Federal Ministry for Environment, Nature Conservation and Reactor Security, “Experience Report 2011 for Renewable-Energies-Law (EEG-Experience Report),” Stand, 2011, p. 3. www.bmu.de
- German Renewable Energies Agency, “The Electricity Mix in Germany 2010.” www.unendlich-viel-energie.de
- Germany Information Portal on Renewable Energies, “The Electricity Mix in Germany in 2011,” 2011. www.unendlich-viel-energie.de
- Federal Ministry for Environment, Nature Conservation and Reactor Security: Working group Renewable Energies-Statistics (AGEE-Stat), “Graphs and Tables with Data of Development of Renewable Energies in Germany in 2011,” 2011, p. 12. www.bmu.de
- Federal Ministry for Environment, “The Renewable Energies-Law—Success Story.” www.unendlich-viel-energie.de
- Federal Environment Agency, “Avoided Greenhouse Gas Emissions through the Use of Renewable Energies in the Electricity Sector.” www.umweltbundesamt-daten-zur-umwelt.de
- Federal Ministry for Environment, “What Will Be the New Renewable Energies-Law EEG?” http://ebookbrowse.com
- Federal Ministry for Environment, Nature Conservation and Reactor Security. Working Group Renewable Energies-Statistics (AGEE-Stat), “Renewable Energies 2010,” 2010, p. 16. http://www.renewable-energy-projects.de
- S. Handelsblatt, “Data and Facts on the Renewable Energies in Germany.” www.de.statista.com
- DGS Landesverband Berlin, “Market Economy and Ecology,” p. 14. www.dgs-berlin.de
- Renewable Energy Policy Network for the 21st Century (REN21), “Renewables 2011, Global Status Report,” 2011, pp. 18, 20, 23, 35. www.ren21.net
- Globservateur, “Energy > Renewables Exceeds Oil and Coal.” www.globservateur.blogs.ouest-france.fr/
- Austrian Wind Energy Association (IG Wind Power), “Wind Energy-World Market after a Weak Year 2010 Come back on Track—Semi-Annual Report of WWEA.” www.igwindkraft.at
- GWEC, “Top 10 New Installed Capacity Jan-Dec 2010.” www.sino-report.com