Energy and Power Engineering
Vol. 4 No. 5 (2012) , Article ID: 22839 , 9 pages DOI:10.4236/epe.2012.45043
Probabilistic Fuzzy Approach to Assess RDS Vulnerability and Plan Corrective Action Using Feeder Reconfiguration
1Jamia Millia Islamia University, New Delhi, India
2IITB, Sonepat, India
3Research Scholar, Department of Electrical Engineering, Faculty of Engineering and Technology, Jamia Millia Islamia, New Delhi, India
Email: romaraina@yahoo.com
Received July 28, 2012; revised August 30, 2012; accepted September 13, 2012
Keywords: Branch Voltage; Three Phase Load Flow; Voltage Stability Index (SI); Radial Distribution System (RDS); Monte Carlo; Probability Distributions; Fuzzy Set; Node Vulnerability Index (VI); Feeder Reconfiguration
ABSTRACT
Two common problems for a typical Power distribution system are voltage collapse & instability. Challenge is to identify the vulnerable nodes and apply the effective corrective actions. This paper presents a probabilistic fuzzy approach to assess the node status and proposes feeder reconfiguration as a method to address the same. Feeder reconfiguration is altering the topological structures of distribution feeders by changing the open/closed states of the sectionalizing and ties switches. The solution is converge using a probabilistic fuzzy modeled solution, which defines the nodal vulnerability index (VI) as a function of node voltage and node voltage stability index and predicts nodes critical to voltage collapse. The information is further used to plan best combination of feeders from each loop in distribution system to be switched out such that the resulting configuration gives the optimal performance i.e. best voltage profile and minimal kW losses. The proposed method is tested on established radial distribution system and results are presented.
1. Introduction
Power distribution systems, especially in developing countries, are steadily approaching towards its maximum operating limits and voltage stability is a major concern. Voltage instability makes the system unreliable and results in system collapse and blackout. Around 30% to 40% of total investments in the electrical sector go to distribution systems, but same have not received the technological impact as generation and transmission systems.
The voltage instability can be addressed using the various techniques. One of the control options for managing RDS is feeder reconfiguration. Reconfiguration is opening and closing the sectionalizing and tie-switches in a RDS. It modifies the network structure and thus reduces the real power losses, and improves voltage stability. However reconfiguration is effective only when tieswitches are planned at optimum location and the best combinations are selected for the same.
Distribution systems have combinations of loads like industrial, commercial, domestic, lighting etc. and each of them peak at different times of the day and need to be effectively captured, while planning reconfiguration or locating tie switches for an existing RDS expansion system.
There are methods proposed by various authors on various methods for reconfiguration. B. Venkatesh and Rakesh Ranjan propose a method that uses fuzzy adaptation of Evolutionary Programming (FEP) as a solution technique [1]. Takanobu proposed distribution network expansion planning method by network reconfiguration and generation of construction plans [2]. Dong-Joon Shin represents an approach for service restoration and optimal reconfiguration of distribution network using genetic and Tabusearch method [3]. B. Venkatesh, Rakesh Ranjan, H. B. Gooi developed a new method for optimal reconfiguration of radial distribution systems which maximizes a fuzzy index developed using a maximum load ability index [4]. R. Ranjan, B. Venkatesh, D. Das proposed novel method for selecting an optimal branch conductor for radial distribution networks based on fuzzy adaption of evolutionary programming [5]. P. V. V. Rama Rao and S. Sivanagaraju proposes plant growth simulation algorithm to enhance speed and robustness and does not require external parameters for loss minimization and load balancing [6].
This paper discusses the plan of optimizing the Radial distribution system via feeder reconfiguration using probabilistic fuzzy modeled solution. The proposed solution calculates node vulnerability index and use the same for reconfiguration. The solution is based on concept of probabilistic fuzzy rules and is suitable for modeling real world systems, where we have both statistical and non-statistical uncertainties. Probabilistic part of the model uses Monte Carlo simulation (MCS) and considers input parameters as random variables with predefined probability distribution shape. Further for calculating vulnerability index, paper uses fuzzy based algorithm, and uses fuzzified node voltage and node voltage stability index as inputs. Based on vulnerability index of nodes, a scheme for planning tie and sectionalizing switches to achieve loss reduction is presented. While the scope of the feeder reconfiguration problem discussed here is limited to the discussion of losses, the results developed provide significant insight into useful characteristics associated with the modeling and properties of related feeder reconfiguration problems. The above technique can be used for long term distribution network expansion planning purposes also.
The paper is organized as follows. In Section 2, the methodology & steps used are discussed. Section 3 defines formulas and calculation algorithm used. Section 4 describes nodal vulnerability index computations, Section 5 elaborates the reconfiguration planning & calculations showing reduction in losses and Section 6 concludes the paper.
2. Methodology
Paper presents RDS reconfiguration planning using following steps:
• Define the load flow & stability index formulas & calculation algorithm;
• Infuse randomness in input variables in line with real time scenario by modeling input data as random variables with predefined distribution to address combination of loads;
• Use Monte Carlo simulation and generate output distribution for nodal voltages & voltage stability index and calculate node vulnerability index;
• Use Node vulnerability index as basis for RDS reconfiguration planning;
• Recalculate the losses after applying proposed reconfiguration.
3. Formulas & Calculation Algorithm
3.1. Load Flow & Stability Index Calculation Formula’s & Algorithm
For simulation purpose this paper uses a load flow algorithm, based on concept described by R. Raina, M. Thomas, R. Ranjan [7] and modified to suite the probabilistic model (for Monte Carlo simulation). The algorithm calculates the total real and reactive system power loss, nodal voltages and stability index.
The load flow calculation algorithm uses the basic systems analysis method and circuit theory and requires only the recursive algebraic equations to get the voltage magnitudes, currents & power losses at all the nodes.
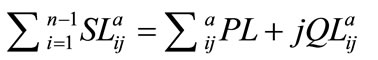
This load flow methodology also evaluates the total real and reactive power fed through any node. Using concept of simple circuit theory, the relation between the bus voltages and the branch currents in Figure 1 can be expressed as:
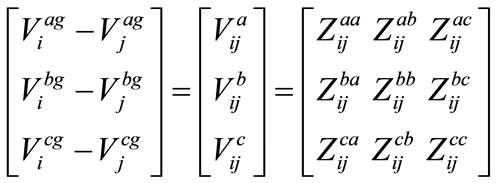 (1)
(1)
where;
 = Voltage of phase a at node i with respect to ground;
 = Voltage drop between two phases a and b at node I;
 = Voltage Drop between nodes i and j in phase a;
 = Current through phase a between nodes i and j;
 = Selfimpedance between nodes i and j in phase a;
 = Mutual impedance between phase a and b between nodes i and j;
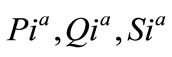 = Real, reactive and complex power loads at phase a at ith bus;
 = Complex power at phase (a, b and c) between nodes i and j;
 = Real power loss in the line between node i and j;
 = Reactive power loss in the line between node i and j;
 = PLijphase + jQLijphase.
Rewriting (1)
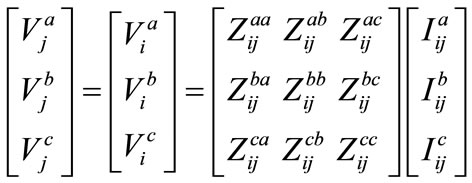
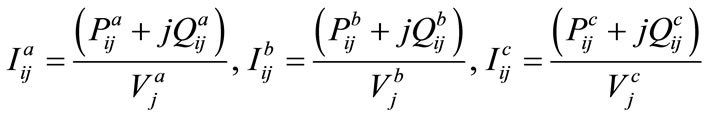
Following equations gives the branch currents between the nodes i and j:
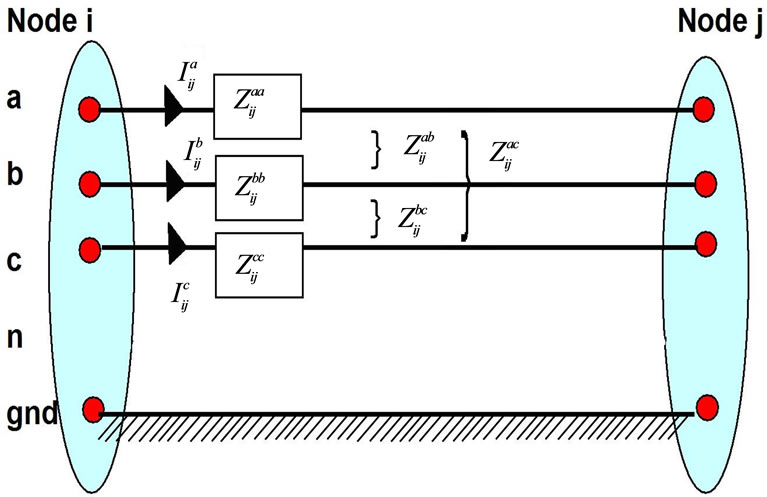
Figure 1. Three phase four wire line model.
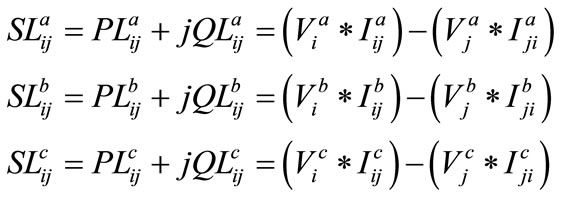
The real and reactive power losses in the line between buses i and j are written as;
This algorithm computes the real & reactive power and uses the formula given in Equation (2). Receiving end power at any phase, say phase A, of line between the nodes i and j is expressed as:
 (2)
(2)
K = index of all nodes fed through the line between nodes i & j.
mn = index of all line connected between nodes m and n through the line between nodes i and j.
The simulation also calculates the voltage stability index (SI) for all the nodes of the radial distribution system using the load flow results. There are several methods to estimate or predict the voltage stability condition of a power system. The simulation utilizes the voltage stability index defined by N. C. Sahoo, K. Prasad [8] to indicate the voltage stability condition at each bus of the system. Stability index (SI) for the bus j, for atypical branch as shown in Figure 2 is defined as:
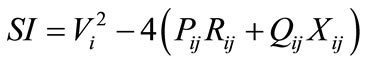 (3)
(3)
The value of SI varies from 0 to 1. For stable operation of the RDS, Stability Index (SI) should be nearing one.
3.2. Infusing Randomness in Inputs & Monte Carlo Simulation to Address Combination of Loads
Monte Carlo simulation principle is described in Figure 3. The principle is based on considering input parameters as random variables and with predefined distribution shape. Probability distribution shape describes the likelihood of same future events. Uncertain input parameter is considered as a random variable P and numbers of realizations Pi of P are generated and load flow algorithm is run for each of them producing an output Ri. Set of outputs Ri represents the set of realizations of the random variable R.
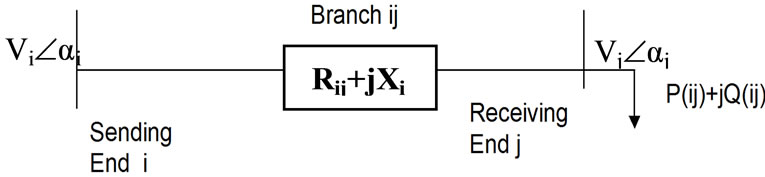
Figure 2. Electrical equivalent of one branch.
For simulation purpose connected load is assumed to be varying based on Table 1 probability distribution shape. This simulation is run on a typical 19 bus distribution system from the D. Thukram, H. M. W. Banda, and J. Jerome [9] for 500 trails and distribution of output results are used as input for calculating node vulnerability index and input data are given in Appendix of this paper.
3.3. Mote Carlo Simulation Results
The simulation is run for 500 trails and distribution of results is tabulated as frequency distribution. Table 2 provides the Real, Reactive power loss values corresponding
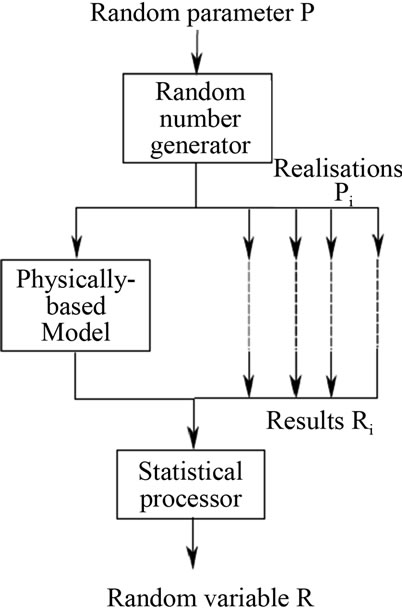
Figure 3. Sketch for monte carlo simulation method.
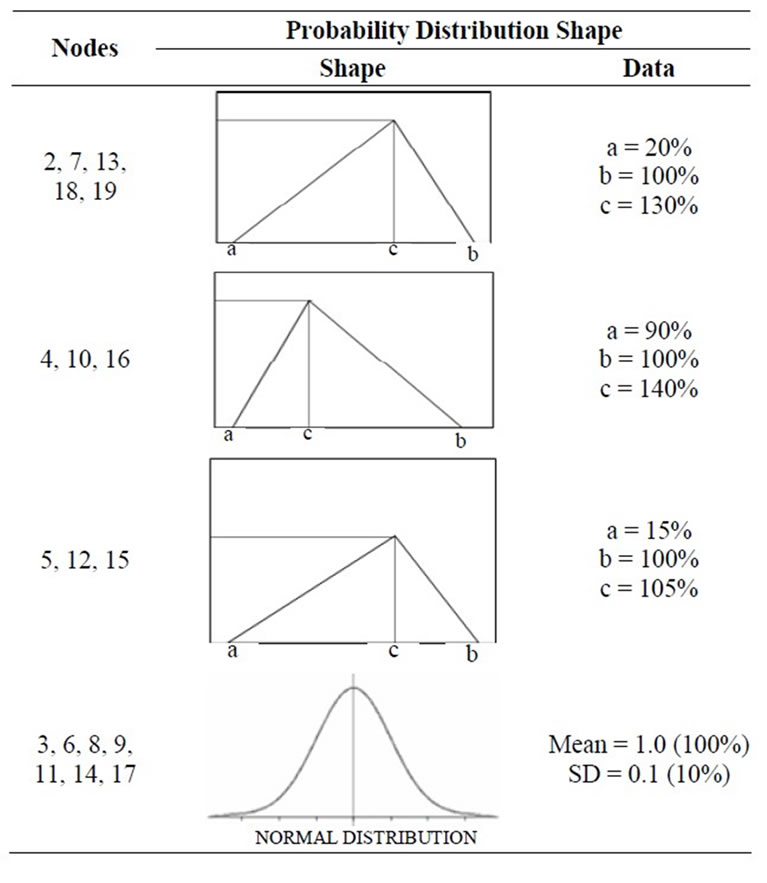
Table 1. Probability distribution for connected load.
to 90% (0.9) cumulative probability. The value of 90% (0.9) cumulative probability signifies that for a simulation run of 500 trails, 90% time values were less than 138.4 kW/66.9 KVAr.
Table 3 shows the simulation distribution results for selected nodal voltages based on 500 trails including minimum nodal voltage corresponding to 90% cumulative probability.
Table 4 shows the simulation distribution results for node stability index based on 500 trails. Minimum stability index corresponding to 90% cumulative probability is also calculated.
The simulation results obtained above are used as input for calculating vulnerability index.
4. Nodal Vulnerability Index Computations
As vulnerability is not a statistical uncertainty, this paper proposes fuzzy approach and uses voltage and stability index of each node to calculate the vulnerability index.
The bus voltages and the SI are selected as the crisp input parameters and expressed as fuzzy set notation. The fuzzy “If-Then” rules are then used to evaluate the vulnerability index of each node and defuzzification provides the crisp value of the output. For calculation purpose a triangle membership functions is assumed for bus voltage and stability index profile and are represented in fuzzy set notation. The bus voltage profiles are divided into five triangular membership functions, as indicated in Figure 4.
Fuzzy Interpretation of voltage (V);
If V < 0.925, then “Unstable (UN)”;
If V < 0.925, then “Unstable (UN)”;
If V = 0.9 - 0.95, then “Less Stable (LS)”;
If V = 0.925 - 0.975, then “Moderately Stable (MS)”;
If V = 0.95 - 1.0, then, “Stable (S)”;
If V > 0.975, then, “Over range (Over)”.
Similarly the stability index profiles are divided into five triangular membership functions using fuzzy set notations, as given in Figure 5.
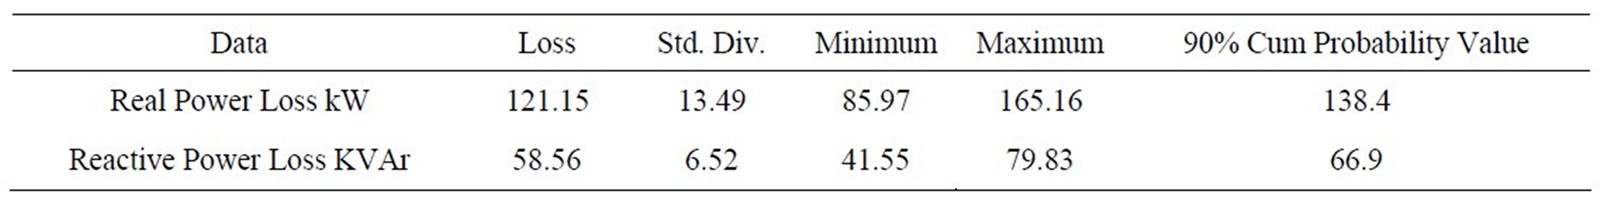
Table 2. Distribution data for real & reactive power.
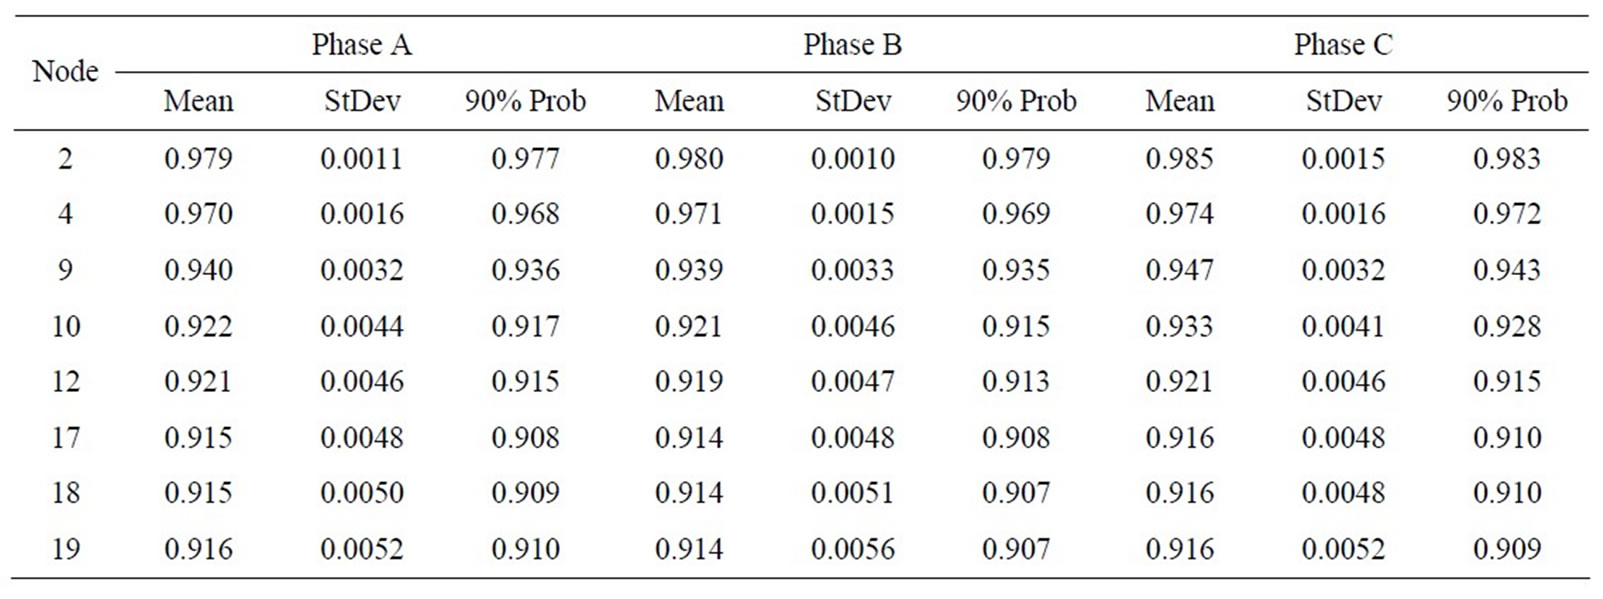
Table 3. Distribution data for voltage magnitudes (sample nodes).
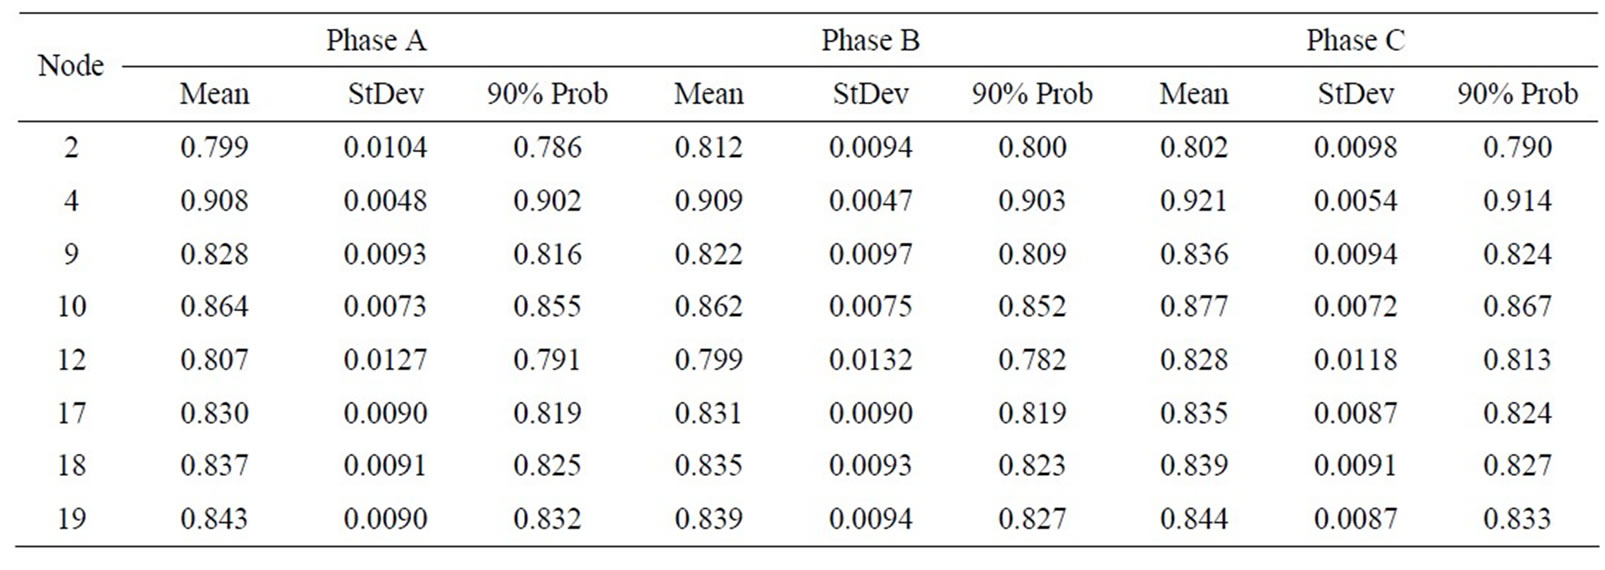
Table 4. Distribution data for stability index (sample nodes).
Fuzzy Interpretation of stability index (SI);
If SI < 0.85, then “Unstable (UN)”;
If SI = 0.8 - 0.9, then “Less Stable (LS)”;
If SI = 0.8 - 0.9, then “Less Stable (LS)”;
If SI = 0.9 - 1.0, then, “Stable (S)”;
If SI > 0.975, then, “Over range (Over)”.
Using fuzzy “If-Then” rules as shown in Table 5, Vulnerability index is calculated. Fuzzy “If then” rules, strengths of triangular membership function, output range and output calculation formulas are shown in Appendix,
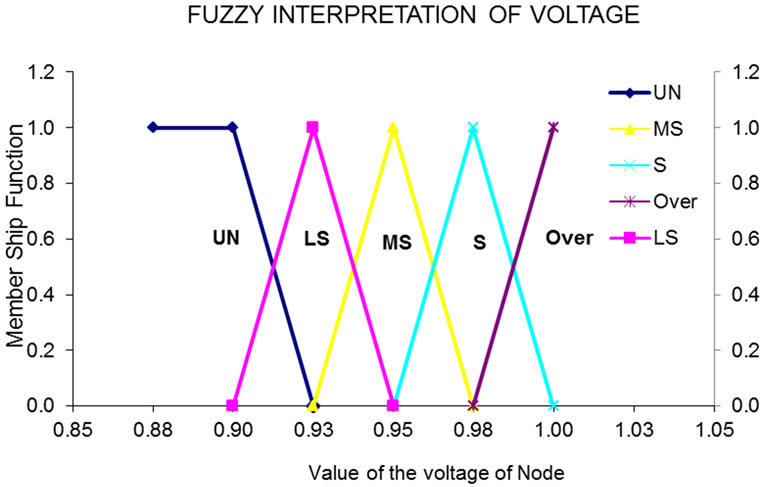
Figure 4. Fuzzy number representation of voltage.
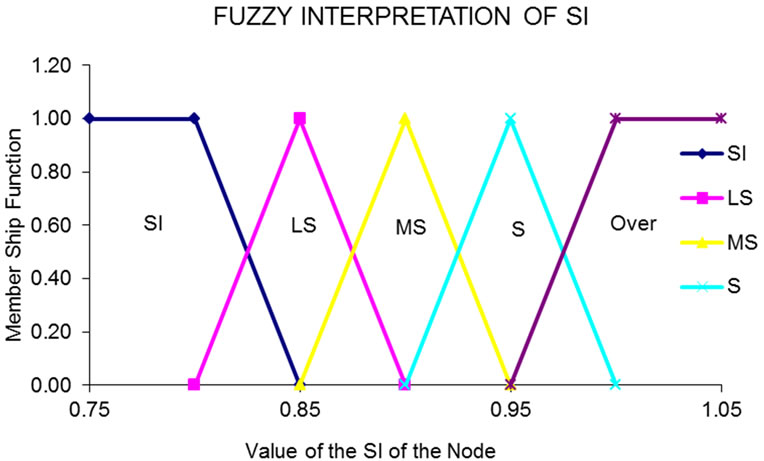
Figure 5. Fuzzy number representation of stability index.
Table S4, of this paper. The above procedure is repeated for all the nodes to calculate the output vulnerability index for all 500 trails results. Figure 6 shows the scatter plot of vulnerability index mean value of all trails.
A cut-off level of vulnerability index value of 0.15 is proposed as unreliable node and prone to voltage collapse. The results obtained are further plotted using box plot.
In descriptive statistics, boxplot graphically depict groups of numerical data through their five-number summaries.
Figure 7 shows the boxplot of nodal vulnerability index distribution for all nodes at a glance. We can note that for node 10 to 19, some distribution of vulnerability index falls below the cut-off value of 0.15. This means that for simulation of 500 random trails, some combination of input data resulted vulnerability index less than 0.15.
To further study the node vulnerability index, probability of vulnerability index values coming below 0.15 is calculated and results are shown on Table 6. The probabality is based on vulnerability index distribution results for 500 trails.
We can safely assume that if probability is less than 5%, node can be considered safe as they are about the cutoff values 95% times. However nodes with probablity greater than 5% need addressing.
5. Reconfiguration
In radial distribution system, network reconfiguration is performed by closing/opening the tie-in and sectionalisation switches. Conventional load flow techniques take large number of iteration and huge computational time to decide on optimal reconfiguration. The proposed method narrows down the reconfiguration to only nodes which have unacceptable vulnerability index. The objective behind reconfiguration is to make unacceptable vulnerability index value to acceptable level which intern will reduce the power loss and will make system more stable.
Objective function of above can be expressed as below mathematical model.
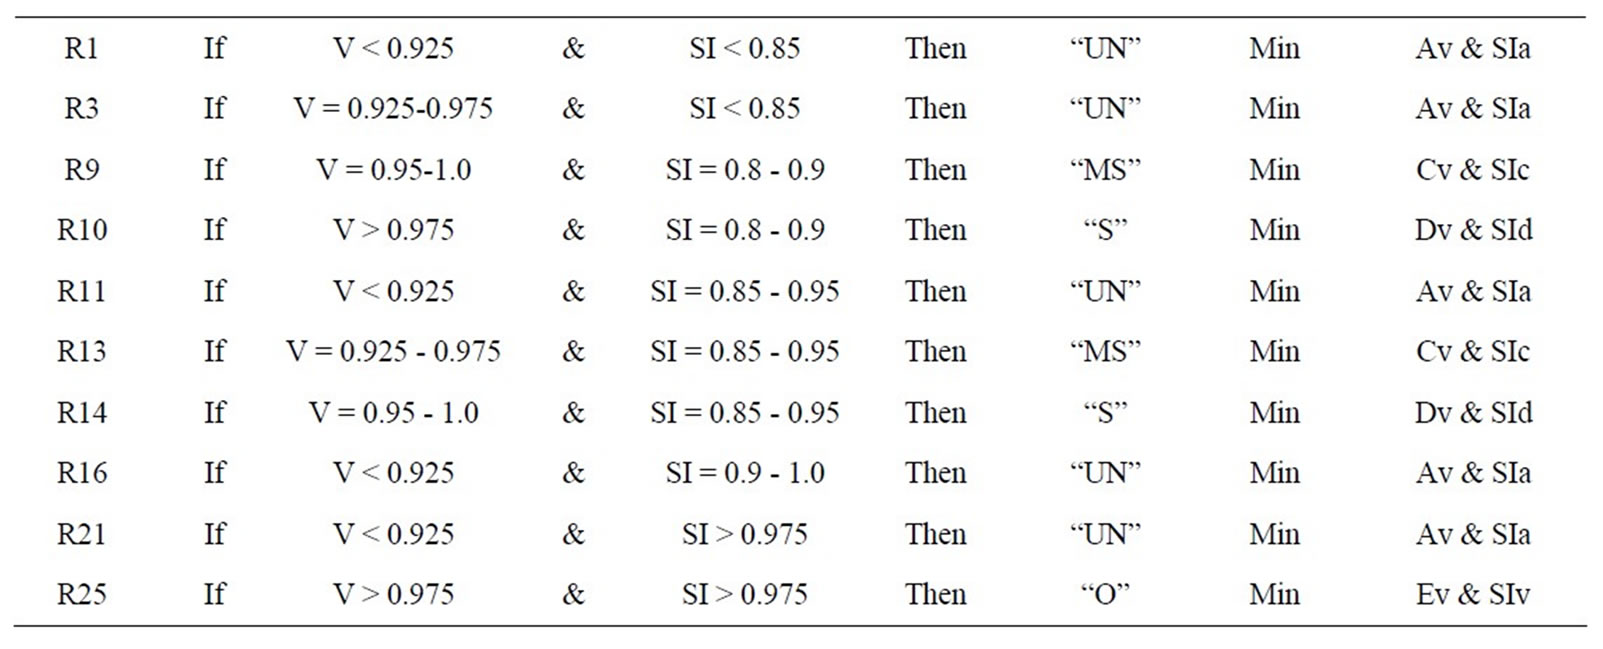
Table 5. Sample fuzzy “if then” rules.
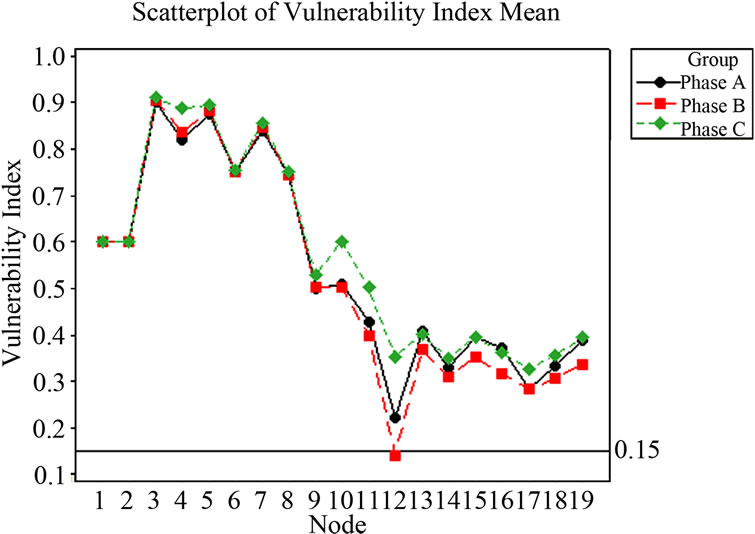
Figure 6. Scatterplot of vulnerability index mean.
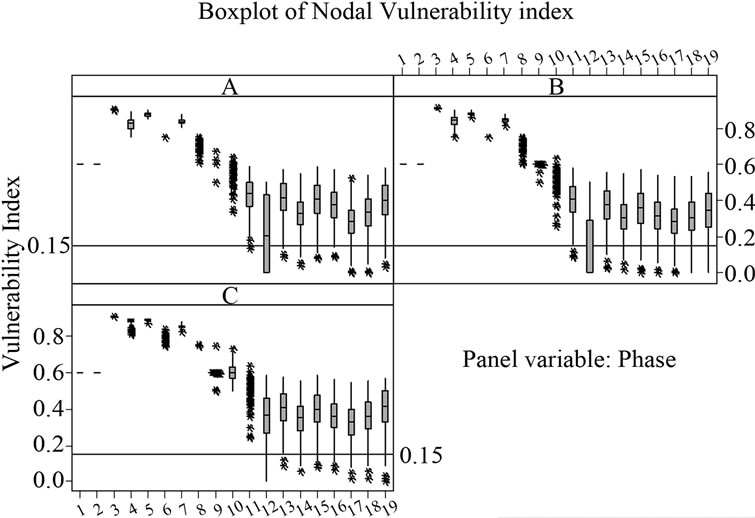
Figure 7. Boxplot of nodal vulnerability index.
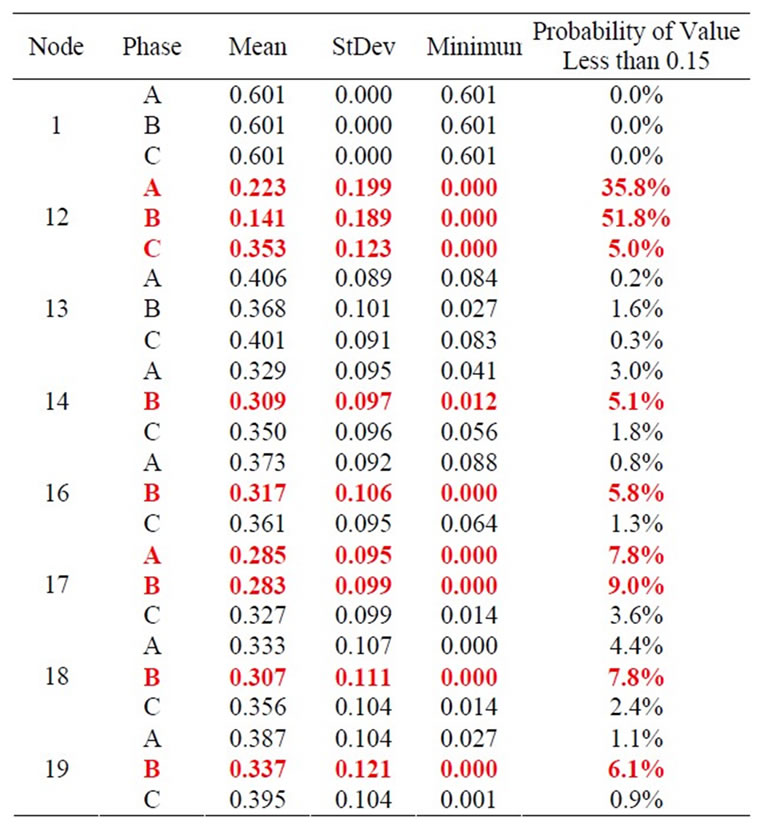
Table 6. Distribution data for vulnerability index (sample nodes).
PVI95% ;
;
 is minimum (i.e. Losses are minimum);
where:
PVI95% = Probability of VI value greater than 0.15;
N = Number of nodes in RDS.
The proposed method can be used for an RDS having existing tie-in & sectionalising switches. The method can also be used as planning tool for identifying the best location of installing new tie-in switches in an existing RDS or for a RDS expansion. For planning new tie/sectionalising switches, the proposed method considers nodes with low VI, its distance to nearest healthy node on other lateral, installation limitation, cost of installation etc. as input. The flow chart of algorithm for proposed method is shown in Figures 8 and 9.
This simulation is run on a typical RDS from the D. Thukram, H. M. W. Banda, and J. Jerome [9], which is without the tie-in switches. The result selects 5 - 10 as possible reconfiguration. Refer Figure 10.
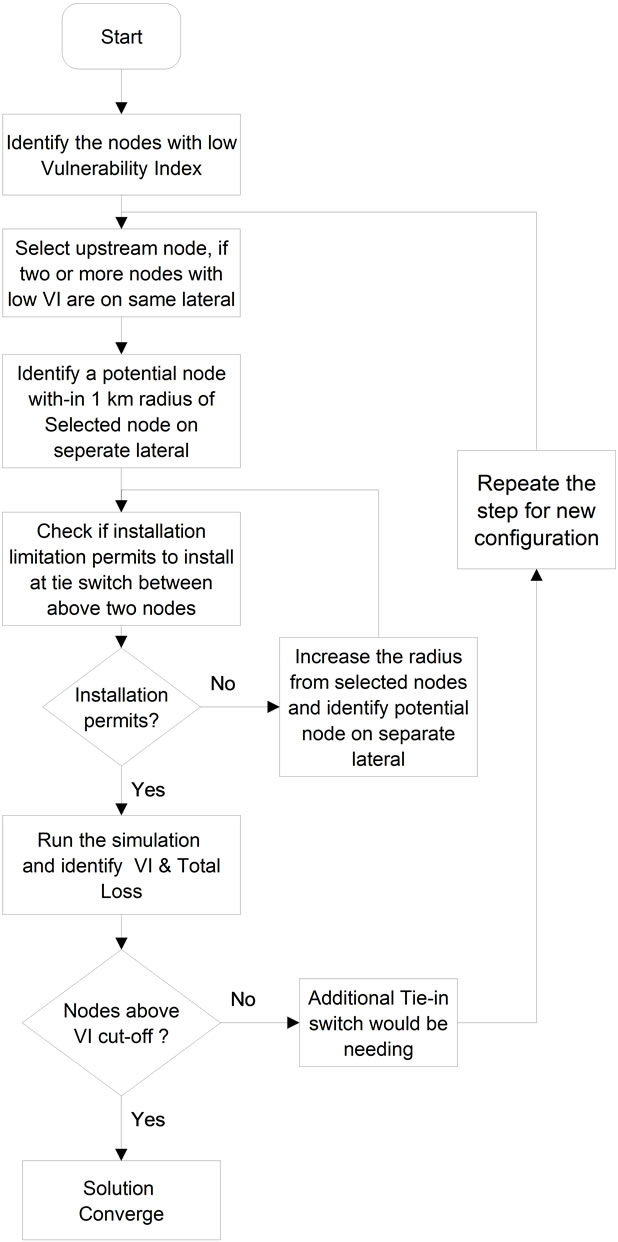
Figure 8. Flowchart for planning reconfiguration tie-in switches.
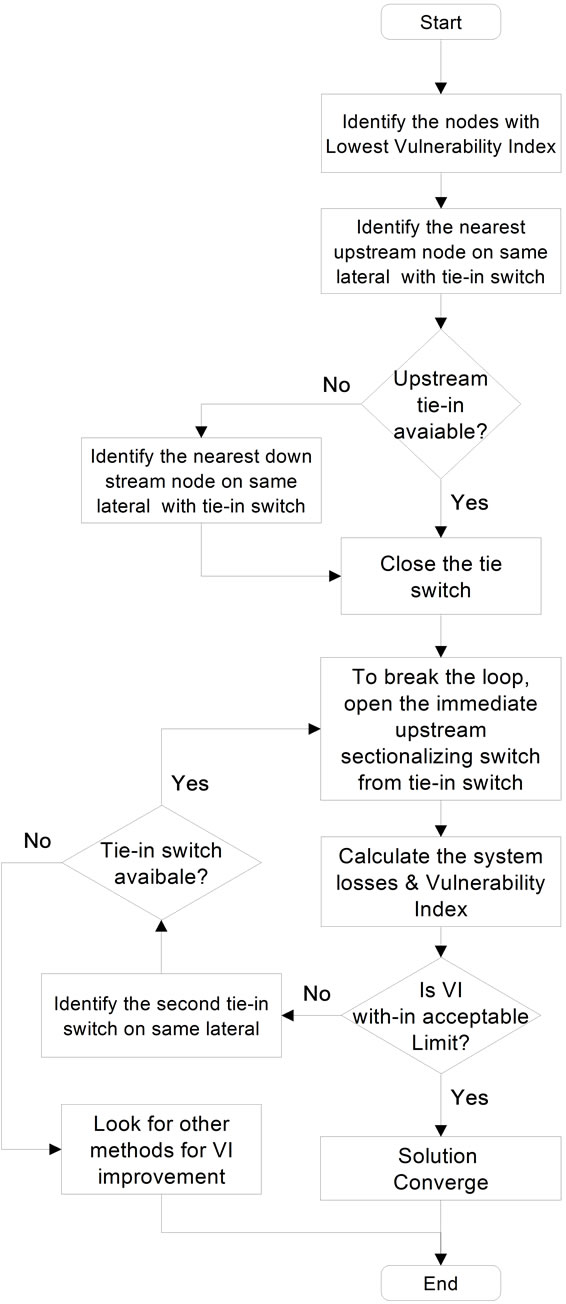
Figure 9. Flowchart for reconfiguration with existing tie-in switches.
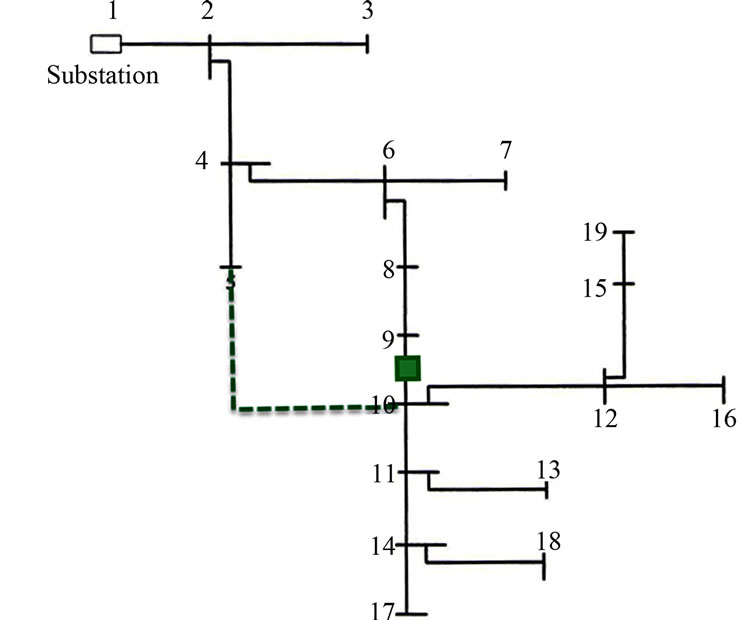
Figure 10. Shows a practical 19 bus distribution feeder used for the modeling and simulation purpose with 5 - 10 reconfiguration.
Table 7 shows Real & Reactive power with reconfiguring node 5 - 10.
The real power loss has been reduced by 28%, when compared to results before reconfiguration as shown in Table 2.
Figure 11 shows the scatter plot of vulnerability index mean value of all trails with reconfiguration node 5 - 10. The mean VI has increased drastically and is well above 0.15 cut-off value, when compared to the results before reconfiguration value as shown in Figure 6.
Figure 12 shows the boxplot of nodal vulnerability index distribution for all nodes at a glance with reconfiguration 5 - 10. All nodes have distribution of vulnerability
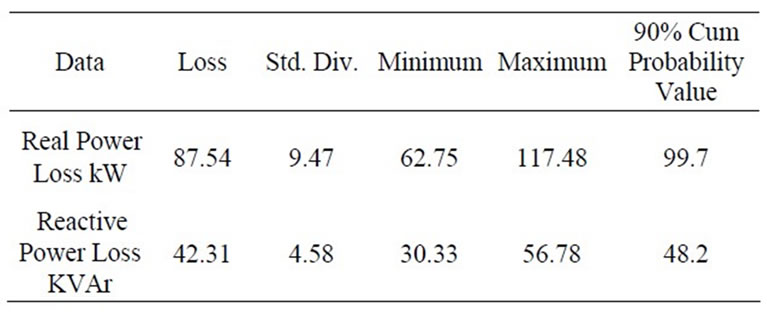
Table 7. Distribution data for real & reactive power with reconfiguring node 5 - 10.
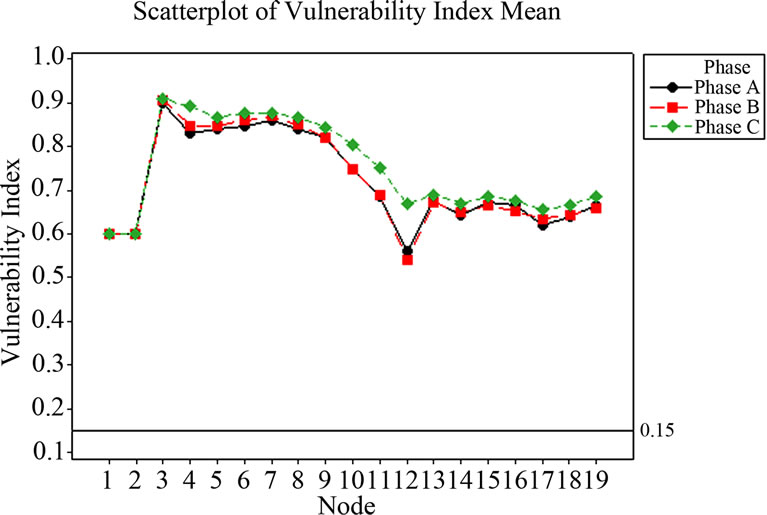
Figure 11. Scatterplot of vulnerability index mean after reconfiguration 5 - 10.
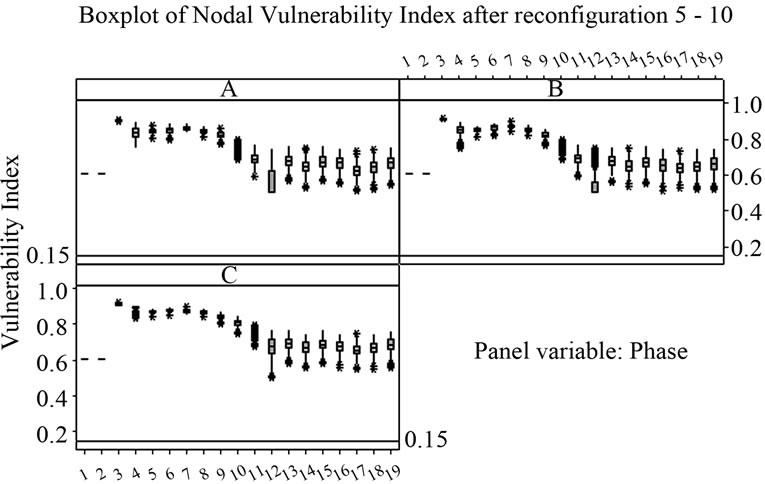
Figure 12. Boxplot of nodal vulnerability index.
index well above cut-off value of 0.15, when compared to the results before reconfiguration as shown in Figure 7. This means that for simulation of 500 random trails no combination of input data resulted vulnerability index less than 0.15.
The method was also tried on the reconfiguration of RDS with existing tie-in-switches in place.
6. Conclusions
This paper uses the application of probabilistic fuzzy approach to assess the node status and proposes reconfiguration as a method to address the same. Solution is converge using a probabilistic fuzzy modeled solution. The accessing the node status, a unique index name ‘Vulnerability index’ is proposed which is a function of node voltage and node voltage stability index.
Reconfiguration is proposed for the nodes which have an acceptable VI value and is achieved by selecting a reconfiguration which gives an acceptable value of VI, and the optimal performance i.e. best voltage profile and minimal kW losses. The proposed method is tested on established RDS and results are presented. Considering the fact that input uses repeated random sampling, proposed methodology covers and model all possible scenarios and comparison can be drawn for a wide variation in loads. The method can be used for design studies, initial stages planning also.
REFERENCES
- B. Venkatesh and R. Ranjan, “Optimal Radial Distribution System Reconfiguration Using Fuzzy Adaptation of Evolutionary Programming,” Electrical Power and Energy Systems, Vol. 25, No. 10, 2003, pp. 775-780.
- T. Asakura, T. Genji, T. Yura, N. Hayashi and Y. Fukuyama, “Long Term Distribution Network Expansion Planning by Network Reconfiguration and Generation of Construction Plans,” IEEE Transactions on Power Systems, Vol. 18, No. 3, 2003, pp. 1196-1204. HUdoi:10.1109/TPWRS.2003.811170U
- D. J. Shin, j. O. Kim, T. K. Kim, J. B. Choo and C. Singh, “Optimal Service Restoration and Reconfiguration of Network Using Genetic-Tabu Algorithm,” Electrical Power Systems Research, Vol. 71, No. 2, 2004, pp. 145-152. HUdoi:10.1016/j.epsr.2004.01.016U
- B. Venkatesh, R. Ranjan and H. B. Gooi, “Optimal Reconfiguration of Radial Distribution Systems to Maximize Loadability,” IEEE Transactions On Power Systems, Vol. 19, No. 1, 2004, pp. 260-266. HUdoi:10.1109/TPWRS.2003.818739U
- R. Ranjan, B. Venkateshand and D. Das, “Optimal Conductor Selection of Radial Distribution Networks Using Fuzzy Adaptation of Evolutionary Programming,” International Journal of Power and Energy systems, Vol. 26, No. 3, 2006, pp. 401-416. HUdoi:10.2316/Journal.203.2006.3.203-3444U
- P. V. V. Rama Rao and S. Sivanagaraju, “Radial Distribution Network Reconfiguration for Loss Reduction and Load Balancing Using Plant Growth Simulation Algorithm,” International Journal on Electrical Engineering and Informatics, Vol. 2, No. 4, 2010, pp. 266-277.
- M. S. Thomas, R. Ranjan and R. Raina, “Fuzzy Modeled Load Flow Solution for Unbalanced Radialpower Distribution System,” Proceedings of the IASTED International Conference on Power and Energy Systems (EuroPES 2011), Crete, 22-24 June 2011, pp. 153-159.
- N. C. Sahoo and K. Prasad, “A Fuzzy Genetic Approach for Network Reconfiguration to Enhance Voltage Stability in Radial Distribution Systems,” Energy Conversion and Management, Vol. 47, No. 18-19, 2006, pp. 3288- 3306. HUdoi:10.1016/j.enconman.2006.01.004U
- D. Thukram, H. M. W. Banda and J. Jerome, “A Robust Three Phase Power Flow Algorithm for Radial Distribution Systems,” Journal of Electrical Power Systems Research, Vol. 50, No. 3, 1999, pp. 227-236. HUdoi:10.1016/S0378-7796(98)00150-3U
Appendix
A. Input Data Input connected load data for the feeder are given in Table S1, Conductor data for the feeders are given in Tables S2 and S3.
B. Fuzzy “If-Then” Rules For a node; Voltage = V and Stability Index = SI.
Then the corresponding membership values for each zone of the five triangular membership functions can be defined as given in Table S4.
The strengths for five triangular membership functions are shown in Equation (5).
Table S5 shows the output ranges for vulnerability index assumed and uses defuzzification calculations given in Equation (4) to find the crisp value of vulnerability index.
 (4)
(4)
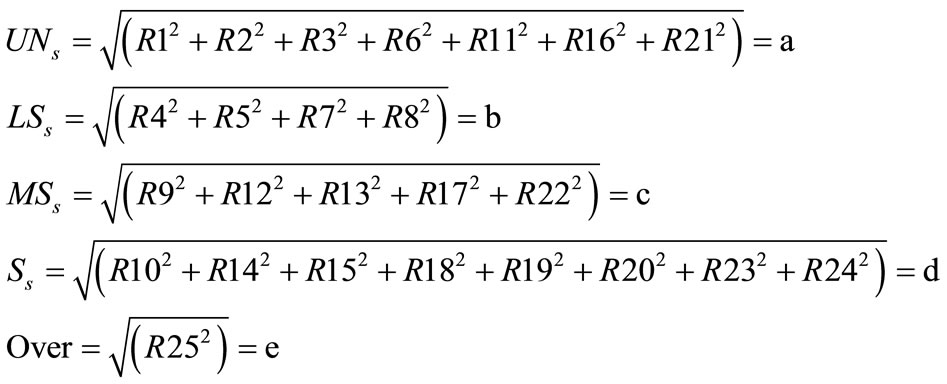
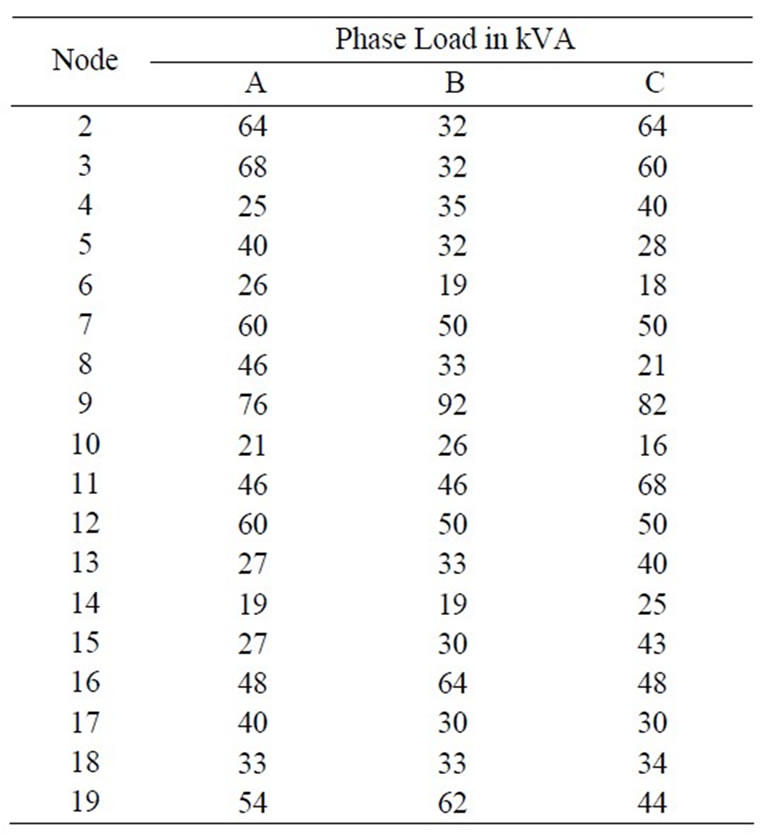
Table S1. Input load data.
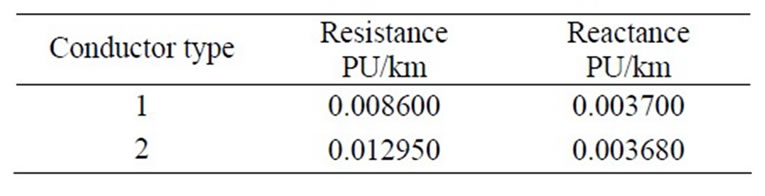
Table S2. Conductor data.
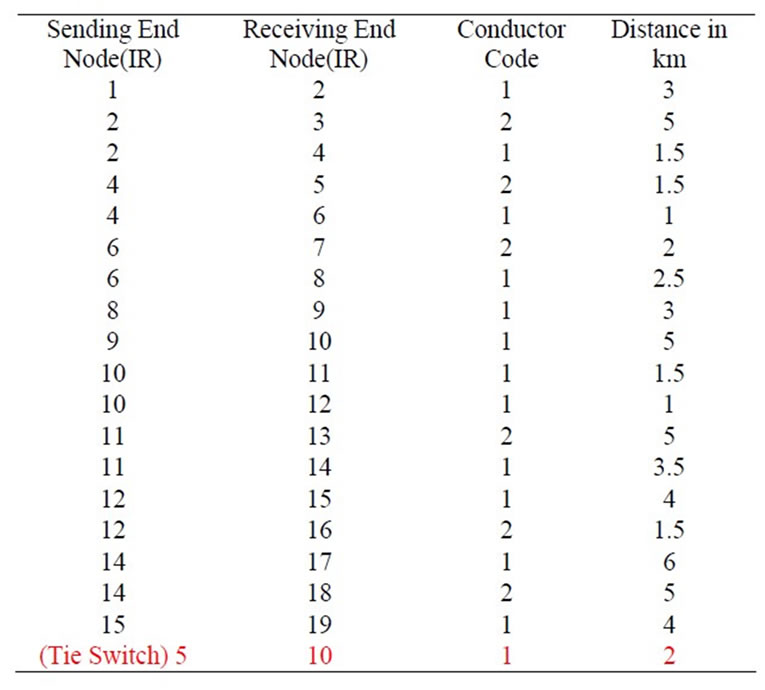
Table S3. Conductor code & distances.
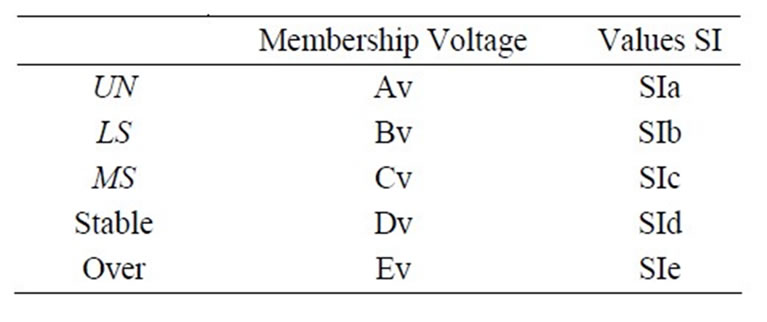
Table S4. Membership function representation.
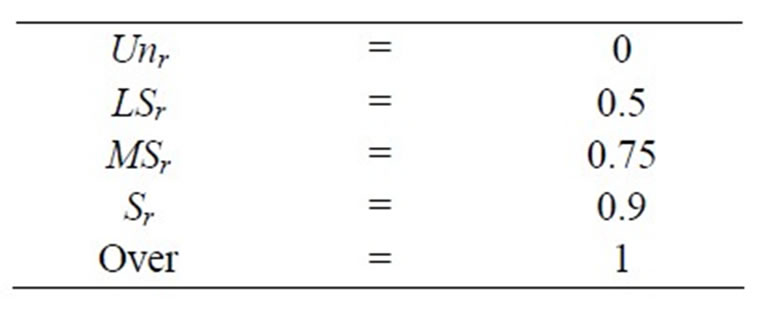
Table S5. Output range considered for vulnerability index calculation.