Energy and Power Engineering
Vol. 4 No. 3 (2012) , Article ID: 19015 , 7 pages DOI:10.4236/epe.2012.43017
Monthly and Seasonal Investigation of Wind Characteristics and Assessment of Wind Energy Potential in Al-Mokha, Yemen
Physics Department, Faculty of Applied Science, Taiz University, Taiz, Yemen
Email: albuhairi@hotmail.com
Received April 10, 2012; revised May 7, 2012; accepted May 19, 2012
Keywords: Al-Mokha; Yemen; Weibull Distribution; Wind Energy
ABSTRACT
The negative effects of fossil fuels have forced many countries to explore clean energy sources that are both environmentally more suitable and renewable. In this study, wind characteristics and assessment of wind energy potential, were analyzed using the wind speed data measured during the period 1995-2001 at 10 m height of Al-Mokha, located in the west of Taiz, in the southwest of Yemen, subjected to 2-parameter Weibull analysis. Based on these data, it was found that the monthly mean wind speed ranged from 3.50 m/s in June to 7.94 m/s in November, the monthly values of Weibull shape parameter (k), ranged from 3.09 to 6.26, while the value of scale parameter (c) ranged from 3.91 to 8.63 m/s and the monthly wind power density ranged from 33.08 to 352.43 W/m2. The seasonal mean wind speed data ranged from 3.61 to 7.56 m/s, while the wind power density was ranged from 36.62 to 328.59 W/m2 for summer and winter, respectively.
1. Introduction
Increasing negative effects of fossil fuels combustion on the environment in addition to its limited stock have forced many countries to explore and change to environmentally friendly alternatives that are renewable to sustain the increasing energy demand. Wind energy is an alternative clean energy source compared to fossil fuel, which pollutes the lower layer of the atmosphere. The use of wind energy can significantly reduce the combustion of fossil fuel and the consequent emission of carbon dioxide, a principal cause of the enhanced greenhouse effect [1,2]. Renewable energy has an increasing role in achieving the goals of sustainable development, energy security and environmental protection. Nowadays, it has been recognized as one of the most promising clean energy over the world because of its falling cost, while other renewable energy technologies are becoming more expensive [3]. Wind represents a promising renewable energy source that can meet energy demand in the direct, grid connected modes, as well in standalone and remote applications [4]. The application of wind energy in electric power systems is growing rapidly due to enhanced public concerns to adverse environmental impacts and escalation in energy costs associated with the use of conventional energy sources [4].
Wind has proved to be one of the most successful of all available sources of renewable energy offering relatively high capacities, with generation costs that are becoming competitive with conventional energy sources [5].
Currently, the wind energy is one of the fastest developing renewable energy source technologies across the globe. It has the advantage of being suitable to be used locally in rural and remote areas. Particularly, with a view on the rapid advancement of wind energy conversion technologies (WECTs) efficiency and falling purchasing prices over the past decade; further such improvements are widely anticipated [6,7].
The last decade was characterized by rough development of wind power engineering all over the world [8]. Wind energy systems have made a significant contribution to daily life in some developing countries. Wind power generation has known a remarkably rapid growth in the past 20 years, and now it is a mature, reliable and efficient technology for electricity production [9]. Since 1996, global wind power capacity has continued to grow at an annual cumulative rate close to 40%. Over the past decade, installations have roughly doubled every two and a half years. In the year 2010, the wind capacity reached worldwide 196,630 Megawatt, after 159,050 MW in 2009, 120,903 MW in 2008, and 93,930 MW in 2007. During 2010, 9918 MW of wind power was installed across Europe, with European Union countries accounting for 9295 MW of the total [10,11].
However, wind energy systems suffer from a major drawback since the wind resource is intermittent, hence, is not available all of the time to make turbines run continuously [12]. Therefore, wind energy systems are considered as energy-replacement rather than capacity-replacement resources. The amount of energy that can be supplied by one or more sites depends on the wind resource available, the type of wind turbines used, and the nature of the load being supplied. For these reasons, it is fundamental to study the reliability of these generation systems and to assess the effects that they will have on the entire system and on its reliability [13].
The renewable energy resources include solar, wind, geothermal and bio-energy. All these renewable energy resources are abundant in Yemen. If these resources are well established, they can provide complete security of energy supply. Yemen has to make use of its renewable resources, such as solar, wind and geothermal energy, not only to meet increasing demand, but also for environmental reasons. Average annual wind speeds measured at 10 m height exceed 8 m/s at most of the coastal sites. There is good potential for wind energy at sites on the coastal strip, in addition to the offshore area. There is also a great wind energy on Yemeni islands and inland hills and mountains [14,15].
Some studies have reported that the wind speed is relatively large at high altitudes and coastal areas [16]. Yemen has a unique geographic location. It has a long coastline and plenty of high altitudes. Due to all these characteristics, Yemen is a perfect place for generating energy from the wind. Energy that can be captured by wind mills is highly dependent on the local average wind speed. Regions that normally present the most attractive potential are located near coasts, island areas with open terrain or on the edge of water bodies.
Geographic Nature of Yemen has helped to generate daily wind with reasonable duration and speed. The well known phenomena of local wind patterns are clearly realized in Yemen Sea Breezes and Mountain-valley wind which are potential areas to develop wind energy. Further study for wind availability and daily wind speed is required to precisely assist wind generation economics [15, 17].
2. Study Area
Yemen, is a country located in the Middle East, in the southern part of the Arabian Peninsula between 13N - 16N latitude and 43.2 - 53.2 longitude at the south west of Asia [17,18]. It is bordered by Saudi Arabia to the north, the Red Sea to the west, Oman to the east and by Indian Ocean (Arab sea) from the south. Yemen has a land area of 555,000 square kilometers and a population of approximately 24 million as reported in 2010 [19]. The country consists of three major zones: coastal, rugged foothills and Mountains.
Yemen has a long coastal strip of over 2500 kms with a width of 30 - 60 kms along the Red Sea, Gulf of Aden, and the Arabian Sea. Al-Mokha is one of the Yemen cities, it is a port city on the Red Sea coast, which is located in 94 Km to the west of Taiz, south west of Yemen. The geographical location Al-Mokha is shown in Figure 1.
The climate in Yemen is various and depends on the different altitudes of the regions. There are no distinctive limits between the seasons. Generally there are two main seasons; summer and winter. During summer the climate is hot with high humidity dominating in the coastal area. In winter the climate in the coastal area is relatively moderate [20].
Yemen Public Electricity Corporation (PEC), is responsible for electricity generation, transmission and distribution through several grids. The government-run power company, (PEC), currently produces and distributes roughly 1000 MegaWatts from a handful of steam and diesel plants, a network of smaller plants, and rented generators. Its current production falls 200 MegaWatts short of the national grid’s 1200 MegaWatts demand. The proportion of the population of beneficiaries of electric power (via the Public Electricity Corporation) is approximately 49% [21], this condition is a good indicator to propose wind farms combined with PV system or connected to the grid. For the last five years, the Ministry of Electricity (ME) has shown significant interest to use renewable energy sources for rural electrification. This can be seen from projects and cooperation agreements done for that period.
3. Materials and Methods
In this study the wind speed data have been collected during seven years (1995-2001) for investigated location
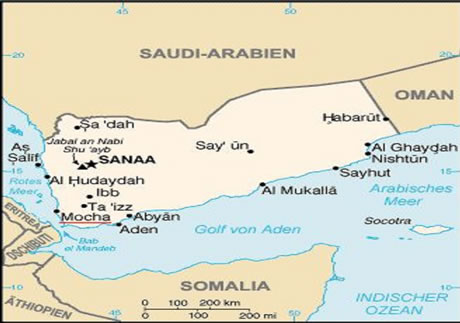
Figure 1. Location of Al-Mokha (Mocha) measurement station.
from the Yemen Meteorological department. Continuous 3 h daily readings over the period considered were used and subjected to various statistical analyses. The data were recorded continuously using cup-generator anemometer at a height of 10 m and presented graphically in Figure 2. The figure gives the monthly mean wind speed of the location for the seven years.
3.1. Probability Density Functions
The computation of the wind speed probability distribution functions (PDFs) constitutes the first fundamental step to assess the wind energy potential, since it can effectively determine the performance of wind energy systems for a given location and time [22]. Several PDF have been proposed in the literature to represent the frequencies of the wind speed [3,22]. However, the Weibull Probability Density Function with its two characteristic parameters (c scale parameter and k shape parameter) has been found to be the accurate and adequate in analyzing and interpreting the wind speed distribution and estimate wind energy potential. The general form of the Weibull PDF [23] is given by:
 (1)
(1)
where  is the probability of observing wind speed v, k is the dimensionless Weibull shape parameter, and c is the Weibull scale parameter (in units of speed) [24].
Higher values of k indicate sharper peaked curves while lower k means more flat or more evenly distributed speeds.
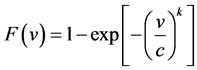
The corresponding cumulative probability function of the Weibull distribution [25] is given by the equation:
 (2)
(2)
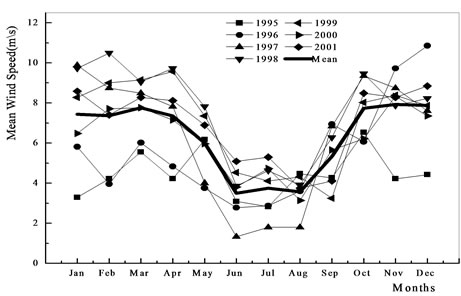
Figure 2. Monthly mean wind speed of Al Mokha from 1995 to 2001.
where F(v) is the cumulative distribution function of observing wind speed v.
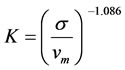
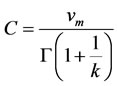
The two parameters of Weibull PDF, k and c can be related to the mean wind speed vm and standard deviation σ by [26]:
 (3)
(3)
 (4)
(4)
The mean value of the wind speed vm and standard deviation σ for the Weibull distribution as defined in terms of the Weibull parameters k and c are given as [27-29]:
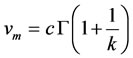 (5)
(5)
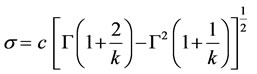 (6)
(6)
where Γ is the gamma function (standard formula) and using the Stirling approximation the gamma function of (x) can be given as follows:
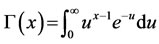 (7)
(7)
3.2. Wind Power Density Function
It is well known that the power of the wind that flows at speed (v) through a blade sweep area A, increases as the cube of its velocity is given by [30,31].
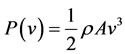 (8)
(8)
where ρ is the mean air density (1.225 kg/m3 at average atmospheric pressure at sea level and at 15˚C), which depends on altitude, air pressure, and temperature.
Wind power density, expressed in Watt per square meter (W/m2), takes into account the frequency distribution of the wind speed and dependence of wind power on air density and the cube of the wind speed. Therefore, wind power density is generally considered as a better indicator of the wind energy resource than wind speed.
In order to evaluate available wind resource at the location, it is required to calculate the wind power density. It shows how much energy is available at the location for conversion to electricity by a wind turbine. The expected monthly or annual wind power density per unit area of the location based on a Weibull probability density function can be expressed as following [2,31,32]:
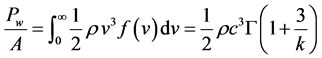 (9)
(9)
3.3. Wind Energy Density
The wind energy density for a desired duration, T, can be calculated as:
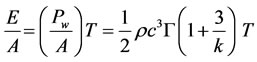 (10)
(10)
This equation can be used to calculate the available wind energy for any defined period of time when the wind speed frequency distributions are for a different period of time.
4. Results and Discussion
In this study, wind speed data of Al-Mokha, Yemen, over the seven years period from 1995 to 2001 were analyzed. The calculations were made to obtain the Weibull distribution parameters in terms of k and c, mean wind speed and measured and predicted mean wind power. The main results obtained from the present study can be summarized as follows:
4.1. Mean Wind Speed
The monthly variation of the mean monthly wind speed measurements were carried out at 10 m above the ground level. Monthly mean speed, Weibull parameters k and c, standard deviation and monthly wind power density are listed in Table 1. The monthly mean wind speeds for the investigated location are shown in Figure 2. As can be seen from this figure, the mean wind speed varies between 3.5 and 7.94 m/s. The maximum value of the mean wind speed is found in the month of November while the minimum value is found in the month of June.
Table 2 shows the seasonal mean wind speeds for the investigated location calculated for seven years period (1995-2001). It is observed that the maximum value of the mean wind speed is about 7.56 m/s, it was in winter season, while the minimum value is about 3.61 m/s it was in summer season. The Seasonal mean wind speed of Al-Mokha is presented in Figure 3.
4.2. Probability Density and Cumulative Distributions
The monthly probability density and cumulative distributions derived from the wind speed data of Al-Mokha, the results are presented in Figures 4 and 5, respectively. It is seen from the figures that all the curves have a similar tendency of wind speeds for the cumulative density and probability density. The Weibull parameters for the available data are calculated using Equations (3) and (4), the results are presented in Table 1. The results showed that the parameters are distinctive for different months of the period (1995-2001). This means that the monthly wind speed distribution differs over a whole period. The monthly values of c range from 3.91 to 8.63 m/s. The mi-

Table 1. Monthly variations of the mean wind speed (at 10 m height, in m/s), standard deviation, Weibull parameters and wind power density and energy at Al-Mokha from 1995 to 2001.

Table 2. Seasonal Weibull parameters and characteristic speeds (at 10 m height, in m/s) for the years studied of Al-Mokha.
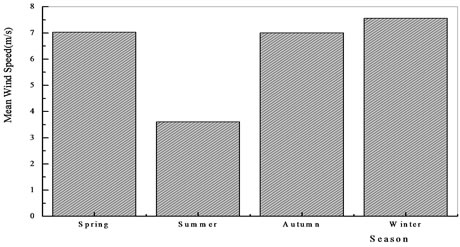
Figure 3. Seasonal mean wind speed of Al-Mokha (1995- 2001).
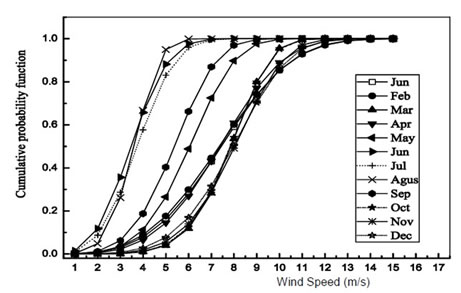
Figure 4. Monthly wind speed probability density distributions of Al-Mokha from 1995 to 2001.
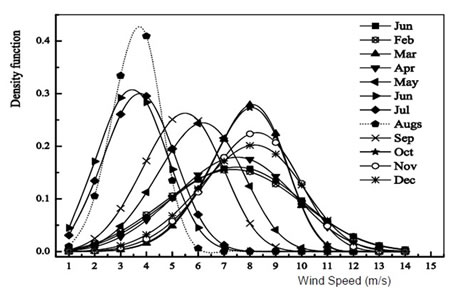
Figure 5. Monthly wind speed cumulative density functions of Al Mokha from 1995 to 2001.
nimum value of c is found in June and August, but the maximum value is found in both November and December, while the values of k range from 3.06 to 6.26. The minimum value of k is found in June, but the maximum value is found in March. Hence, with regards to the Weibull shape parameter k for the location, wind speed is most uniform in March while it is least uniform in June. The peak of the density function frequencies of the location skewed towards the higher values of the mean wind speed, which also indicate the most frequent velocity.
The seasonal probability density and cumulative distributions obtained from Weibull probability density functions for the investigated location are shown in Figures 6 and 7, respectively. The seasonal wind characteristics in Al-Mokha are given in Table 2. As seen from this table, the highest mean wind speed value with 7.56 m/s is determined in the winter season, while the lowest value is noticed in the summer season with 3.61 m/s. The Weibull shape parameter k varies between 3.65 and 4.32. While the scale parameter c varies between 4.00 to 8.36 m/s. The maximum c value is found in the winter season and the minimum value is seen in the summer season.
4.3. Wind Power Density
The monthly power densities calculated from the measured probability density distributions and those obtained from the Weibull distributions are shown in Figure 8. The monthly variation of the mean power density for the location shows the dramatic monthly changes in the wind power density. It is clear that the maximum value 352.43 W/m2 in December, while the minimum value 33.08 W/m2 occurred in August. The obtained results are reported in details in Table 1.
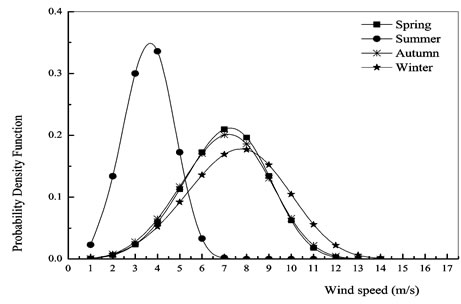
Figure 6. seasonal Weibull probability distributions of AlMokha from 1995 to 2001.
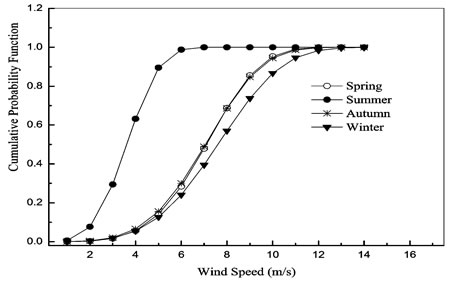
Figure 7. Seasonal cumulative of Al-Mokha from 1995 to 2001.
In addition, the seasonal variation of the mean wind power density for the investigation location is presented in Figure 9, and is also summarized in Table 2. It is observed that the highest value of the mean wind power Density is 328.59 W/m2 is observed in winter season while the lowest value 36.62 W/m2 is found in the summer season. The seasonal wind power energy density was evaluated, by “Equation (10)” and shown in Table 2. It is clear that the highest value of wind power energy 709.75 kWh/m2/Season is observed in winter while, the lowest value 79.1 kWh/m2/Season is found in summer.
5. Conclusions
In this study, the wind speed data in the period from 1995 to 2001 for Al-Mokha is located to the west of Taiz in southwest Yemen, were statistically analyzed. The probability density distributions were derived and the distributional parameters were identified. The wind energy potential of the location has been studied based on the Weibull model. The most important outcomes of the study can be concluded as follows:
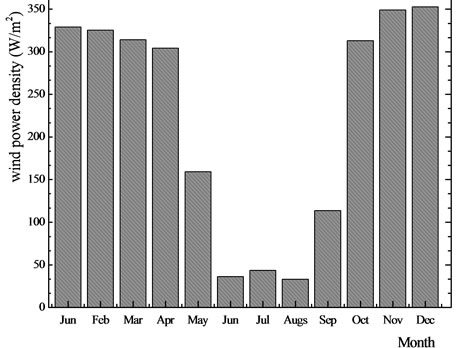
Figure 8. Monthly wind power density of Al Mokha from 1995 to 2001.
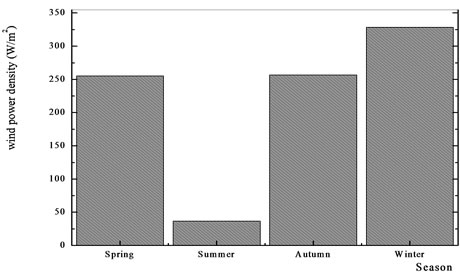
Figure 9. Seasonal wind power density of Al Mokha from 1995 to 2001.
1) The monthly and seasonal wind data analysis has been carried out to investigate the wind characteristics of Al-Mokha, such as the monthly and seasonal wind speed, probability density distributions, cumulative distributions and power density distributions in order to provide information of wind resources, and further assessment of the monthly and seasonal wind energy available in the location.
2) The monthly value of Weibull parameters k and c in the site varies between 3.09 and 6.26, 3.91 and 8.63 m/s, respectively.
3) The highest monthly mean power density of 352.43 W/m2 is calculated in December, while the lowest is found in the months of summer with the minimum value of 33.08 W/m2 in August and the highest seasonal mean power density is obtained as 328.59 W/m2 in the winter, while the lowest value is calculated as 36.62 W/m2 in the summer for the location.
4) The current study presents an investigated study of estimation wind energy potential in Al-Mokha as a representation region the Red Sea coast of Yemen. The results indicate that the investigated location has a good wind energy potential for the utilization.
5) This study may provide information for developing wind energy in Al-Mokha, Red Sea coast of Yemen and for planning economical wind turbines capacity for the electricity production in the region.
REFERENCES
- D. A Weisser, “A Wind Energy Analysis of Grenada: An Estimation Using the ‘Weibull’ Density Function,” Renewable Energy, Vol. 28, No. 11, 2003, pp. 1803-1812. doi:10.1016/S0960-1481(03)00016-8
- M. H. Albuhair, “A statistical analysis of Wind Speed Data and an assessment of Wind Energy Potential in Taiz-Yemen,” Assiut University Bulletin for Enverinmental Researches, Vol. 9, No. 2, 2006, pp. 21-33.
- E. K. Akpinar and S. Akpinar, “An assessment on seasonal analysis of Wind Energy Characteristics and Wind Characteristics,” Energy Conversion and Management, Vol. 46, No. 11-12, 2005, pp. 1848-1867. doi:10.1016/j.enconman.2004.08.012
- M. C. Mabel and E. Fernandez, “Growth and Future Trends of Wind Energy in India,” Renewable and Sustainable Energy Reviews, Vol. 12, No. 6, 2008, pp. 1745- 1757. doi:10.1016/j.rser.2007.01.016
- A. Dimitrovski and K. Tomsovic, “Impact of Wind Generation Uncertainty on Generating Capacity Adequacy,” 9th International Conference on Probabilistic Methods Applied to Power Systems, Stockholm, 11-15 June 2006, pp. 1-6.
- A. McDonald and L. Schrattenholzer, “Learning rates for Energy Technologies,” Energy Policy, Vol. 29, No. 4, 2001, pp. 255-261. doi:10.1016/S0301-4215(00)00122-1
- W. Turkenburg, “Renewable Energy Technologies,” In: J. Goldemberg, ed., World Energy Assessment: Energy and the challenge of sustainability an overview, United Nations Development Programme, New York, 2000, pp. 219- 272.
- A. Thomas and S. Lennart, “An overview of Wind Energy Status,” Renew Sustain Energy Review, Vol. 6, No. 1-2, 2002, pp. 67-128. doi:10.1016/S1364-0321(02)00008-4
- I. Fyrippis, J. P. Axaopoulos and G. Panayiotou, “Wind Energy Potential Assessment in Naxos Island Greece,” Applied Energy, Vol. 87, No. 2, 2010, pp. 577-586. doi:10.1016/j.apenergy.2009.05.031
- World Wind Energy Report, “Report World Wind Energy Association (WWEA),” WWEA, Bonn, 2011.
- The European Wind energy association, “Wind in power 2010 European statistics,” EWEA, Brussels, 2011.
- J. Wen, Y. Zheng and F. Donghan, “A review on reliability assessment for Wind Power,” Renewable and Sustainable Energy Reviews, Vol. 13, No. 9, 2009, pp. 2485- 2494. doi:10.1016/j.rser.2009.06.006
- A. P. Leite and C. L. T. Borges, “Probability Wind Farms Generation Model for Reliability Studies Applied to Brazilian sites,” IEEE Transactions on Power Systems, Vol. 21, No. 4, 2006, pp. 1493-1501. doi:10.1109/TPWRS.2006.881160
- M. H. Albuhairi, “Assessment and analysis of wind Power Density in Taiz-Republic of Yemen,” Assiut University Bulletin for Enverinmental Researches, Vol. 9, No. 2, 2006, pp. 13-21.
- Ministry of Water & Environment and Ministry of Electricity, Yemen Energy and Renewable Profile, “Renewable Energy Potentials and Applications in Yemen,” Middle East & North Africa Renewable Energy Conference, Sana’a, 21-22 April, 2004, pp. 1-10.
- A. H. Algifri, “Wind Energy Potential in Aden-Yemen,” Renewable Energy, Vol. 13, No. 2, 1998, pp. 255-260. doi:10.1016/S0960-1481(97)00069-4
- M. Ali Al-Ashwal, “All Renewable Energy Applications in Yemen are Best Practice,” ISESCO Science and Technology Vision, Vol. 1, 2005, pp. 45-50.
- maps of world, “Yemen Latitude and Longitude Map,” http://www.mapsofworld.com/lat_long/yemen-lat-long.html
- Countries of the World, “Yemen People,” http://www.theodora.com/wfbcurrent/yemen/yemen_people.html
- M. H. Albuhairi, “Analysis of Monthly, Seasonal and Annual Air Temperature Variability and Trends in Taiz City-Republic of Yemen,” Journal of Environmental Protection, 2010, Vol. 1, No. 4, 2010, pp. 401-409.
- Yemen Ministry of Electricity and Energy & Public Electricity Corporation. http://www.pecye.net/en/index.php?mod=contents&do=items&cid=75
- J. A. Carta, P. Ramırez and S. A. Velazque, “review of Wind Speed Probability Distributions Used in Wind Energy analysis. Case studies in the Canary Islands,” Renewable and Sustainable Energy Reviews, Vol. 13, No. 5, 2009, pp. 933-955. doi:10.1016/j.rser.2008.05.005
- A. N. Celik, “On the Distributional Parameters Used in assessment of the suitability of Wind Speed Probability Density Functions,” Energy Conversion and Management, Vol. 45, No. 11-12, 2004, pp. 1735-1747. doi:10.1016/j.enconman.2003.09.027
- P. Ramirez and J. A. Carta, “Influence of the Data Sampling Interval in the estimation of the parameters of the Weibull Wind Speed Probability Density Distribution: A Case Study,” Energy Conversion and Management, Vol. 46, No. 15-16, 2005, pp. 2419-2438. doi:10.1016/j.enconman.2004.11.004
- A. S. A. Shata and R. Hanitsch, “Evaluation of wind Energy Potential and Electricity Generation on the coast of Mediterranean Sea in Egypt,” Renewable Energy, Vol. 31, No. 8, 2006, pp. 1183-1202. doi:10.1016/j.renene.2005.06.015
- I. A. Perez, M. A. Garcıa, M. L. Sanchez and B. de Torre, “Analysis of Height Variations of Sodar-Derived Wind Speeds in Northern Spain,” Journal of Wind Engineering and Industrial Aerodynamics, Vol. 92, No. 10, 2004, pp. 875-894. doi:10.1016/j.jweia.2004.05.002
- R. O. Fagbenle, J. Katende, O. O. Ajayi and J. O. Okeniyi, “Assessment of Wind Energy Potential of Two Sites in North-East, Nigeria,” Renewable Energy, Vol. 36, No. 4, 2011, pp. 1277-1283. doi:10.1016/j.renene.2010.10.003
- J. V. Seguro and T. W. Lambert, “Modern estimation of the parameters of the Weibull Wind Speed Distribution for Wind Energy Analysis,” Journal of Wind Engineering and Industrial Aerodynamics, Vol. 85, No. 1, 2000, pp. 75-84. doi:10.1016/S0167-6105(99)00122-1
- L. Lu, H. Yang and J. Burnett, “Investigation on Wind Power Potential on Hong Kong islands an analysis of Wind Power and wind Turbine Characteristics,” Renewable Energy, Vol. 27, No. 1, 2002, pp. 1-12. doi:10.1016/S0960-1481(01)00164-1
- M. Li and X. Li, “MEP-Type Distribution Function: A Better Alternative to Weibull function for Wind Speed Distributions,” Renewable Energy, Vol. 30, No. 8, 2005, pp. 1221-1240. doi:10.1016/j.renene.2004.10.003
- A. Ucar and F. Balo, “Assessment of Wind Power Potential for Turbine Installation in Coastal Areas of Turkey,” Renewable and Sustainable Energy Reviews, Vol. 14, No. 7, 2010, pp. 1901-1912. doi:10.1016/j.rser.2010.03.021
- M. Mirhosseini, et al., “Assessing the Wind Energy Potential Locations in province of Semnan in Iran,” Renewable and Sustainable Energy Reviews, Vol. 15, No. 1, 2011, pp. 449-459. doi:10.1016/j.rser.2010.09.029