Green and Sustainable Chemistry
Vol.06 No.03(2016), Article ID:69912,7 pages
10.4236/gsc.2016.63014
Engaging Freshman Undergraduate Students in Faculty Environmental Science Research: Testing the Local Surface Waters for Nitrate, Phosphate, and Ammonium Ions Using Two Affordable Methods as an Example
Shadi Abu-Baker*, Christian Frazier, Nathaniel Frazier, Shahrokh Ghaffari
College of Arts and Sciences, Ohio University Zanesville, Zanesville, OH, USA

Copyright © 2016 by authors and Scientific Research Publishing Inc.
This work is licensed under the Creative Commons Attribution International License (CC BY).
http://creativecommons.org/licenses/by/4.0/


Received 2 April 2016; accepted 19 August 2016; published 22 August 2016
ABSTRACT
Clean water is a crucial factor that contributes to the health of eco-systems and their inhabitants. Testing local surface water is an exciting way to engage freshman undergraduates in research which shows them the importance of protecting their communities and environment. Two affordable methods: a Colorimeter and Ion-Selective Probe were used to analyze nitrate, phosphate and ammonia levels in local surface water samples. The samples were collected from the Muskingum River which runs through Southeastern Ohio (Muskingum County) and were collected at 2 mile increments. We believe that this set of experiments would be beneficial if implemented into a college freshman level chemistry lab, thereby, promoting self-awareness of water safety, eco-system safety and community involvement. In addition, the students will learn how our environment is effected by our actions when we neglect to properly monitor the type of pollutants we allow into our water ways.
Keywords:
Nitrate, South Eastern Ohio, Affordable, Muskingum, Phosphate, Ammonia, Environmental Monitoring, River Water, Toxicity, Vernier Electrode, PASCO Colorimeter

1. Introduction
Testing surface water brings chemistry and environmental biology together by teaching students the impact humans have on their environment. Such practices as the use of industrial fertilizers on farm lands, and dumping of waste materials from fracking, when in large quantities, can be harmful to both the environment and to the species which thrive in these eco-systems. The need for our water systems to be routinely checked and monitored is ever growing and should be of up most importance. Southeastern Ohio’s Surface water which includes rivers, streams, and ponds are often subjected to minerals from the ground like calcium, sodium and potassium. Surface waters can also be subjected to gases from the air like nitrogen oxide, carbon dioxide and sulfur dioxides. Nitrate, ammonium and phosphate ions are typically found in commercial fertilizers and enter surface waters (see Table 1) through run off rain systems, and the melting of snow during early summer months [1] .
These ions, for the most part, are natural components of the environment, however, each of these can become a concern and even dangerous when spring runoff occurs. Most of the danger comes from fertilized farm fields which line waterways connect directly to filtration facilities used for the purification of everyday drinking water. Water plants often support large populations, thereby allowing pollutants to affect a larger percentile of the nearby population. Elevated nitrates have been linked to spleen damage in adults as well as blue baby syndrome (methemoglubinemia-tissue hypoxia in babies caused by a shift in the oxygen-Hemoglobin dissociation curve) and even death in severe cases [2] . Nitrates are also a contributor in the production of algal blooms, which reduces the oxygen content in tributaries and sub-streams, in effect, leading to the death of marine life [3] , which inevitably leads to an effect on the entire eco-system. By being involved in the testing of these ions, college students of all backgrounds and disciplines can reap the benefit of understanding their environment on a new level. This includes future healthcare workers who can grasp a better understanding of environmental factors, science majors who can learn how to properly care out experimentation and social science majors who may advocate for positions related to environmental policies in our government and private sectors. Students from all academic disciplines can benefit from the hands-on experiences gained through the addition of practical and applied research in the undergraduate classroom.
2. Methods
The first method we utilized for our research was the Ion-Selective Electrode [4] (see Figure 1).
All the technical tips that were followed in this paper are included with the purchase of the electrodes from the manufacturer and are available on their website [4] . This method requires a specific Ion- Selective Electrode probe, Logger Pro program, and the data-collecting device (LabQuest2) (see Figure 2).
The Ion selective electrode that goes with the data collecting device was purchased from Vernier and uses a sold polymer membrane technology to measure the nitrate and ammonia concentrations in the collected water sample. The probes sold be Vernier are combination style electrodes, meaning that the voltage develops in relation to an Ag/AgCl internal electrode. Once the equipment is received, before testing begins, the probe requires

Table 1. Nitrate concentration in selected sites [1] .
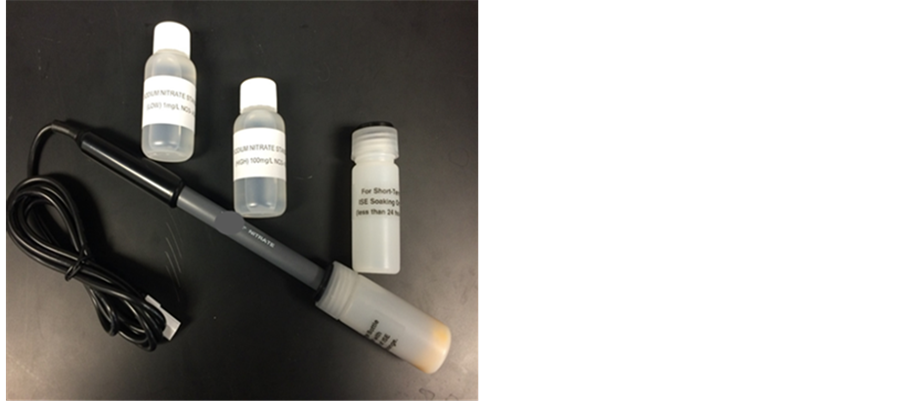
Figure 1. A picture taken by the students of the commercially available ion-selective electrode kit.
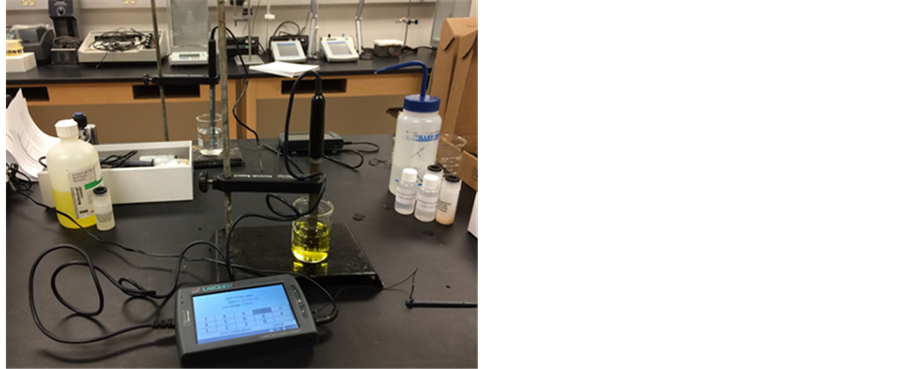
Figure 2. A picture taken by the students of the ion-selective electrode set-up connected to the commercially available data collecting device.
that a low and high standard is used to calibrate the tool. Once calibration is complete, the water sample must hold enough solution that the probe can be properly submerged. According to Vernier this depth should not be shallower that 1.1 inches. The calculation, by which the computer program finds the concentration of ions, in the sample, is the Nernst Equation. Specifically, the equation for this test is written as E = E0 + m (ln a), where E is the measured voltage, E0 is the standard potential for the combination of the two half cells, m is the slope, ln is the natural logarithm, and a is the activity of the measured ion species. The response by the ISE produces a linear equation that is produced on a graph in the Logger Pro software where results can be seen and recorded. Over all, this method has a reproducibility rate of ±10% when calibrated 10 to 1000 mg/L. The Ion-Selective Electrodes from Vernier costs $179.00 to $189.00, LabQuest2 for $329.00, and lastly Logger Pro for $249.00. Additionally, the Logger Pro software that is needed to analyze the data was purchased from the same company.
The second method we explored was the Water Quality Colorimeter and Kit [5] . All the technical tips that were followed in this paper are included with the kit by the manufacturer and online [5] . This method requires the colorimeter sensor (Figure 3), the PASPORT interface, The PASCO Capstone program, and the ezSample Snap Vial Water quality test kits, all of which are available for purchase at the PASCO online store. Each kit corresponds to its own ion such as Nitrate or Phosphate; therefore, each has its own set of procedures which
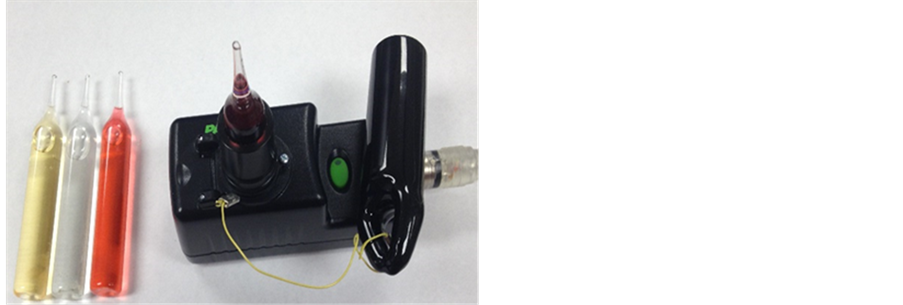
Figure 3. A picture taken by the students of the ion-selective electrode set-up connected to the commercially available data collecting device.
must be followed. In each kit, however, you will receive procedural instructions, 30 ampoules, and an indicator solution. After completing the snap vial test kit, each ampoule proceeds to be inserted into the colorimeter where Beer’s Law is used to calculate the ion concentration.
Beer’s law measures the concentration of the sample by finding the absorbance of light waves that are projected threw your sample, after the ion indicator is added. The common way to present Beer’s equation is written as A = εbc, where A is absorbance; ε is the molar absorptivity; b is the path length of the sample; and c is the concentration of the compound in the solution. In this case, nitrate, ammonia, and phosphate were the ions being sampled. The more saturated the color becomes, the higher the ion concentration in the sample. This Colorimeter utilizes Beer’s Law as well as built in calibration curves to accurately calculate the ion concentration in each solution. The concentrations are then presented on a graph for analysis. The colorimeter sensor (Figure 3) must be connected to a laptop to process and analyze the data. Since, the Capstone program is recommended for data gathering while using this device we strongly urge the use of this program due to its accuracy, ±0.5% Transmittance. The colorimeter and the ezSample® snap vial water quality test kit can be purchased for $299.00 and the PASCO Capstone Data analysis program for $99.00.
3. Results and Discussion
The primary purpose of this research is to provide two affordable methods that both students and the general public alike can implement; thereby, allowing us as a community to understand the environmental footprint we all leave on our environment. What is unique about this research is that we studied two methods that are not restricted to a lab setting. The ISE probe and Colorimeter are both examples of instruments that can be utilized at home or in the field; thereby, allowing the average day citizen to conduct his or her own experiments at an affordable price. In addition, to the affordability, having the public and commercial businesses aware of what is in their water supply will promote healthier living. The research has attracted attention from The Times Recorder [6] , which is the local newspaper, and the Ohio University newsletter, Compass [7] . In addition, our work has been presented at the Student Expo in Athens, Ohio, and at the Association for University Regional Campuses of Ohio Conference. The research also made an appearance on WOUB Public Media [8] . Implementing research such as this into the classroom as a lab exercise will allow for a better understanding of health and environmental factors which affect our day to day lives. Problems such as the resent nitrate emergency in Columbus, Ohio and the current Colorado EPA mining spill [9] are two perfect examples of why water testing is fundamentally important for residential areas. These methods would allow for residents to test their own water supplies. Those impacted by the EPA spill are concerned about excessive concentrations of heavy metals in the Animas River. In high concentrations, heavy metals such as nickel and iron are major health risks that can lead to many ailments. Testing for these contaminants is done by using similar methods as those done in this project. Due to the fact, that most housing in the area receives its water from individual wells; a testing instrument that is mobile and reliable would be a tremendous benefit for the effected residents. In the educational setting, students can be given the freedom to select their own collection site to further enhance both service and interest in the project. High contamination levels at any of those sites will be shared with authorities so that environmental or health concerns can be addressed appropriately. Students of Ohio University Zanesville picked to investigate the contamination of Southeastern Ohio’s surface waters with ions like nitrate, phosphate, and ammonia which have been a major health and environmental concern for several decades [10] . To gather data for research and educational purposes, the students applied the two affordable commercially available methods discussed above and followed the manufacturer protocols. Their results are summarized in Table 2 and Table 3 provided in this paper.
The water samples were taken at 2 mile increments from the Muskingum River and were collected in November 2014 (see Figure 4). The segment of river that was tested ends at Zanesville, and runs south for approximately twenty miles. The two different methods used have their benefits; however, there are definite differences in each product; such as Vernier does not produce a phosphate electrode but is compatible with LabQuest2 handhelds, whereas PASCO’s colorimeter does have a kit for phosphate. After running our samples we compared our results to those found by the State of Ohio Environmental Protection Agency in 2006 [11] .
Table 2. The ion-selective electrode method results.
*Maximum Contaminant Level (MCL) = 10 milligrams per Liter (mg/L) or 10 parts per million (ppm) (Environmental Protection Agency). **Maximum Contaminant Level for Drinking Water (MCLDW) = 0.5 milligrams per Liter (mg/L) (Water Quality with Vernier). ***Reproduction consistence ±10%.
Table 3. The Colorimeter Method results*.
*±10% error at 2.25 ppm ± 20% error at 0.75 ppm ± 30% error at 0.20 ppm; **Results found using PASCO software and method.
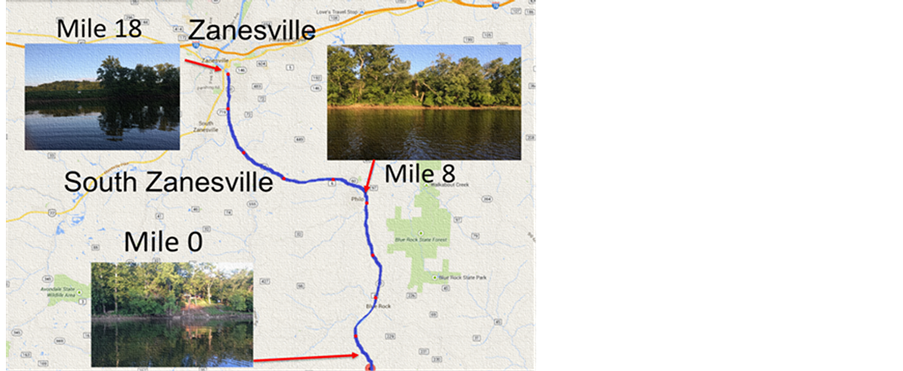
Figure 4. A map of southeastern Ohio. The 20 miles segment of the Muskingum River which was test is highlighted in blue. Selected pictures of certain miles are shown using the red markers.
The results we calculated from both methods were within the range of the EPA results. This indicates that the river segment that we tested has not been exposed to high concentration of nitrate, phosphate and ammonia at the time and season of testing. One of the goals of this research was to train students to operate the pre-stated methods for testing water quality. These methods are inexpensive and simple enough that freshman college students can benefit from the experimental learning of being involved in this kind of research, data collection, and analysis. Also, by having two methods, this enhances the student’s learning experience by adding a dynamic of interpreting results. Having to weigh the pros and cons between the tests and further distinguish which is more reliable, adds a feature which is designed to build critical thinking skills. Furthermore, by introducing students to the idea that water testing is not an intimidating or complex process, they will be positioned to become better informed of the important need to care for their environment. As more people become aware and learn how to read waterways for contaminants, and carry out studies of their own, the impact on Ohio’s waterways and ecosystems will be observed.
4. Conclusion
To conclude, the research presented above shows educational, health, and community benefits, all produced by the implementation of two methods for testing water quality. What is most noticeable about this research is that these methods are affordable, user friendly, and most importantly, not confined to a laboratory. The two affordable methods we discussed above allow for the testing of surface water either at home or by the river side, and only require a basic freshman level chemistry background to fully grasp all the concepts [7] . These experimental procedures promote knowledge of how and why we should care for the environment we live in. Both environmental and health risks are associated with abnormally high concentrations of nitrate, phosphate and ammonia ions. In addition to these, heavy metals seen in the Colorado EPA river contamination also hold major health and environmental concerns [9] . Often nitrate, phosphate and ammonia levels are seen in early spring months due to water runoff occurring in nearby agricultural fields or construction sites. High concentrations are most often seen in water ways which border agricultural lands that use commercial grade fertilizer which contributes the most to these measurements. We concluded that both methods would be suitable and highly recommended for educational use in colleges and universities. Freshman level chemistry or biology lab curriculums would be the most appropriate setting for this kind of experimental research. We hope this will expand to other colleges, and thereby raise awareness of water quality and other important environmental problems being seen in today’s world.
Acknowledgements
We would like to thank students Bryce Hina and Trevor Reed for their help collecting the water samples. In addition, we wish to thank Ohio University for their financial support (1804 grant to Shadi Abu-Baker), and for providing all necessary equipment to carry out this research. The undergraduates wish to thank their mentors Dr. Shadi Abu-Baker and Dr. Shahrokh Ghaffari for their help planning and processing the data. We would like to thank Dr. Hannah Nissen, the Academic Division Coordinator at Ohio University-Zanesville for her generous financial support to undergraduate research.
Cite this paper
Shadi Abu-Baker,Christian Frazier,Nathaniel Frazier,Shahrokh Ghaffari, (2016) Engaging Freshman Undergraduate Students in Faculty Environmental Science Research: Testing the Local Surface Waters for Nitrate, Phosphate, and Ammonium Ions Using Two Affordable Methods as an Example. Green and Sustainable Chemistry,06,143-149. doi: 10.4236/gsc.2016.63014
References
- 1. Vernier Nitrate Lab Guide.
http://www2.vernier.com/sample_labs/WQV-08-COMP-nitrate.pdf - 2. (2006) Biological and Water Quality Study of the Muskingum River. Ohio Environmental Protection Agency.
http://epa.ohio.gov/portals/35/documents/MuskingumTSD2007.pdf - 3. Stream Team Volunteer Water Quality Monitoring Member Manual, Friends of Lower Muskingum River.
http://www.muskingumriver.org/pdf%20files/Stream%20Team%20Member%20Manual.pdf - 4. (2015) Pollution Flowing Faster than Facts in EPA Spill. CNN, 10 August.
http://www.cnn.com/2015/08/10/us/colorado-epa-mine-river-spill/ - 5. (2015) Ohio University Student Research and Creative Activity Expo. WOUB Public Media.
https://www.youtube.com/watch?v=EiGNxJa4kbM - 6. (2015) Zanesville Students Realize Benefits of Research Firsthand. Ohio University Compass, Christine Shaw, 10 July.
https://www.ohio.edu/compass/stories/15-16/07/Zanesville-Abu-Baker-Nitrate-Research.cfm - 7. (2015) OUZ Students Study Muskingum River Water Quality. Times Recorder, Bradley Parks, 2 July.
http://www.zanesvilletimesrecorder.com/story/news/local/2015/07/02/ouz-students-study-muskingum-river-water-quality/29640509/ - 8. PASCO Product Catalog/Water Quality Starter Kit.
http://www.pasco.com/prodCatalog/PS/PS-2610_ezsample-water-quality-starter-kit/ - 9. Vernier Products/Sensors Web Page.
http://www.vernier.com/products/sensors/ion-selective-electrodes/ - 10. (2012) EPA Summaries of Water Pollution Reporting Categories.
http://www.epa.gov/teach/chem_summ/Nitrates_summary.pdf - 11. Environmental Protection Agency Nitrate Summary 2012.
http://www.epa.gov/waters/ir/34PARENTATTAINSDESCRIPTIONS.pdf
NOTES

*Corresponding author.