Green and Sustainable Chemistry
Vol.3 No.4(2013), Article ID:39875,17 pages DOI:10.4236/gsc.2013.34018
Characterization of Some Jordanian Crude and Exhausted Olive Pomace Samples
Department of Chemistry, Yarmouk University, Irbid, Jordan
Email: *khalidtawarah@hotmail.com
Copyright © 2013 Khalid M. Tawarah, Rajaa A. Rababah. This is an open access article distributed under the Creative Commons Attribution License, which permits unrestricted use, distribution, and reproduction in any medium, provided the original work is properly cited.
Received August 15, 2013; revised September 15, 2013; accepted September 22, 2013
Keywords: Olive Pomace; Heat of Combustion; Thermogravimetric Analysis; Ultimate Analysis; Proximate Analysis; Ash; Pyrolysis
ABSTRACT
In an attempt to provide a set of specifications for the use and trade of the olive pomace in Jordan, several samples of the crude and laboratory-prepared exhausted (oil-free) olive pomace have been subjected to a thorough thermochemical characterization. Such characterization included determination of fat content by using n-hexane and Soxhlet extractor, ultimate and proximate analyses obtained by using an elemental analyzer and a thermogravimetric procedure, respectively, gross and net calorific values obtained by using adiabatic oxygen bomb calorimetry, mineral content (ash), and analysis of the pyrolysis thermograms in terms of specified temperatures and residual masses associated with such temperatures as obtained under an inert atmosphere of nitrogen gas at a flow rate of 100 ml per min and a heating rate of 20˚C per min from room temperature up to 600˚C. The properties of both the crude and the exhausted olive pomace were compared. The gross calorific values and the results of the ultimate analyses for the two pomace types were found to correlate very well as indicated by the use of a literature correlation formula usually used for estimating the gross calorific value of a fuel when its ultimate analysis is known. Other literature correlation formulas used for estimating the gross calorific value from the proximate analysis data were also used to check the adequacy of our procedure for getting the proximate analysis from the thermogravimetric pyrolysis thermograms.
1. Introduction
Jordan is one of the countries of the Mediterranean basin that are considered the home land of the olive tree. The olive oil plays an important role in the nutritional needs of the people of these countries. The olive oil and the pickled olives are nearly part of everyday meal in Jordan. There are about 11.5 million olive trees in Jordan [1]. The average annual olive fruit production in Jordan in the period 2000-2008 is about 170 thousand tons [2]. An average of about 83% of this amount goes for olive oil production and the rest is mainly used for table olive [2]. There are about 130 olive mills in Jordan; most of them are three-phase centrifugal mills [2]. The native name of the solid by-product of the olive mill is Jift; however olive pomace and olive cake are commonly used in the literature to denote this solid by-product. The major components of the olive pomace are the crushed pits, pulp, and skin of the olive fruit while minor components include minerals and some unrecovered olive oil.
The available statistics [2] covering the 2000-2008 olive harvest seasons in Jordan indicate that the annual average production of sun-dried olive pomace is about 35 thousand tons. Nowadays this amount is expected to be substantially higher than this figure because of the growing interest in planting olive trees in Jordan.
Until very recently, only a limited amount of olive pomace was used for space heating in little towns and villages throughout the country and the rest was disposed randomly. Consequently, the improper disposal of olive pomace was a serious environmental issue in Jordan because of its negative effects on soil and ground water. Nowadays, the olive pomace, with a calorific value of about 23 kJ/g [3,4], is becoming a valuable renewable energy source and an affordable substitute for liquid fuels usually used in domestic space heating. This shift from traditional liquid fuels (kerosene and diesel) to the renewable solid olive pomace fuel is mainly due to the high prices of liquid fuels. About ten years ago, the prices of liquid fuels were nearly 25% of the current prices (current prices are about $1.0 per liter as of November, 2012) and at that time few people were interested in using olive pomace as a source of energy. Likewise, the prices of olive pomace increased by a factor of 4 over the same period of time because of the heavy demand on the use of olive pomace for space heating especially in central and northern parts of Jordan. In the winter of 2012, the price of olive pomace reached 120 JD per ton (about $170). In addition to using olive pomace for space heating, there are other reported potential uses of olive pomace such as fertilizer compost [5], animal fodder [6], source for the manufacture of activated carbon [7], source of bio-pesticides [8], co-firing with coal in power stations [9], source of olive pomace oil for soap industry [10], and biosorbent for handling liquid waste [11,12].
The common types of olive pomace are the crude olive pomace which retains a certain amount of residual oil after olive pressing and the exhausted olive pomace which might have insignificant amount of residual oil. The exhausted olive pomace is usually obtained from crude olive pomace by a solvent extraction process that removes most of its residual oil content. The crude olive pomace is the most common type in Jordan. The main reason for converting the crude olive pomace into the exhausted form is to separate its residual olive oil where it can be used in soap manufacturing [10] and other value-added applications. The residual olive oil in the crude olive pomace is usually extracted by subjecting the olive pomace to mechanical pressing (mechanical method) or to extraction by a low-boiling, non-polar solvent, such as hexane (extraction method) [13]. Solvent extraction is basically a process of diffusion of a solvent into the oil-bearing cells of the raw material resulting in a solution of the oil in solvent [13].
The relevant literature information concerning olive pomace in Jordan has focused on its combustion for energy production [14], combustion performance of diesel fuel and olive pomace slurry [15], an energy source and catalyst for oil shale production of energy [16], physical durability and stability of olive pomace briquettes [17], direct combustion of olive pomace using fluidized bed combustor [18], thermochemical characterization of Jordanian olive pomace [3], and description of the burning behaviour of olive pomace briquettes [4].
The lack of an official set of specifications concerning the use and trade of olive pomace in Jordan as a solid biomass fuel has motivated us to conduct the present study. The major components of the specification of a solid fuel are the listing of the percentages of carbon, hydrogen, nitrogen, sulfur, ash, moisture, as well as the gross calorific value (GCV) and the net calorific value (NCV). In addition to these essential aspects of the present study, we have included data on the pyrolysis of olive pomace as obtained from analysis of the thermogravimetric (TG) curves recorded under inert atmosphere and covering a temperature range from room temperature up to 600˚C.
2. Description of Samples and Experimental Procedures
Six olive pomace samples with initial total wet mass of about 25 Kg that belong to the olive harvest seasons of 2009, 2010, and 2011 were considered in the present study. A brief description of the nature of these samples is shown in Table 1. The olive pomace samples (RR1 and RR2) that belong to the 2011 olive harvest season were collected from the operation lines of two different olive mills and were rich in moisture by the time when they were brought to the laboratory. They were air-dried in their loose form. These two samples showed a signifIcant mass loss over a period of about 2 months. The three fire briquettes that belong to the 2009 harvest season (sample KT120) were family donation purchased by the donating family in the summer of 2010. The moisture content of this sample was about 1% by the time we received it in March, 2011. The other three samples (KT121, KT122, and KT123) were collected in the summer of 2011 as fire briquettes from the drying yards of two neighboring olive mills. After several weeks of ex-

Table 1. Description of the olive pomace samples used in the present study.
posure to the ambient of the laboratory, samples KT121 and KT123 attained a moisture level of about 2% while that of sample KT122 was 11%. Relatively short laboratory air-drying of samples RR1 and RR2 had resulted in a moisture level of about 43% and 55%, respectively. However, prolonged laboratory air-drying brought the moisture level of these two samples down to about 10%. As with regard to the description of an olive pomace fire briquette, it is a machine-fabricated solid object, cylindrical in shape with base diameter of about 30 cm, a height of about 20 cm, and a mass of about one Kg. Before starting the measurements reported in the present study, about 500 g of each sample were ground to a fine powder by using an electric grinder driven by a motor with a power of 600 W. The fine powder had passed a 750 µm sieve. All the measurements reported in this work were carried out on such powder.
The moisture content of the powder samples was determined by the use of a conventional drying oven at 110˚C for about 15 hours. At least duplicate runs were carried out for each sample with a mass of about one to two grams.
The determination of the ash content, which represents the mineral component of the olive pomace, was obtained by igniting about one gram of the test sample in a muffle furnace at 600˚C for five hours. At least triplicate runs were performed for each sample. Porcelain crucibles were used for sample ignition.
The exhausted (de-oiled) olive pomace samples were prepared from their parent crude olive pomace via Soxhlet hexane-extraction process. The letter “h” is added as a suffix to the symbol of the crude pomace to denote the residue of the hexane-extracted sample. For example KT120h is both the residue left after subjecting sample KT120 to a hexane-extraction treatment and an exhausted olive pomace sample. The procedure followed in the preparation of the de-oiled olive pomace was as follows. The required mass of a dry crude olive pomace was placed in the cellulose thimble. The thimble was then placed inside the Soxhlet extractor. About 150 ml of nhexane (purity 95%) were placed in the 250-ml roundbottom distillation flask. After that the Soxhlet extractor was inserted between the condenser and the distillation flask. A heating mantle was used for distillation of hexane. Other relevant precautions included leaving enough space above the sample to avoid spillage of the fine fraction of the sample when the solvent runs down from the soxhlet chamber to the distillation flask, adjustment of the siphoning rate of hexane to achieve optimal contact time between solvent and sample, and adjustment of the settings of the heating mantle and the water tap to minimize loss of solvent. The run time was about 12 hours after which the color of the extractives solution in the distillation flask was noted and the thimble was taken out of the Soxhlet extractor for drying at 80˚C. When the thimble and its contents attained constant mass, the % of extracted fatty material (extractives) was calculated. The density of the extractives solution was also measured.
The heat of combustion of both the de-oiled and its parent sample was measured by using an adiabatic oxygen bomb calorimeter (IKA Calorimeter System C 2000 Basic), stationed at the laboratories of the Department of Industrial Chemistry, the Royal Scientific Society (RSS). The heat capacity (Energy Equivalent) of the calorimeter is 8985 J/K. About one gram of the test sample was used for calorimetric measurements. When the combustion of the sample was completed, the oxygen bomb was taken out for an acid wash. The acid wash step entailed thorough washing of the internal surface of the oxygen bomb by distilled water in order to collect the hydrated acids such as HNO3 and H2SO4 that come from the oxidation of nitrogen and sulfur contents of the sample. The acid wash solution was titrated by using 0.0846 M NaOH and phenolphthalein as indicator. As will be explained later, the consumed moles of NaOH and the correction factor for the acid contribution are used with other corrections to adjust the gross calorific value (GCV). The practical value of the heat of combustion is known as net calorific value (NCV) which represents the actual heating value of a fuel when combusted in boilers and industrial applications under normal conditions of fuel combustion. The value of the NCV is usually calculated from the value of the GCV. However, both quantities are prime indices for fuel characterization.
The measurements of elemental analysis were carried out at the laboratories of the Chemistry Department, Jordan University (JU). The elemental analyzer that we used is Euro Ea 3000 elemental analyzer. Few milligrams of a dry sample were used for finding the mass percentages of carbon, hydrogen, and nitrogen. Duplicate runs were carried out for each sample. Analysis for sulfur was not possible at the time we used the elemental analyzer.
The thermogravimeter (Netzsch TGA 409 PC Luxx) was used for conducting the pyrolysis experiments (TG). This instrument is stationed at the laboratories of the Chemistry Department, Jordan University. Aluminum crucibles with pierced lids were used. A stream of flowing nitrogen at a flow rate of 100 ml/min was used to provide an inert atmosphere during the thermal degradation of the test sample. The heating rate adopted for the TG runs was chosen to be 20˚C/min. Because of the softening of aluminum at temperatures close to 600˚C, the upper temperature of a TG run was limited to near 600˚C. The mass of a test sample was in the range 9 to 25 mg for the TG measurements. All samples were dried at 110˚C before conducting the measurements. Microsoft Excel was used for generating the thermograms of a TG run.
3. Results and Discussion
3.1. Results of the Hexane-Extraction Experiments
The data shown in Table 2 for sample RR1 represent a series of triplicates of typical hexane-extraction experiments. Triplicates of the other samples were treated in a manner similar to those of sample RR1. The data given in Table 3 are based on averages of triplicates of extraction experiments for all samples. It is worth mentioning the relationship between the siphoning rat of the solvent and the duration of an extraction experiment. By comparing the siphoning rates and the durations of runs 1 and 3 with their corresponding counterparts of run 2 in Table 2, we conclude that, for nearly the same % extractives, short duration runs require slow solvent siphoning rates while fast siphoning rates require longer durations. As with regard to the color of the extractives solution, the yellowish color indicates that olive oil has been extracted by hexane from the crude olive pomace while the brown color of the extractives solution of sample KT120w is understandable in view of the fact that the color of waste water emerging from an olive mill is usually brown. However, the brown color of the extractives solution of sample KT123 presents an apparent contradiction to this line of reasoning. Since sample KT123 was collected from the bottom of an olive pomace pile, it did not suffer leaching by rain and might retained plenty of moisture saturated with brown-coloring material that can mask the yellowish color of any extracted olive oil. As can be seen from Table 3 the percentage of the extracted matter ranges between 6.0 and 21.3. Such range was also observed previously for hexane-extracted pomace as well as for water-extracted olive pomace [3]. Several factors can affect the amount of fat material that can be extracted by the non-polar solvent. Examples of these factors are the type of olive cultivar, the degree of ripeness of the olive fruits, the working conditions of the olive mill, the weather conditions prevailing in the storage yards of olive mills, particle size of the test sample, and the possible degradation or fermentation by microorganisms. Most of these variables are not easy to control in a public olive mill. Despite all these considerations, we notice from Table 3 that the history of a sample might play an important role in determining the amount of its extractable residual oil. For example sample KT120 is the oldest sample with as-received moisture content of about 1% has the lowest percentage of extractives matter, while the fresh samples RR1 and RR2 have higher percentages of extractable matter. Old samples seem to lose significant amounts of their fat content due to physical and chemical processes. In accordance with this line of reasoning are the differences in the extractives percentages of samples KT121 and KT123. These two samples were collected from the drying yard of the same olive mill. KT121 is a pomace sample taken from the top of the olive pomace pile in the storage yard of the mill and seem to have lost a significant amount of volatiles due to its exposure to weather conditions for about five months; on the other hand sample KT123 was taken from the bottom of the pomace pile; therefore KT123 is protected from weather conditions that prevail from the end of the olive harvest season in December up to the beginning of the sun-drying period in May. Consequently, the amount of extractable matter of sample KT123 is expected to be higher than that of sample KT121. The extraction results reported in Table 3 can be compared with some literature values obtained by exhaustive Soxhlet extraction. The relevant literature values are 5.82% in hexane, 5.22% in ethanol [19], 12.21% in pure hexane, and 9% in acidified hexane [20]. The water-extracted matter is certainly not a fatty material; instead the extractives are very likely to be soil, debris, minerals, and other water soluble degraded polysaccharides. The % RD (% relative deviation) that appears in the last row of Table 3 is defined by Equation (1). Its value can be considered as a precision indicator.
 (1)
(1)
where n is the number of replicates, M is the mean of the replicates, and X is the value of a replicate.
3.2. Determination of the Ash Content of the De-Oiled Olive Pomace
The ash content of the de-oiled olive pomace samples is given in Table 4 on dry basis (for details see Table S1 in the supplementary material section).There are variations in the percentages of ash content as reported in this table where samples KT120h, KT122h, and KT120w have higher ash content relative to the other samples. The history of each sample seems to be an important factor in determining its ash content. To the best of our knowledge, previous studies on the ash of de-oiled Jordanian olive pomace have not been reported.
3.3. Determination of the Ash Content of the Crude Olive Pomace
The ash content of the crude olive pomace samples is given in Table 5 on dry basis (for details see Table S2 in the supplementary material section).
With the exception of samples KT120 and KT122 that show the highest ash content, the ash content of the other samples is in reasonable agreement with the results of previous studies on the crude olive pomace of Jordan [3,4].
A comparison is made between the ash content of the de-oiled pomace and the ash content of the crude pomace
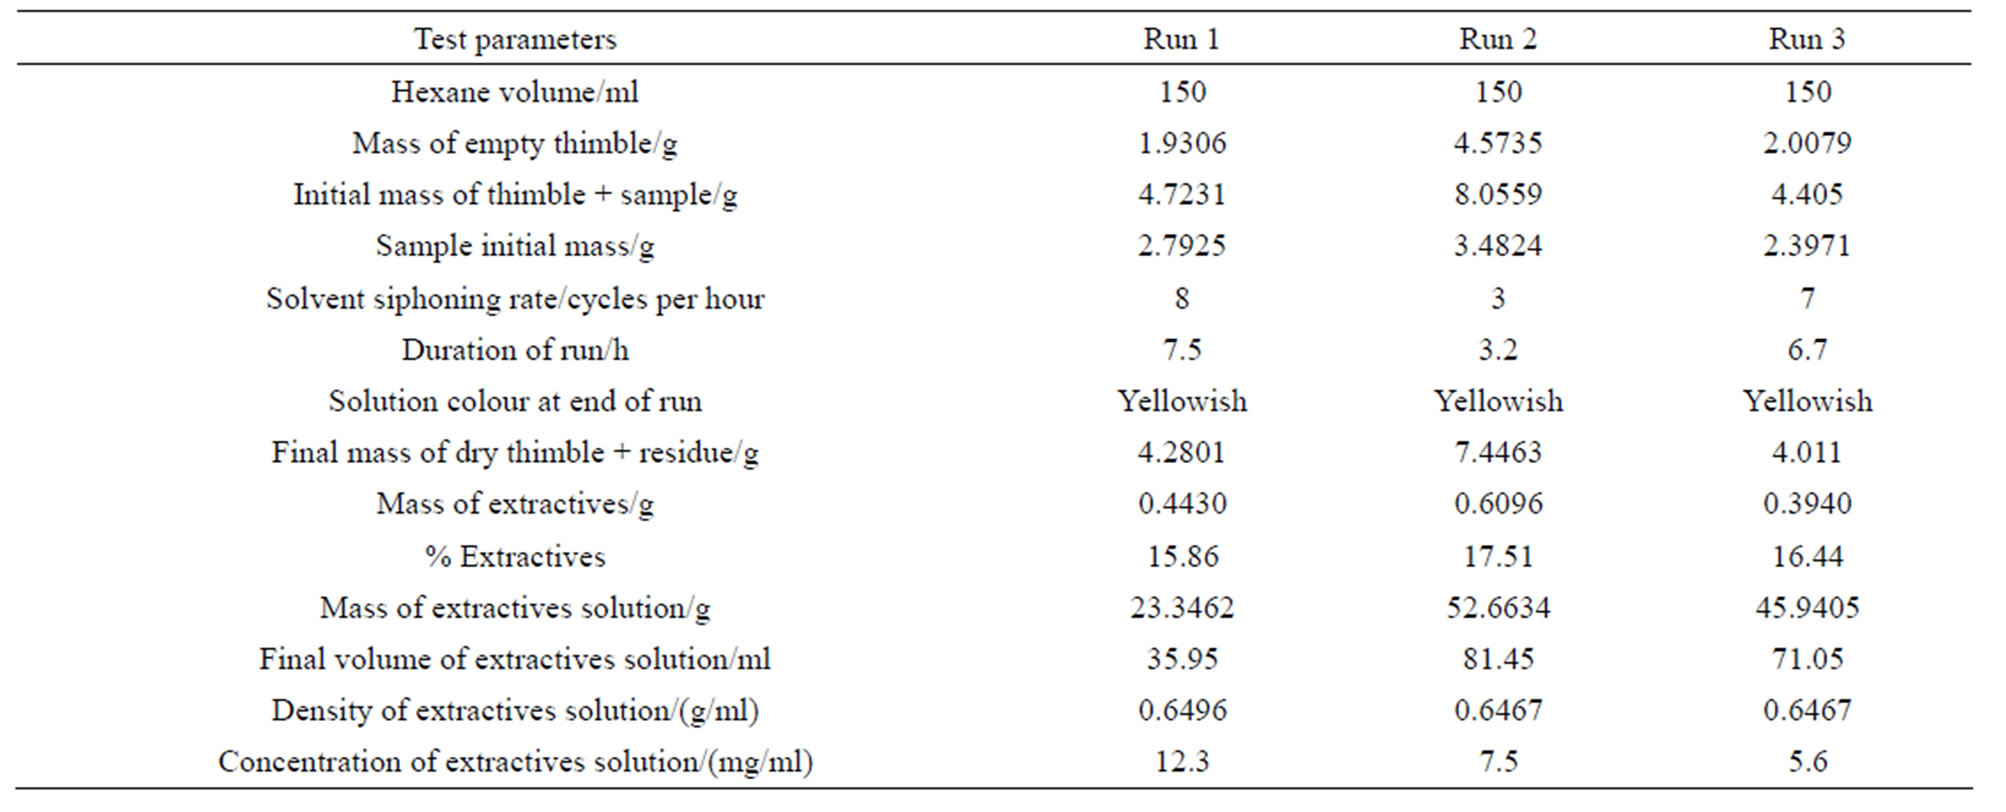
Table 2. Results of typical hexane-extraction experiments for sample RR1.

Table 3. Percentages of extractives matter of crude olive pomace samples extracted by hexane or water.

Table 4. The percentages of the ash content of the hexane-extracted and water-extracted olive pomace samples.

Table 5. The percentages of ash content of the crude olive pomace samples.
and the results are given in Table 6. According to this table the ash content of the de-oiled pomace is less than that of the crude pomace for all samples. We have no clear cut explanation for such difference in ash content. All samples extracted and non-extracted gave a white ash which might rule out the possibility of having unburned organic matter. Nevertheless, one can visualize a porous structure resulting from the leaching of the fatty material

Table 6. Comparison of the ash content of the de-oiled pomace with the ash content of the crude pomace.
that could allow extensive thermal decomposition of the mineral matter of the de-oiled pomace. Such porous structure does not exist in the case of the crude pomace. In the case of the sample extracted with water, the removal of the non-fat material might also lead to a porous structure that enhances the decomposition of the waterinsoluble inorganic matter. If high ash formation is considered as disadvantage, our results show that the exhausted olive pomace is superior to crude olive pomace when used as a solid fuel.
3.4. Ultimate Analysis of Crude Olive Pomace
The ultimate analysis of the crude olive pomace is given in Table 7 on dry basis (for details see Tables S2 and S3 in the supplementary material section). % Oxygen was calculated by difference on dry basis. We were unable to determine the sulfur content of the samples due to the unavailability of such analysis by the instrument we used. However, the sulfur content of the briquettes of a Jordanian crude olive pomace sample was reported to be about 0.1% [4]. According to the data given in Table 7, samples KT120 and KT122 have their carbon and oxygen percentages lower than the averages given in the last row of Table 7 while their ash percentages are higher than the overall average. It is interesting to note the inverse relationship between the percentage of carbon and the percentage of ash for these two samples; at the moment we have no explanation for this observation. In terms of specifications, the values given in the last row of Table 7 can be reliably considered for any future attempts concerned with setting specifications for crude olive pomace in Jordan.
3.5. Ultimate Analysis of Exhausted Olive Pomace
The ultimate analysis of the exhausted olive pomace is given in Table 8 on dry basis (for details see Tables S1 and S4 in the supplementary material section). By comparing the ultimate analyses given in Tables 7 and 8, we find that the percentages of carbon and hydrogen for the de-oiled pomace are slightly lower than those of the crude olive pomace. This is an expected result because extraction by hexane leads to loss of fat material which is carbon and hydrogen containing matter. The difference in oxygen content reflects the difference in ash content of the two types of the olive pomace. As with regard to the nitrogen content the two types of olive pomace have no difference within the limits of the precision in the nitro-
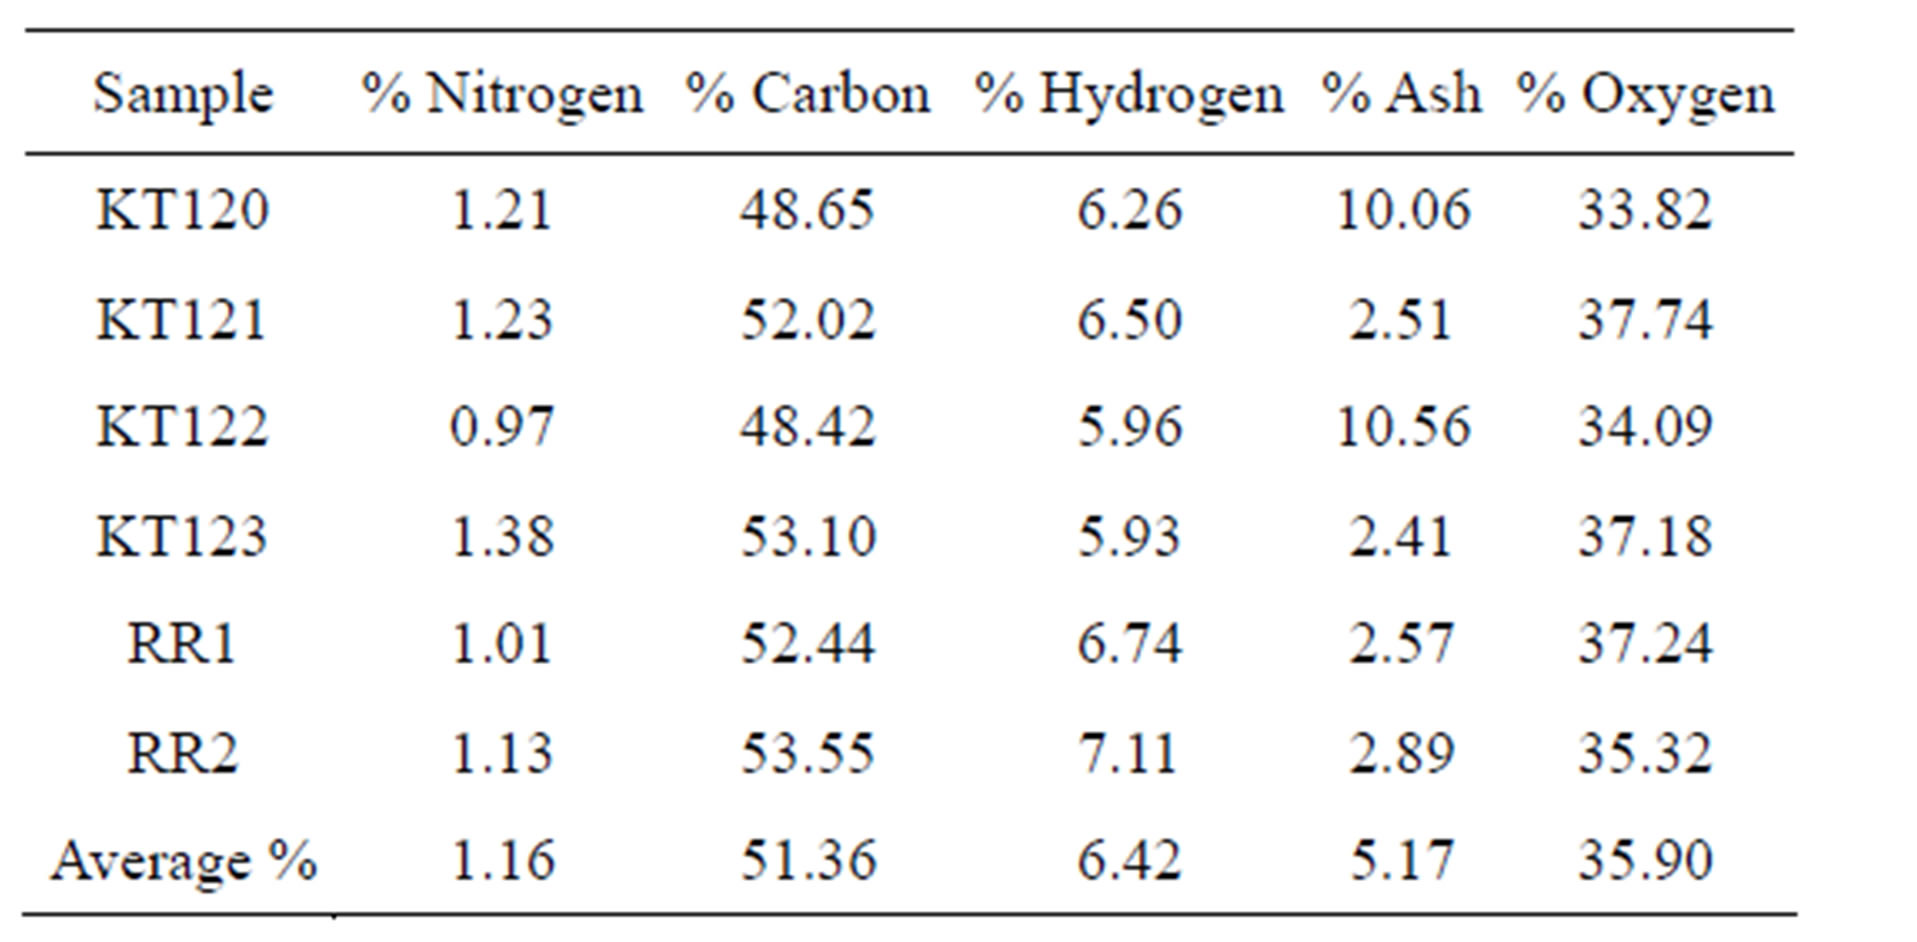
Table 7. The ultimate analysis of crude olive pomace.
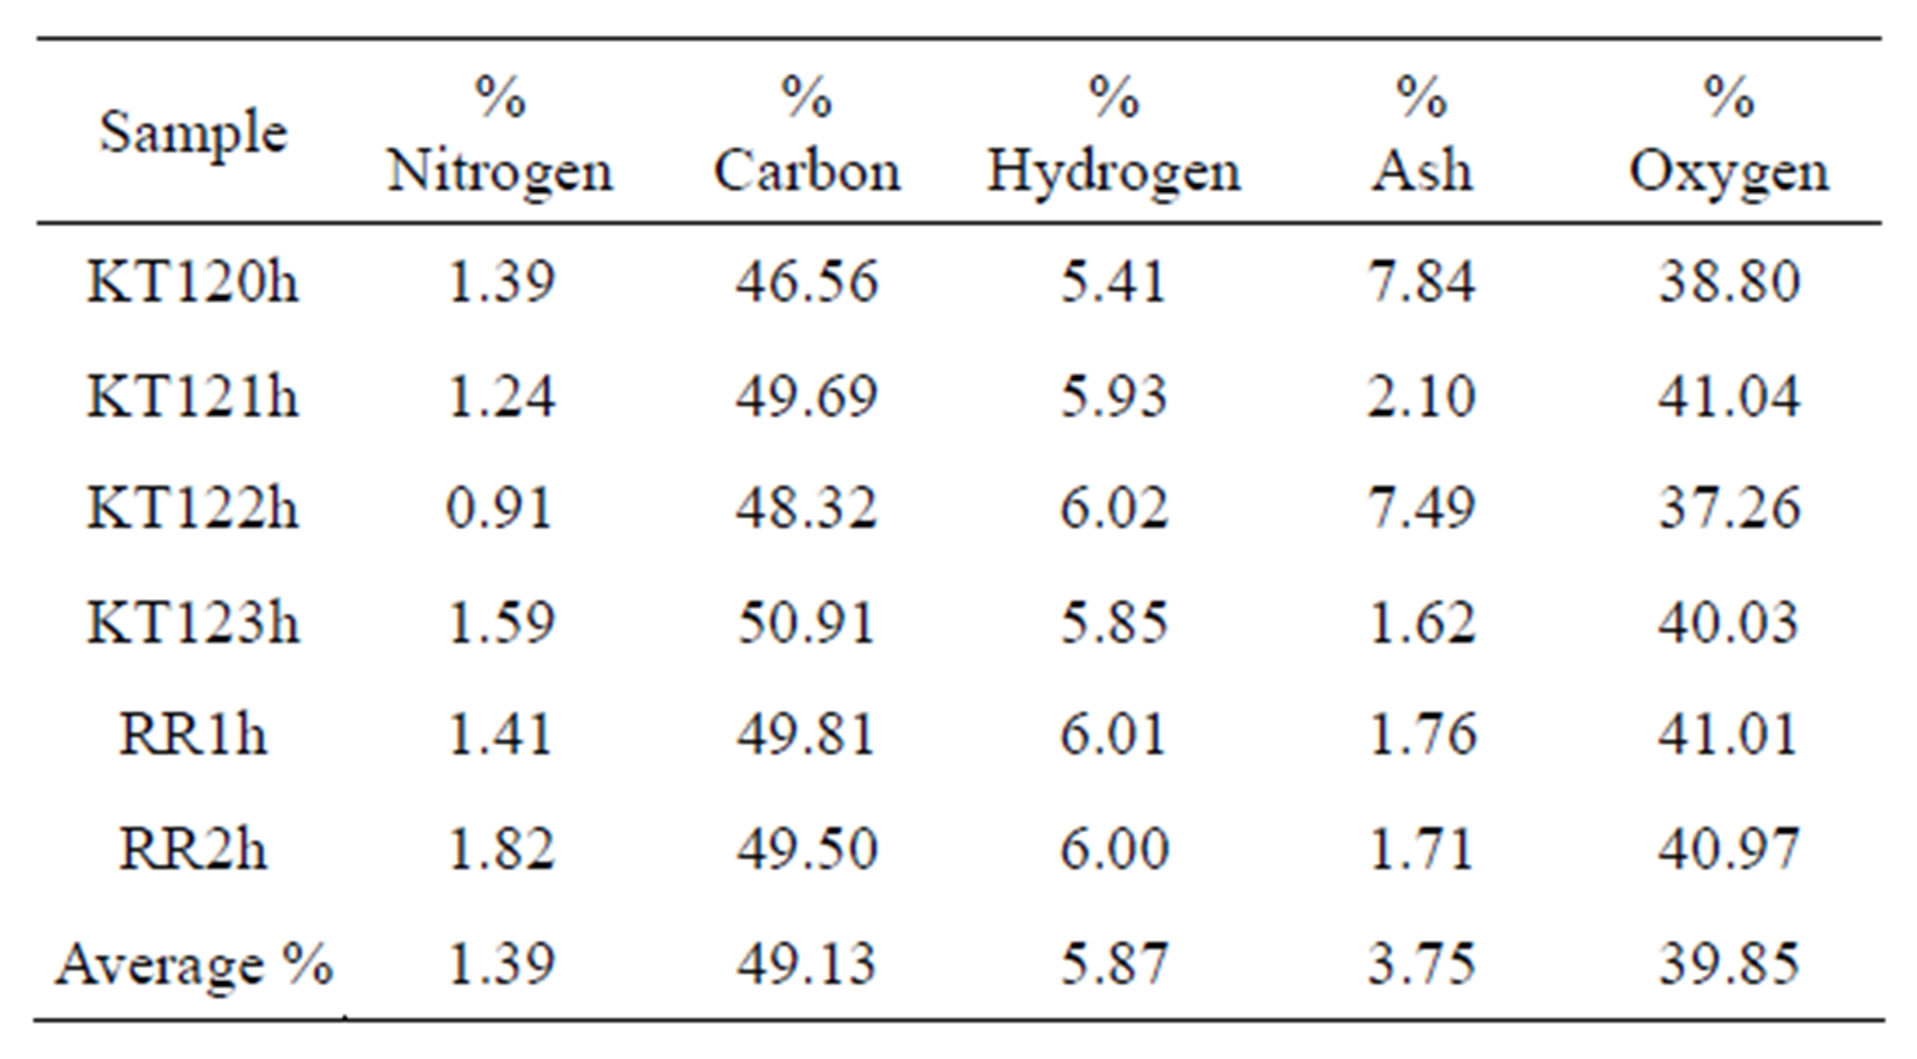
Table 8. The ultimate analysis of the exhausted olive pomace.
gen determination. In addition to these observations, the inverse relationship between the ash and carbon percentages noted earlier for samples KT120 and KT122 is still maintained after being extracted by hexane (samples KT120h and KT122h in Table 8).
3.6. Results of the Heat of Combustion
The results of heat of combustion are given in Table 9 for both the crude and the exhausted olive pomace samples on dry basis. The oxygen bomb calorimeter used in the present study has a precision of 0.01% when used for finding the GCV of a variety of samples including olive pomace, oak wood, olive wood, pine wood, olive oil, kerosene, and diesel [3]. Based on this high precision, only one measurement was taken for each sample in the present study. In addition to the GCV, the experimental and expected values of the acid wash, expressed as volumes of NaOH, are also included in Table 9. The expected volume of NaOH reported in the last column of Table 9 was calculated on the basis that the % of S is 0.1 [4] and the % of N is the experimentally-determined value for a test sample.
Under the experimental conditions of the oxygen
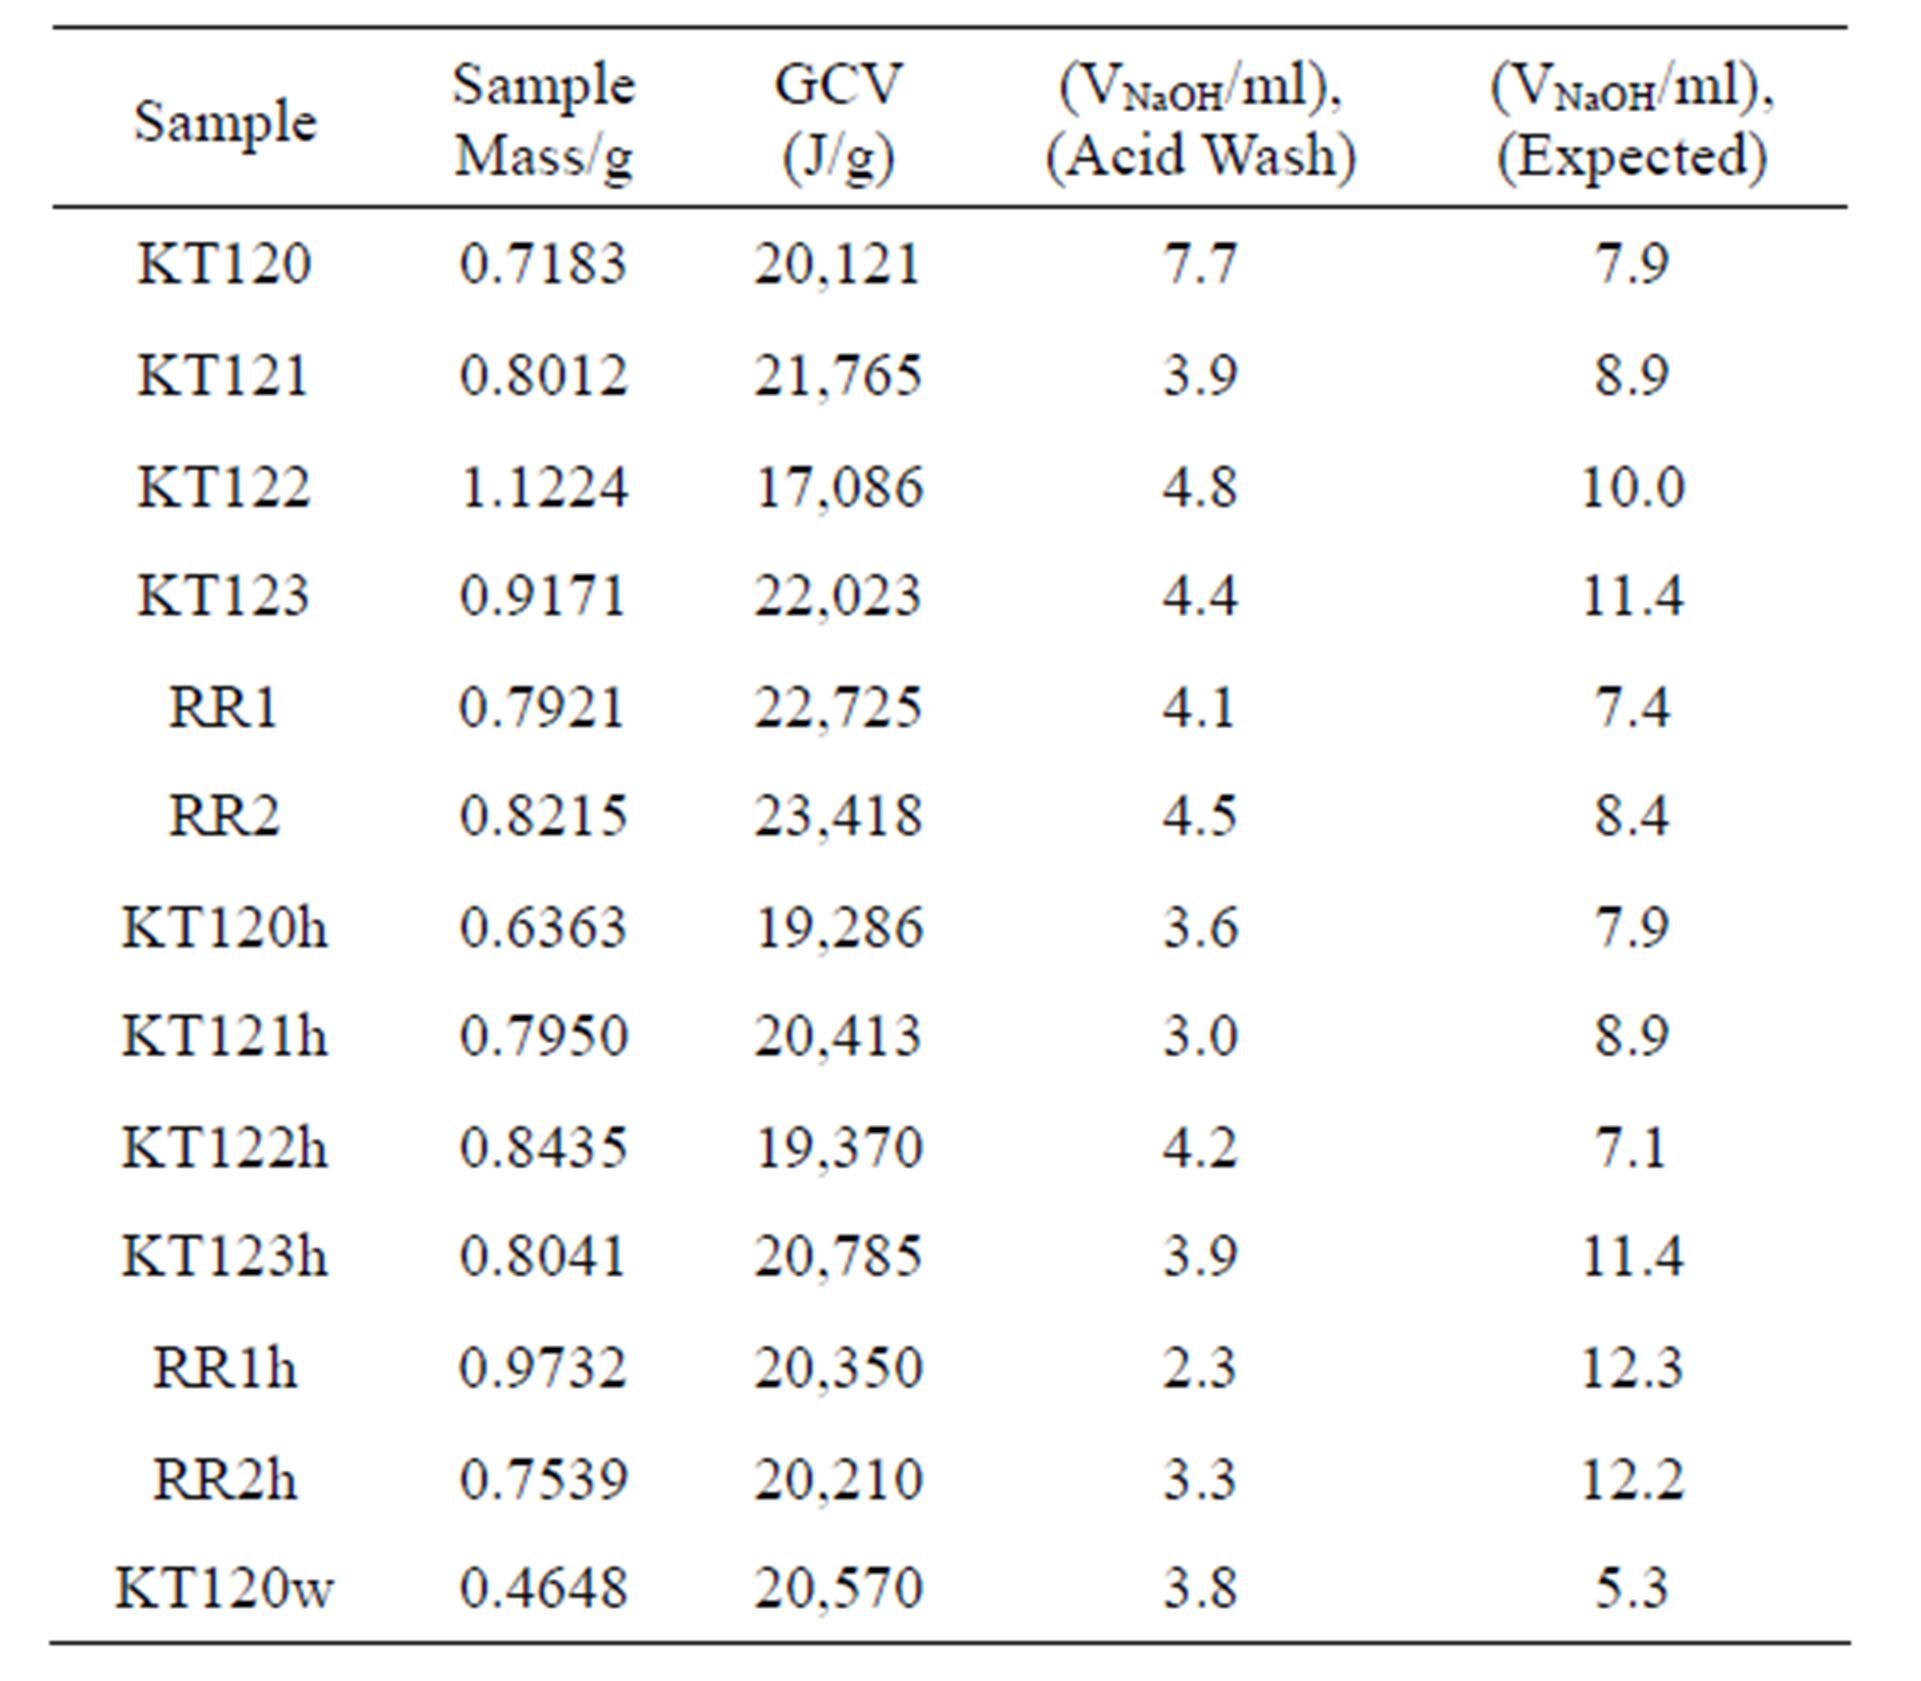
Table 9. Heat of combustion data for crude and exhausted olive pomace samples.
bomb calorimetry, the GCV values reported in Table 9 cannot be credited to the sample because heat is generated by the condensation of water coming from sample moisture and water that has been chemically generated due to combustion of the hydrogen content of the sample. This contribution can be accounted for if the percentages of hydrogen and moisture content of a sample are known. In addition to the heat coming from condensation of water, the heat of hydration of acids that originate from nitrogen, sulfur, and halogen contents of the sample should also be subtracted from the GCV. Another conceivable source of heat might come from the interaction of the condensed water with the mineral residue left after the burning of the sample. In the present study we only dealt with corrections related to sulfur, nitrogen, and hydrogen of a sample on dry basis. The acid wash reported in Table 9 as volume of NaOH represents the amount of NaOH needed to neutralize the acids formed during the combustion of the sample. The entries in the last column of Table 9 are the expected values of the volume of NaOH required for neutralizing HNO3 and H2SO4 based on the percentages of N and S. For the case of acid correction, the current information regarding the thermochemical corrections for oxygen bomb calorimetry [21, 22] only heat resulting from combination of water vapor with H2SO4 and HNO3 can be accounted for. Under the bomb conditions, the formation of HNO3 and H2SO4 generates heat energy of 59.7 and 297.2 kJ/mol for HNO3 and H2SO4, respectively [21,22]. With an atomic mass of S equal to 32.065 g/mol, the sulfuric acid correction is 92.7 J for each percentage point of sulfur per gram of sample and with atomic mass of N taken as 14.0067 g/mol, the nitric acid correction is 42.6 J for each percentage point of nitrogen per gram of sample. The heat generated due to condensation of sample moisture (W) is given by 2.442 (%W/100) kJ/g of condensed water per gram of wet sample and the corresponding value coming from condensation of water vapor due to oxidation of sample hydrogen is given as 2.442 (%H/100) (9.01) (1-%W/100) per gram of wet sample. The factor 2.442 is the heat of condensation of water vapor in units of kJ/g of condensed water based on a value of 43.990 kJ per mol of condensed water at 25˚C [23].
Based on this information we calculated the values of NCV on dry basis in units of Joule per gram of dry sample according to the following formula.
 (2)
(2)
By considering %S = 0.1 [4] and a value of 1.3% N representing the average of % N reported in Tables 7 and 8, we found that the HNO3 correction is about 6 times larger than the H2SO4 correction. According to Equation (2) the correction due to the presence of 0.1% S is 9.27 J per gram of sample. We have included this value in generating the data given in Table 10. In this table, H1/(J/g) is an acid correction based on experimental acid wash under the assumption that only HNO3 is formed during sample combustion, H2/(J/g) is an acid correction based on calculated acid wash under the assumption that both HNO3 and H2SO4 are formed during sample combustion, and H3/(kJ/g) is a correction for condensation of the vapor of the chemically-generated water based on % hydrogen on dry basis.
The values of NCV reported in the sixth column of Table 10 were obtained by applying Equation (2). Each value of NCV represents the heat of combustion of a fuel under normal conditions where the sulfur of a sample emerges as SO2 gas, nitrogen emerges as elemental nitrogen, and water due to sample moisture and combustion of sample hydrogen leaves the combustion facility as vapor. The ratios given in the last column of Table 10 indicate that the NCV is nearly 7% lower than the GCV. In order to check the reliability of using the experimentally obtained volumes of NaOH in calculating the acid correction, we have calculated the expected volume of NaOH (in ml) required for neutralizing HNO3 and H2SO4 in the acid wash according to Equation (3) and the stoichiometric relation: moles of NaOH at the end point of titration = moles of HNO3 + 2 (moles of H2SO4).
 (3)
(3)
where M and m stand for the molarity of NaOH and sample mass in grams, respectively. The calculated volumes are given in the last column of Table 9. With the
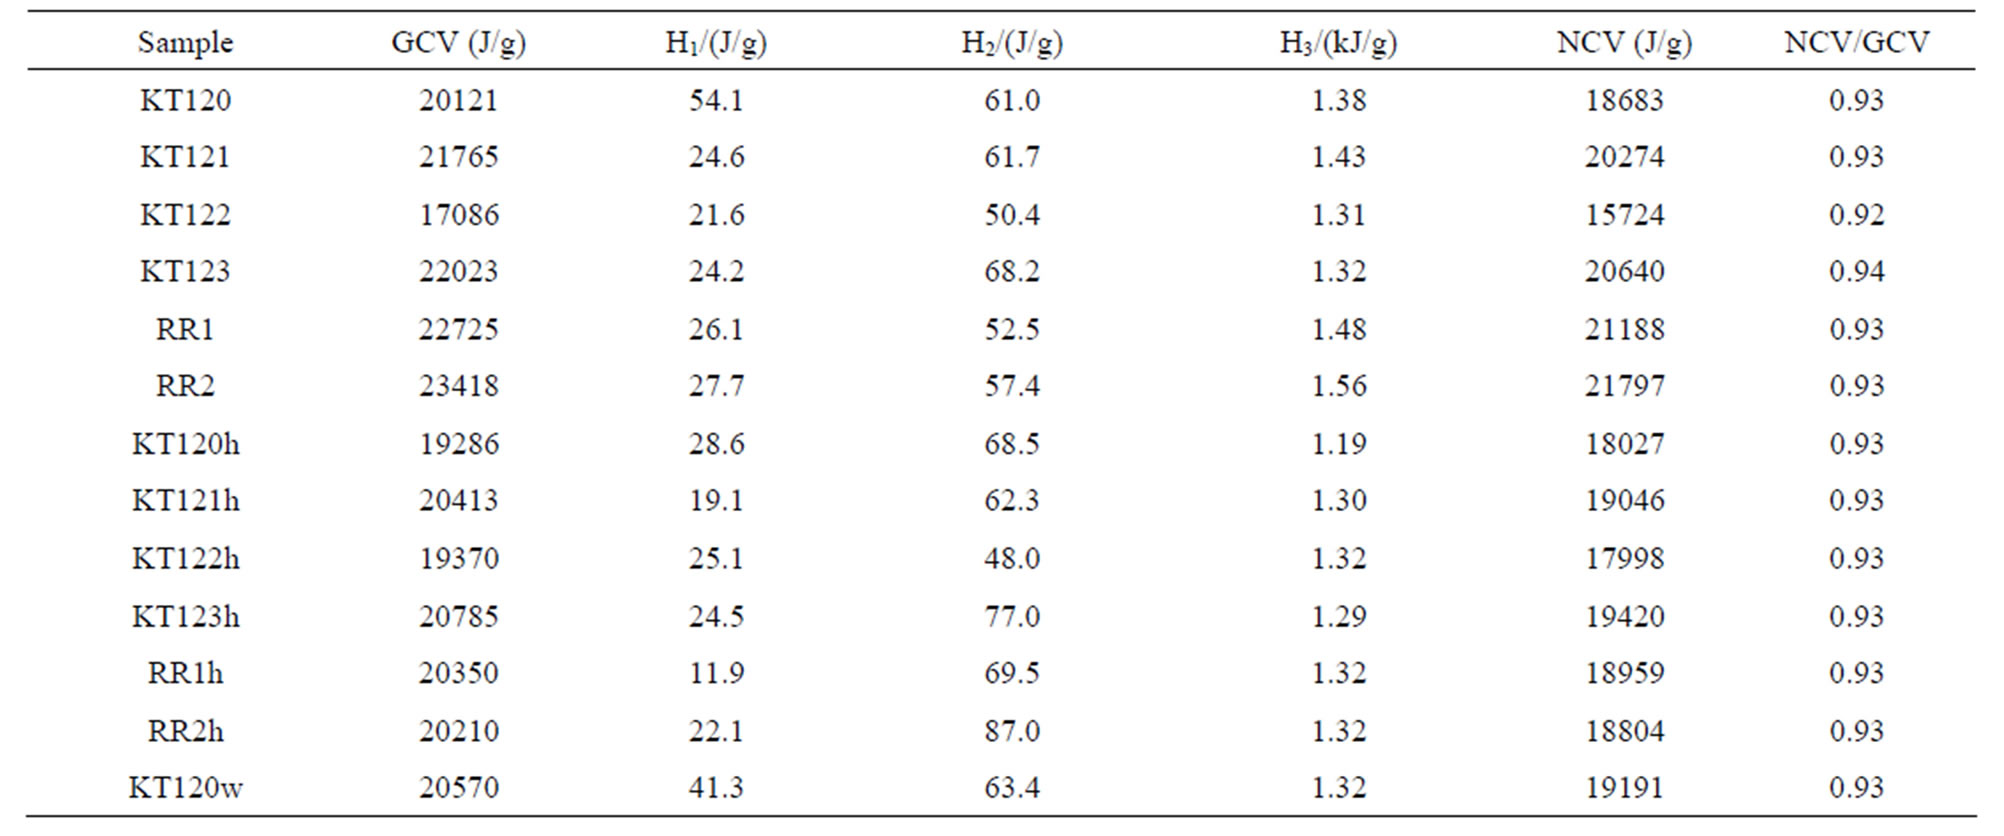
Table 10. Data for the calculation of the net calorific value (NCV) of crude and exhausted olive pomace samples on dry basis.
exception of samples KT120 and KT120w that have their experimental acid wash values comparable with the calculated acid wash values, all other samples have their acid wash volumes incorrectly reported by the calorimeter operator. Because of this observation we have relied on the data of elemental analysis and the thermochemical corrections to account for heat generated by formation of HNO3 and H2SO4 as given in the fourth column of Table 10. The ratios GCV (exhausted)/GCV (crude) and NCV (exhausted)/NCV (crude), as calculated from Table 10, have their averages equal to 0.96. This means that the calorific value of the exhausted pomace is about 4% lower than that of the crude pomace. This is a consequence of the loss of the fat material by hexane extraction. On the other hand extraction by water (sample KT120w in Table 10) seems to increase the values of the GCV and NCV of the parent crude pomace (sample KT120 in Table 10) by a factor of about 2.5%, presumably due to a decrease in the dilution effect of the inorganic component of a pomace sample. For comparison purposes, the values of the GCV for the crude pomace with an average of 21.19 kJ/g are in fair agreement with literature values of 22.1 [3], 23 [4] and 22.24 kJ/g [23]. The values of NCV for the crude olive pomace with an average of 19.72 kJ/g can be compared with literature values of 20.2 [6] and 20.61 kJ/g [25]. As with regard to the data of the exhausted olive pomace reported in Table 10 we have an average value of 20.07 kJ/g for GCV which can be compared with the literature values 19.7 [3] and 19.60 kJ/g [26]. The average value of NCV for exhausted olive pomace is 18.71 kJ/g which is in fair agreement with the literature values of 17.7 [3] and 17.9 kJ/g [26]. All of these cited values are on dry basis.
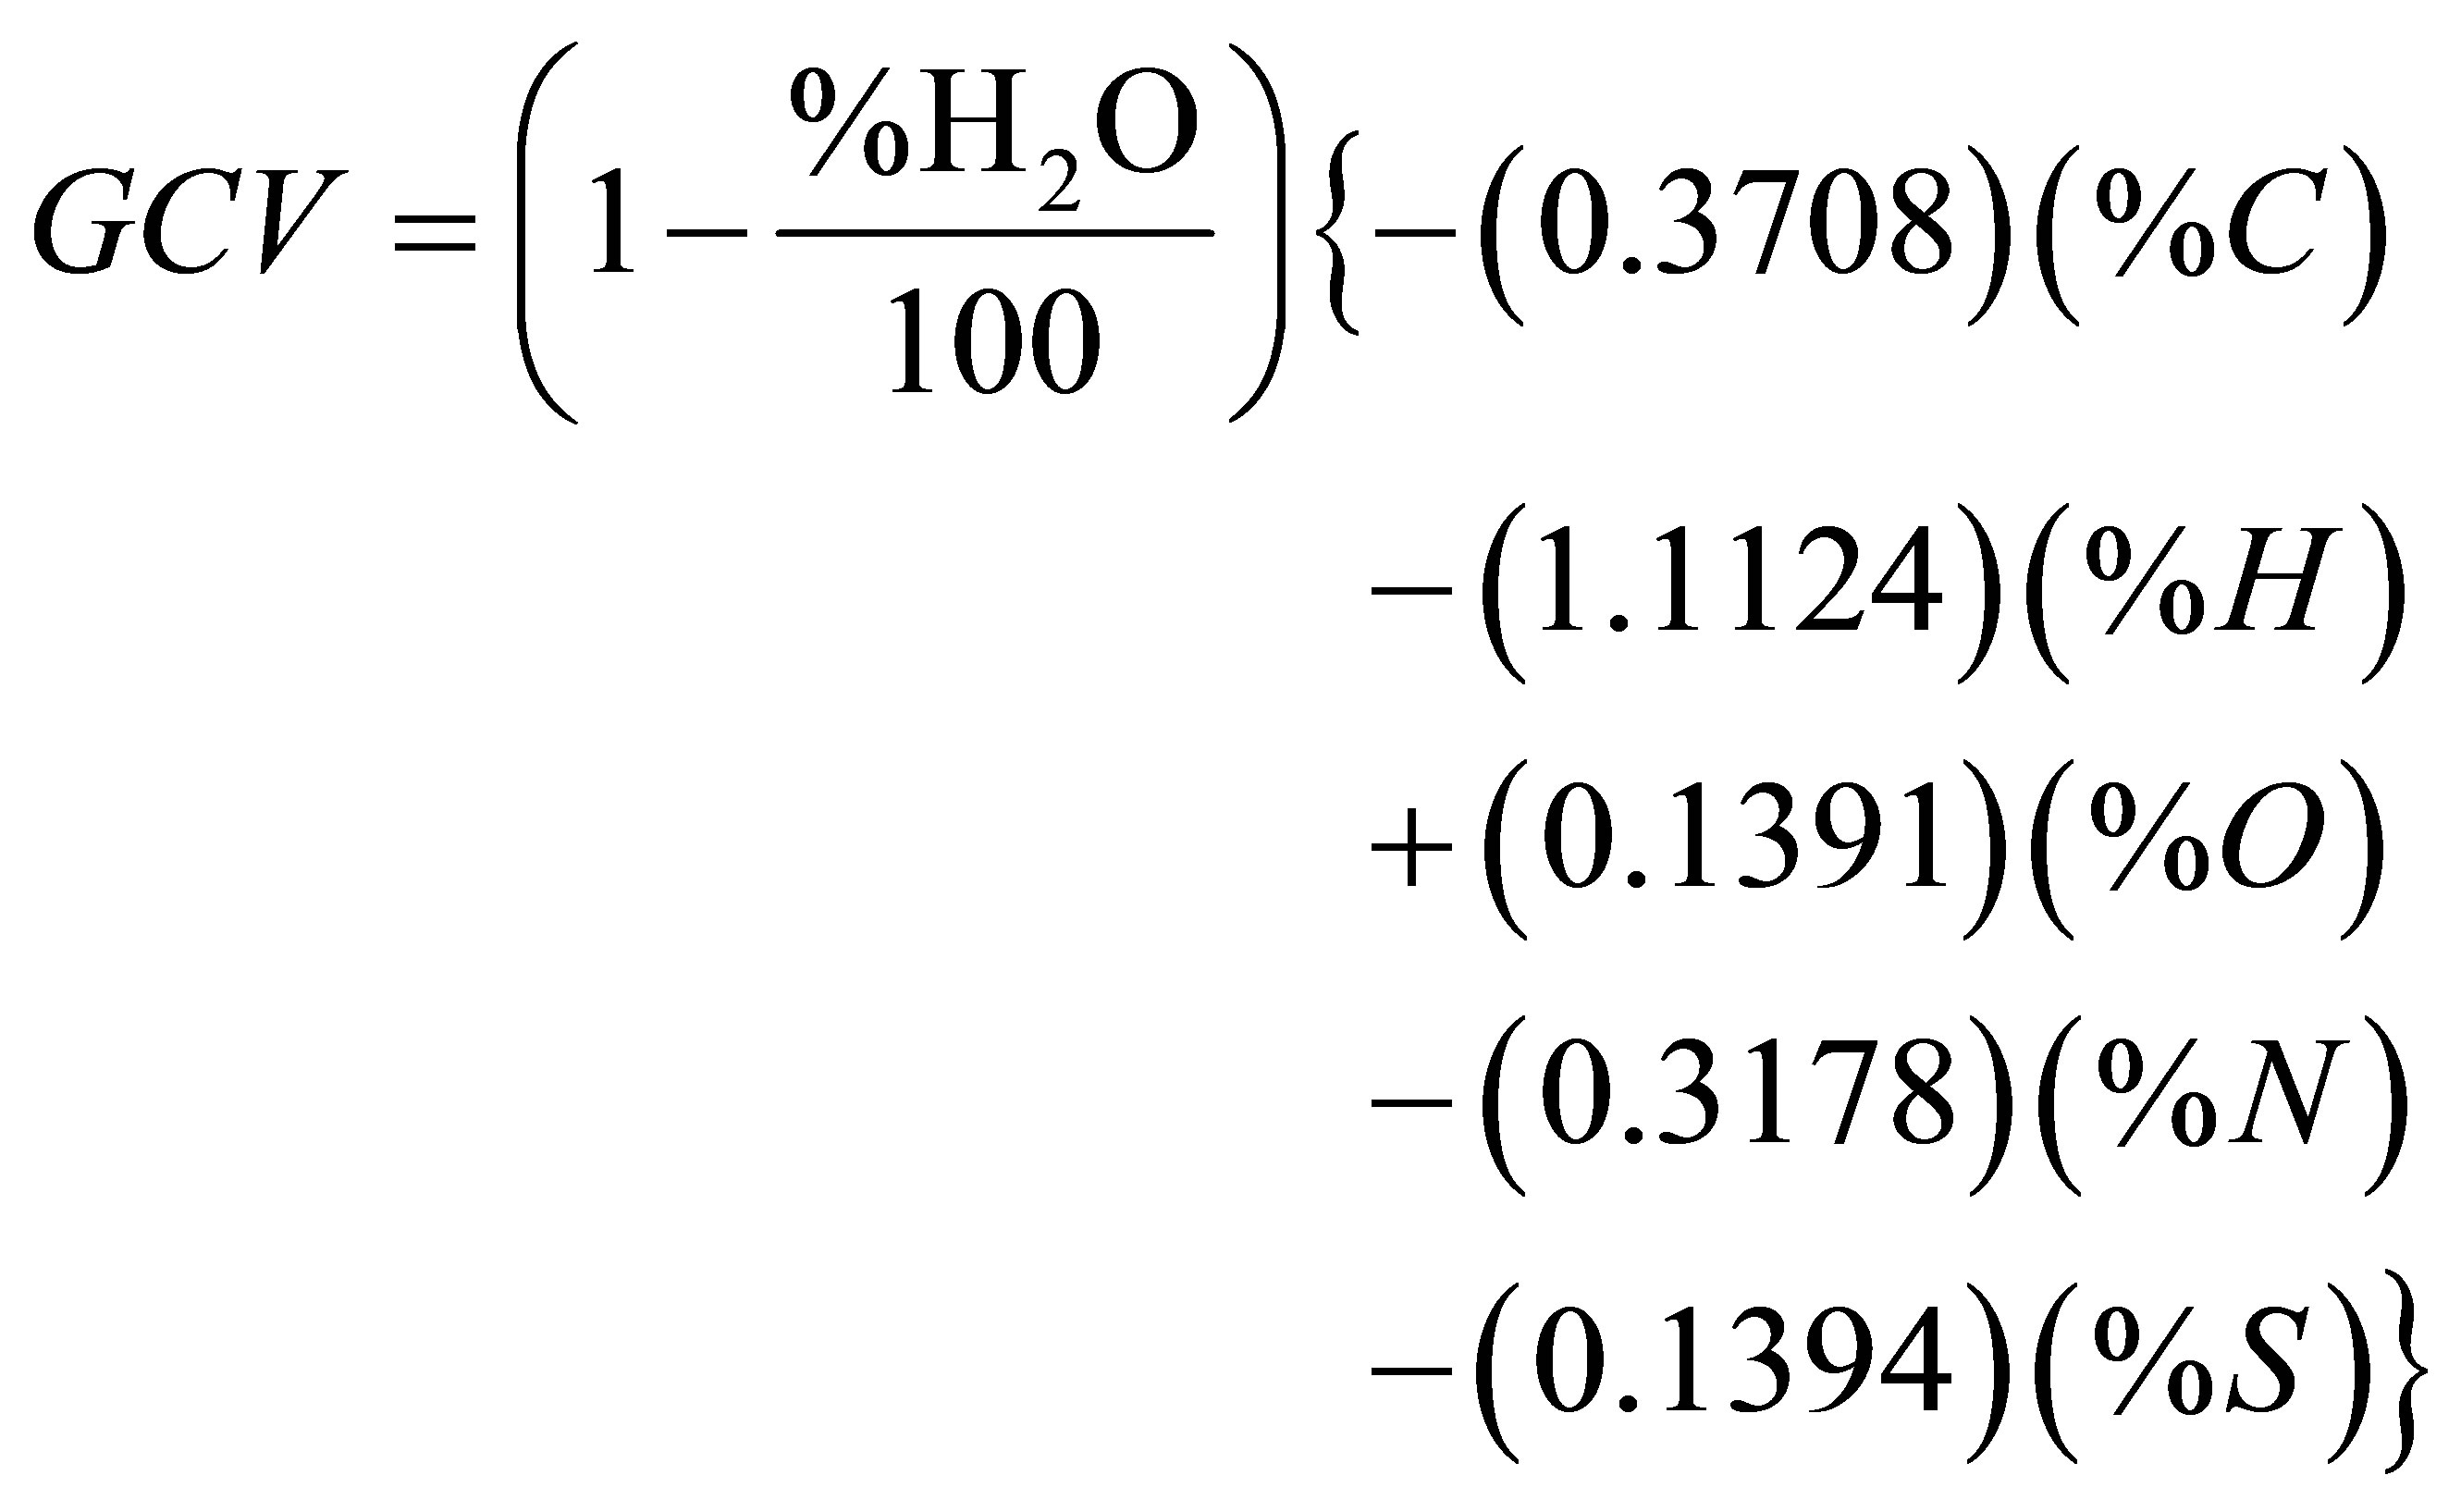
To conclude this section, we have considered some correlation formulas that have been reported in the literature for estimating the value of the GCV from the elemental analysis data of a fuel. We have used the correlation formula suggested by Meraz et al. [27] as given in Equation (4).
 kJ/g (4)
The statistical parameters associated with the predictions of Equation (4) are the mean absolute error (MAE) and the mean bias error (MBE) defined as follows.
 (5)
(5)
 (6)
(6)
where n is the number of data points which is 13 in our case and GCVc is the predicted value of GCV. If the elemental analysis of the sample is given on dry basis, the first factor on the right hand side of Equation (4) is unity. When the algebraic signs are kept as such in this equation, the resulting sign of GCV will be negative in accord with the thermodynamic convention. But we have reversed these algebraic signs in order to get a positive sign for GCV which is in accord with the convention of reporting the calorific quantities of fuels as positive values. Based on Equation (4), Table 11 shows the results of our calculations of the calculated gross calorific values (GCVcalc.) and the ratio of the calculated value relative to
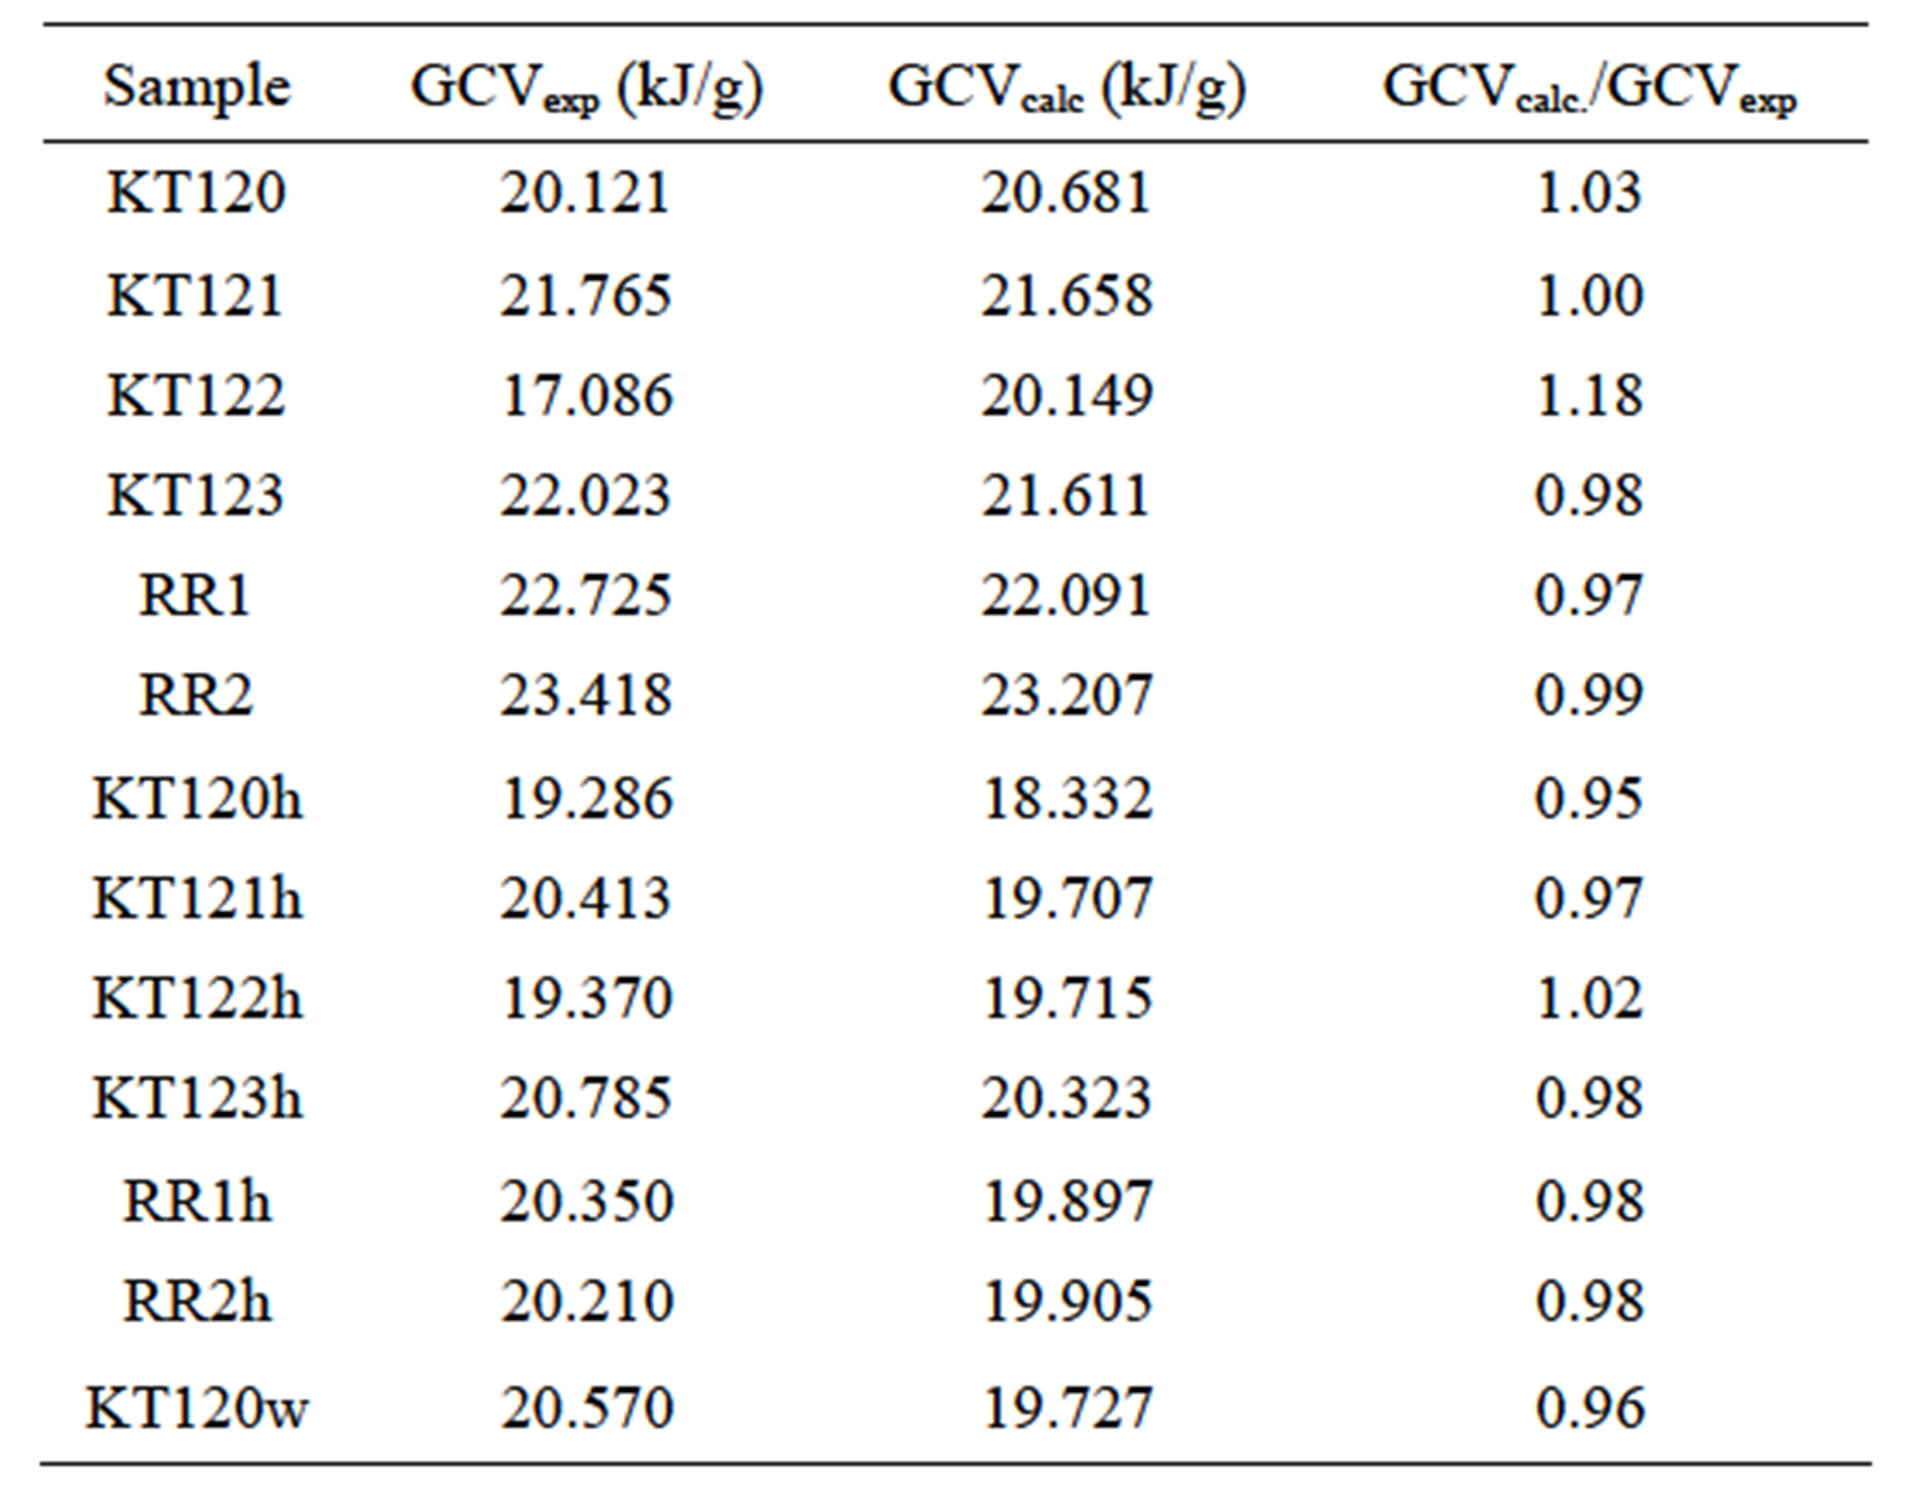
Table 11. Comparison between experimental and calculated values of GCV.
the experimental value (GCVcalc./GCVexp). The data used for these calculations were taken from the ultimate analyses given in Tables 7 and 8 with the % of S being ignored due to its insignificance in the calculations. As with regard to the values of the statistical parameters, we found the values 3.62% and −0.15% for MAE and MBE, respectively. This means that our results for the elemental analysis and the GCV correlate very well with the predictions of Equation (4). We have also used a correlation formula suggested by C.Y. Yin [28] that predicts the value of GCV (kJ/g) from ultimate analysis. This correlation formula is given as follows.
 (7)
(7)
Application of Equation (7) gave error levels of 5.41% and −3.51% for MAE and MBE, respectively. Based on the values of MAE and MBE, Equation (4) provides good predictions for our experimental values of GCV when compared with predictions of Equation (7).
3.7. Thermogravimetric Measurements
We have organized the pyrolysis thermograms of the investigated samples into three groups. Group (I) includes thermograms of samples whose source samples were compacted cylindrical briquettes, sun-dried in the storage yards of an olive mill (samples KT121, KT121h, KT122, KT122h, KT123, and KT123h); group (II) includes thermograms of samples whose source samples were obtained from the olive mill operation line and were air-dried in the laboratory in their loose form (samples RR1, RR1h, RR2, and RR2h); group (III) includes thermograms of samples KT120, KT120h, and KT120w whose source sample is KT120 which has history similar to that of group (I). Figures 1-3 show the thermograms of groups I, II, and III, respectively. Each TG curve

Figure 1. Pyrolysis thermograms of crude and hexane-extracted olive pomace samples given in group (I).
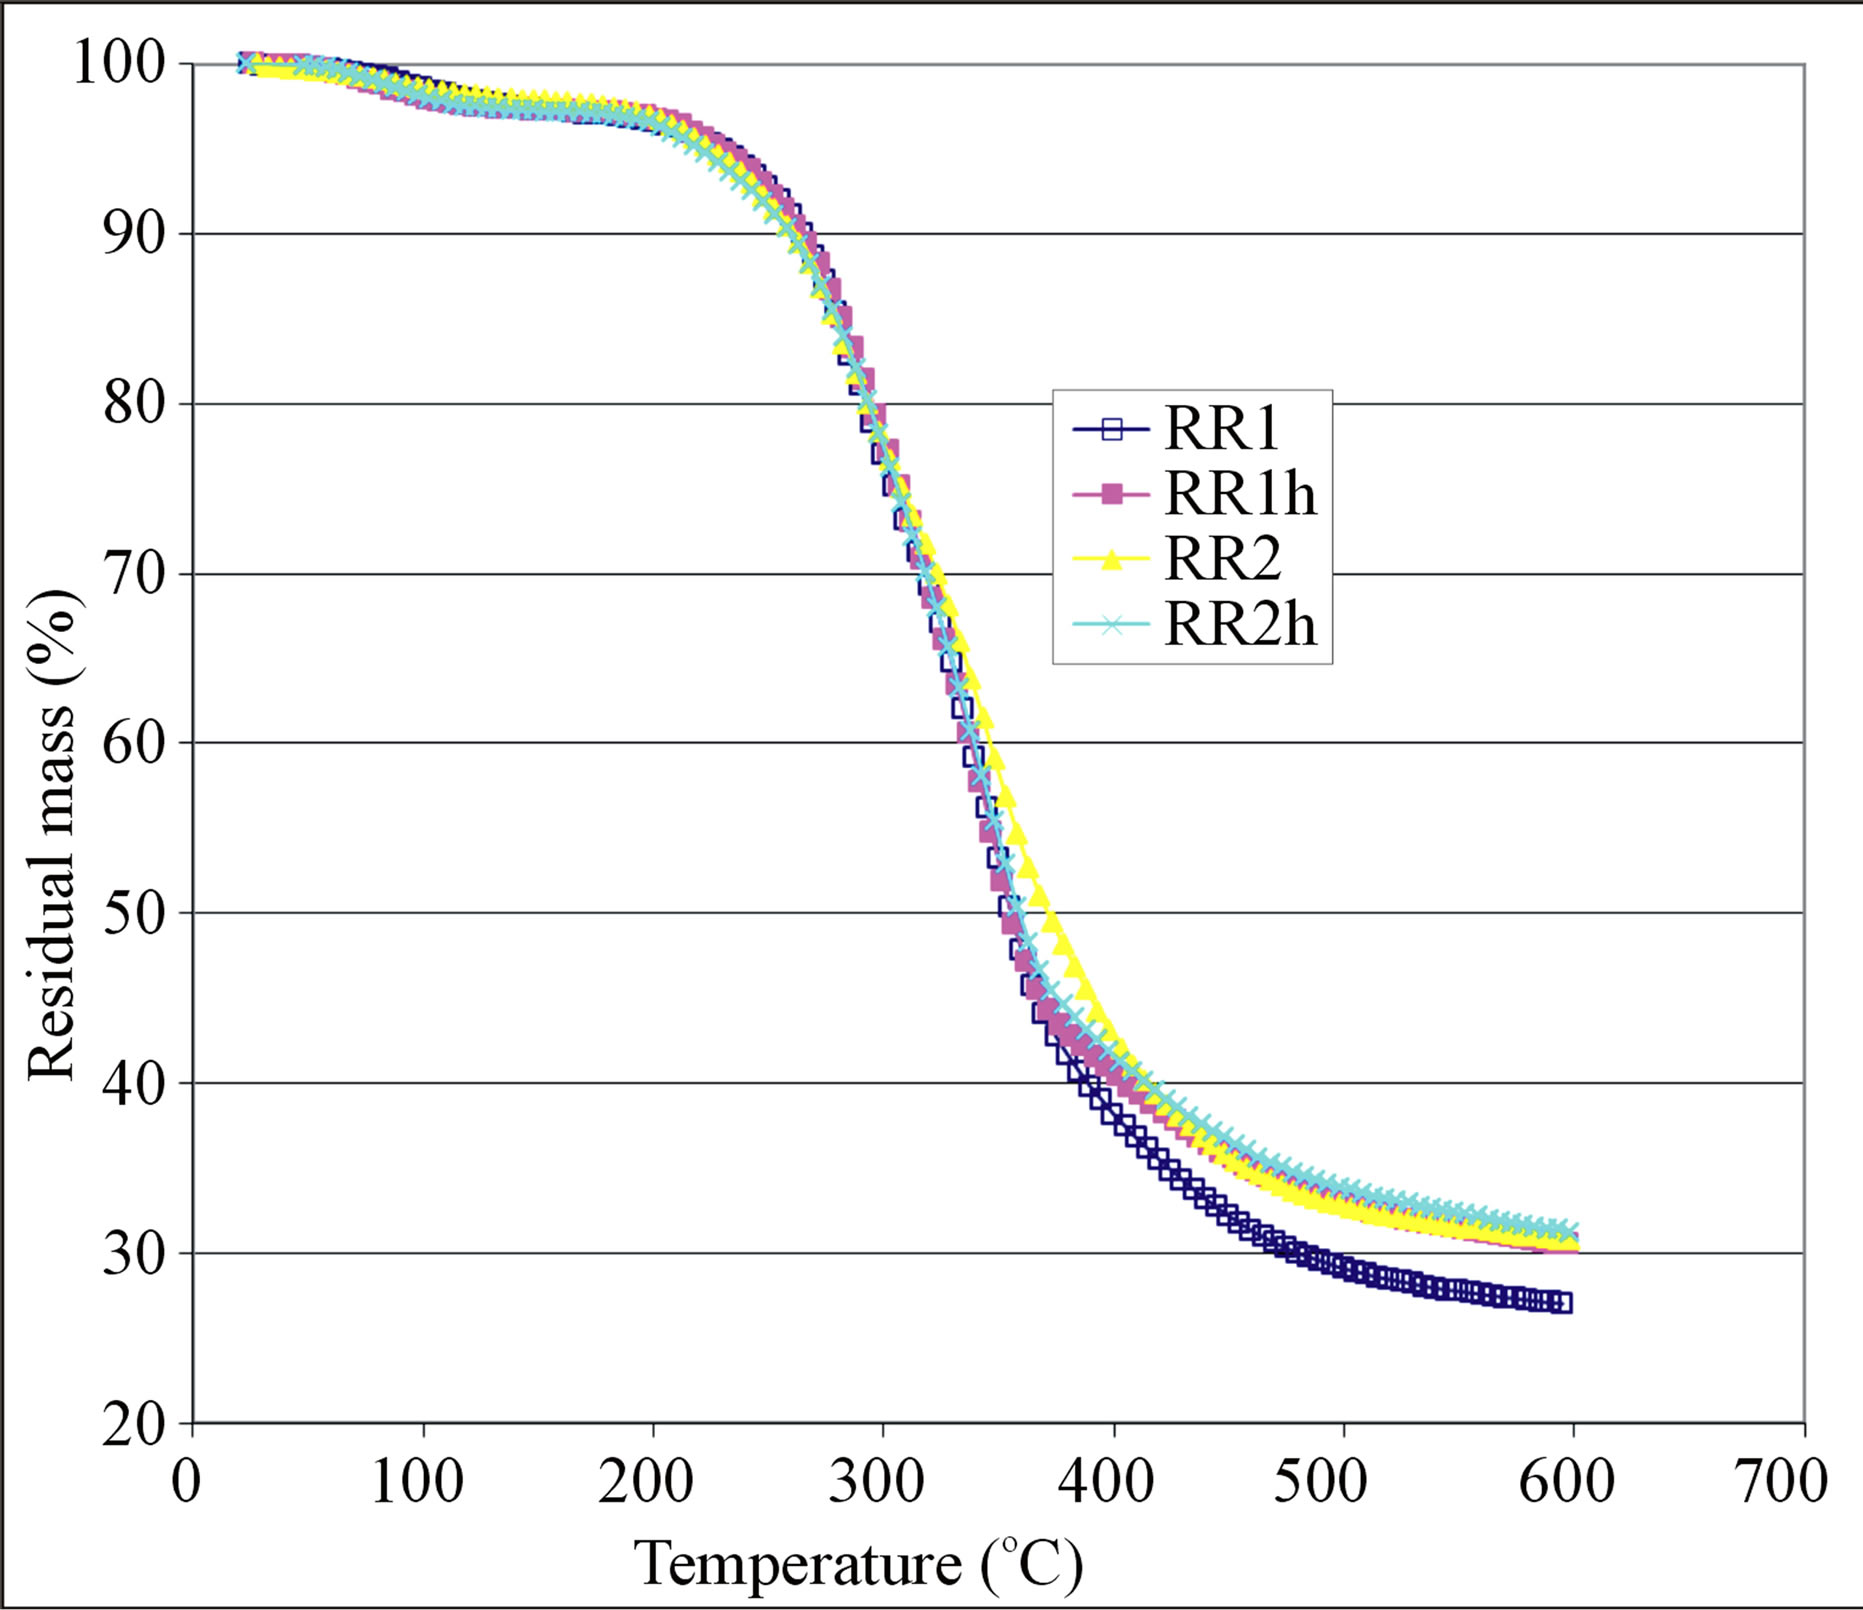
Figure 2. Pyrolysis thermograms of crude and hexaneextracted olive pomace samples given in group (II).
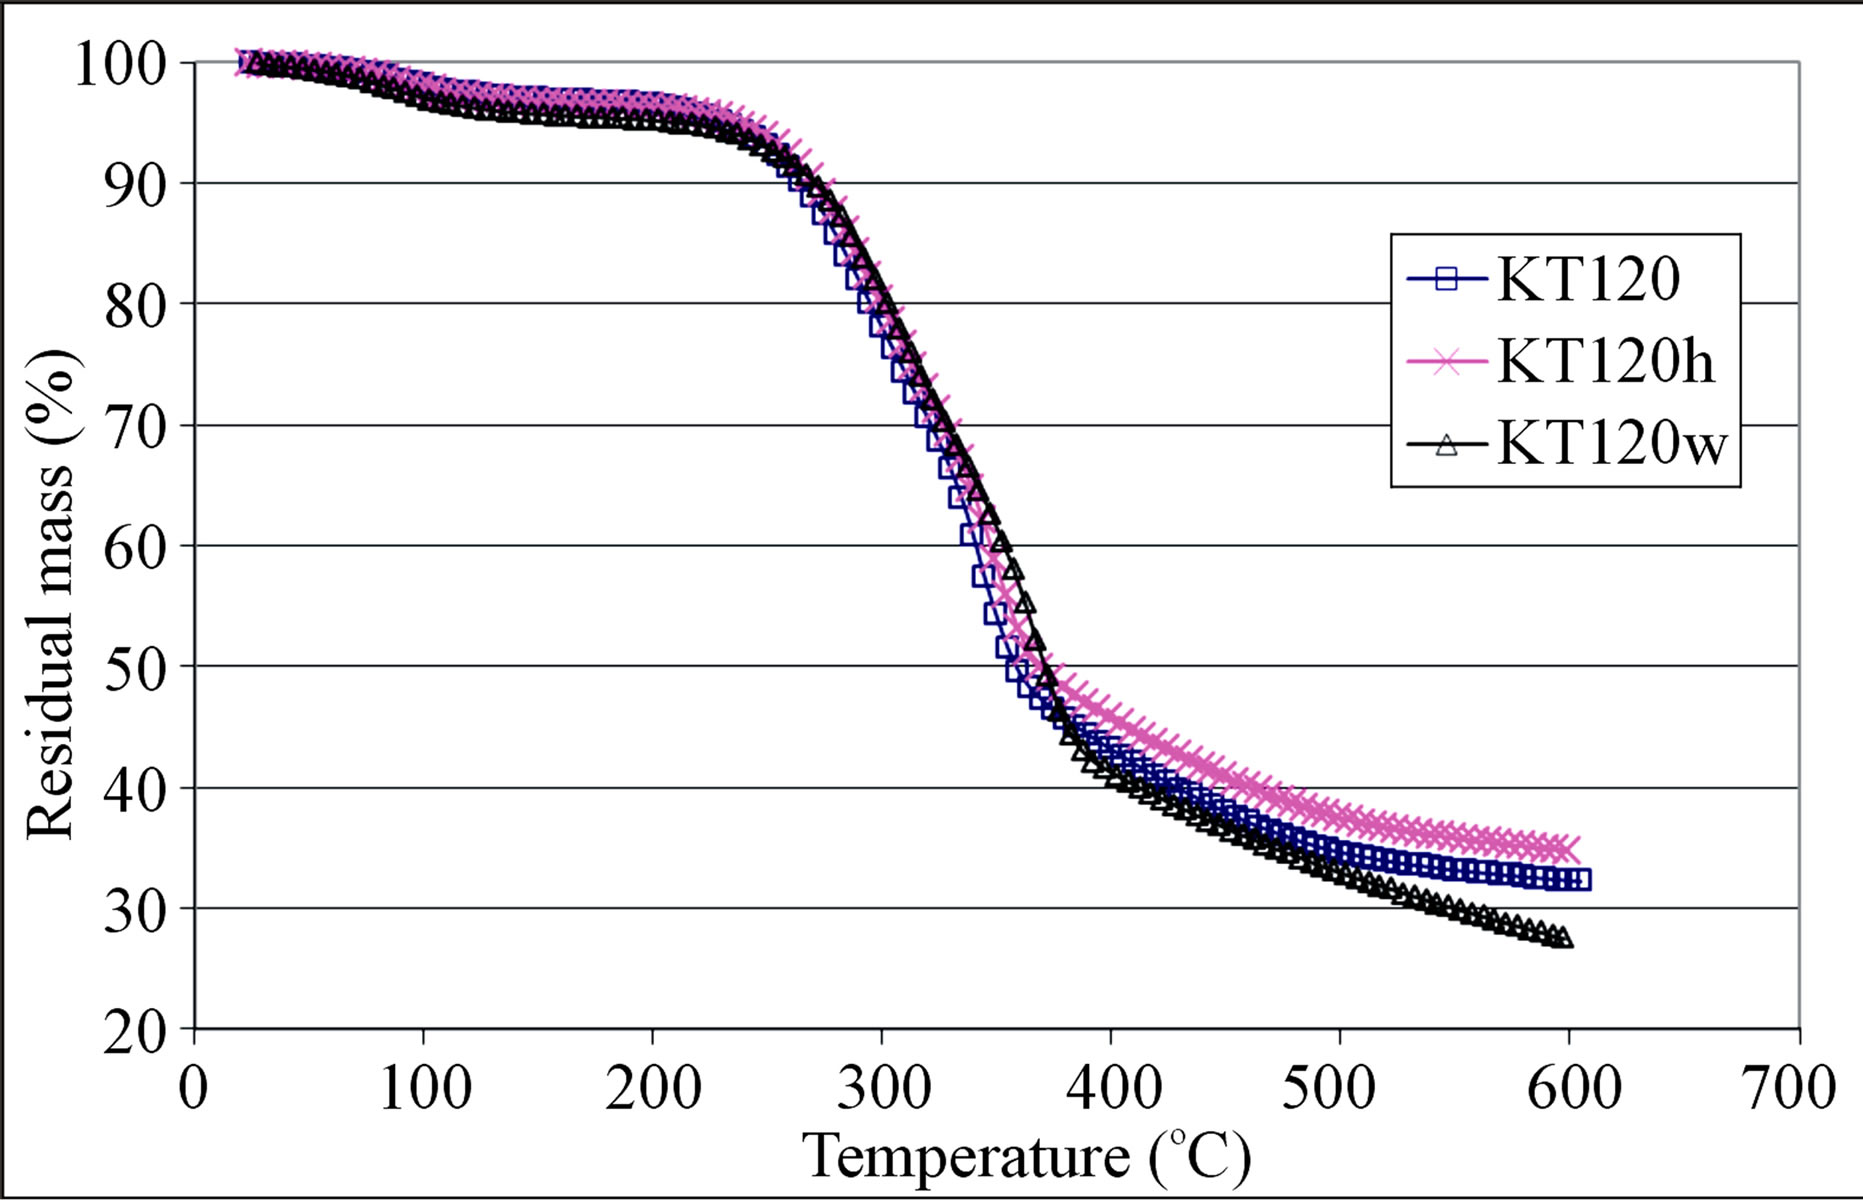
Figure 3. Pyrolysis thermograms of crude, hexane-extracted, and water-extracted olive pomace samples of group III.
shows large mass loss in the temperature range 200 - 400˚C which is believed to be due to loss of high molecular mass volatiles and major degradation of the structural components of the olive pomace, namely: hemicellulose, cellulose, and lignin. The high temperature tailing part of the TG curve is thought to be a continuation of the slow degradation of lignin. Gaur and Reed [24] stated that hemicellulose degradation occurs between 200 and 350˚C with maximum rate of degradation at 269˚C while cellulose degradation starts above 320˚C with maximum rate of degradation at 340˚C. As with regard to lignin, its DSC (differential scanning calorimetry) curve showed flat endothermic peak at 425˚C [24]. The 200 to 300˚C temperature range is usually used for torrefaction of biomass in order to improve its heat value and to reduce its moisture content. In this torrefaction process, the hemicellulose of a biomass is degraded and most of its cellulose and lignin content is maintained [29]. Careful examination of the TG curves given in Figures 1-3 had led us to locate four points on the TG curve. The first point (T1) represents the temperature at which an abrupt mass loss takes place; the second point (T2) is an inflection point at about 360˚C; the third point occurs at temperature T3 which represents a significant change in the slope of the TG curve (the rate of mass loss becomes slower after this temperature); the fourth point is symbolized by T4 which represents the termination temperature of the TG run. The values of these temperatures and the percentages of the remaining mass (M1 to M4) of the test sample at these temperatures are given in Table 12 for both the crude and the exhausted olive pomace. The value of M4 in this table is the residual mass percentage of the sample at the run termination temperature. By reference to Table 12, the data pair T1 and M1 indicates that the mass loss is less than 10% when the sample is heated from room temperature up to about 250˚C. This mass loss might be due to evolution of moisture and light organic volatiles trapped in the pores of the sample in addition to any surface moisture. The data pair T2 and M2 indicates that about 50% of the sample mass is lost when its temperature attains a value of about 360˚C. Also a change in the magnitude of the rate of mass loss takes place at this temperature which could be due to the occurrence of a significant change in the ratio of the lignocellulosic structural components at that temperature. The data pair T3 and M3 indicates that about 66% of the sample mass is lost at a temperature of about 508˚C. Also at temperature T3 the rate of mass loss becomes slower; most likely due to the dominance of lignin in the remaining fraction of the sample which resists pyrolysis. The final data pair to be considered according to this line of reasoning is the T4 and M4 pair. T4 is the temperature at which the TG run is terminated which amounts to about 600˚C. At this temperature the percentage of the residual mass (M4) is nearly 31%. It is worth mentioning that, on the average, the difference between the residual masses M3 and M4 is nearly 3% over a temperature range of about 90˚C. This observation implies that the pyrolysis process is slowly approaching its end. Another conclusion that can be drawn from the M3 and M4 data given in the last two columns of Table 12 is that, in general, the hexane-extracted samples have higher remaining mass percentage when compared with their un-extracted counter parts. This observation seems to hold true for the TG segment located between temperatures T3 and T4 as can be seen in Figures 1 and 2. We explain this observation on the basis that extraction by hexane frees the sample from its content of the easily pyrolyzed fat material; thereby concentrates the sample content with the pyrolysis-resistant lignin.
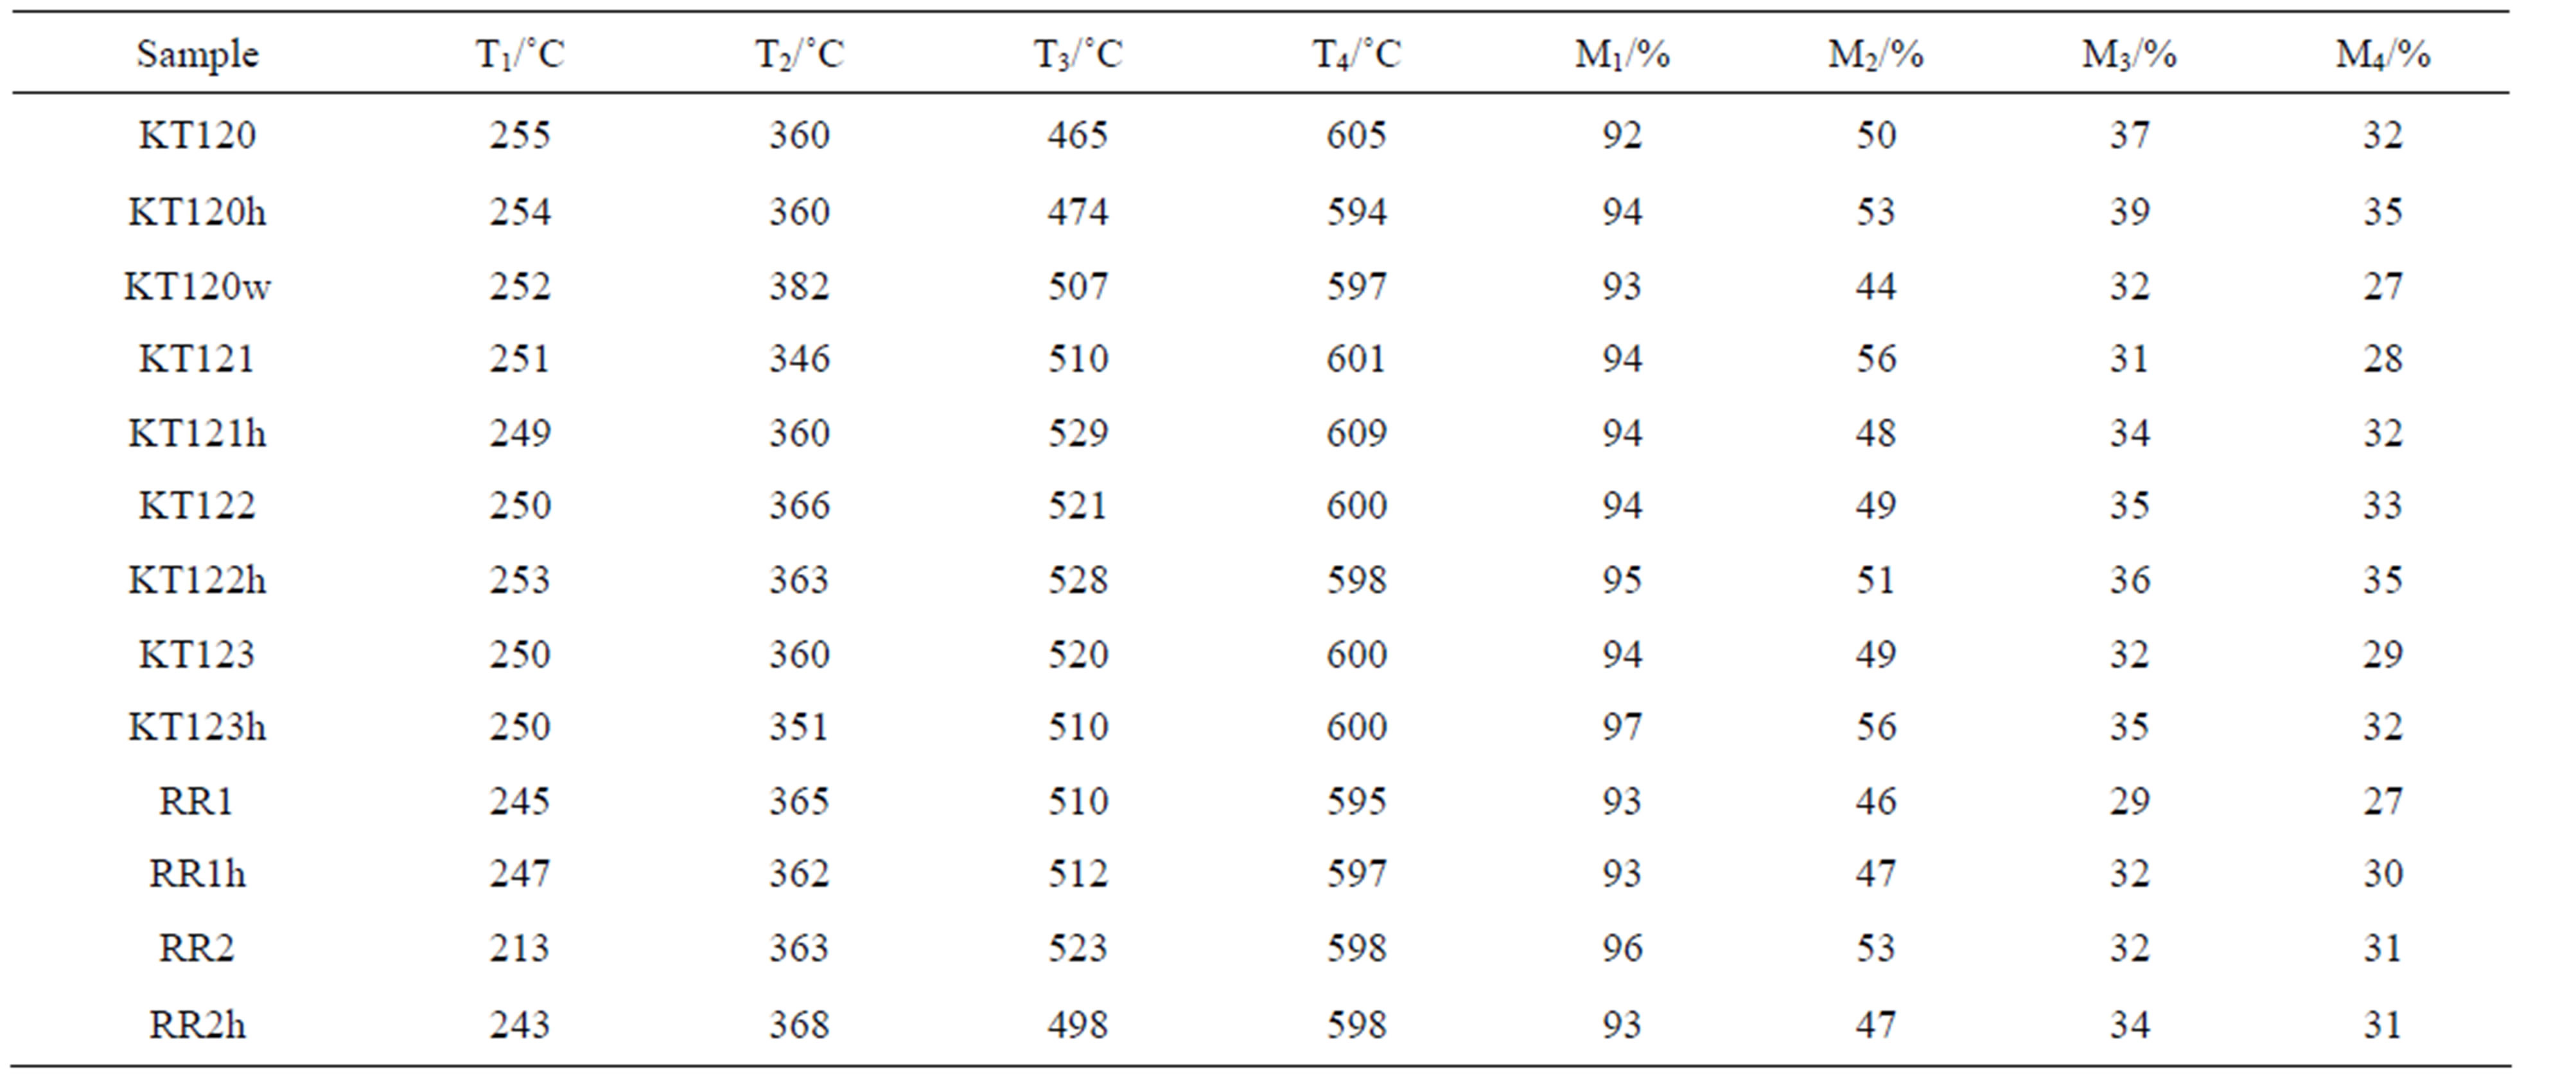
Table 12. The values of temperatures and the percentages of the remaining masses at four notable points on the TG pyrolysis thermograms of olive pomace samples.
In order to explore the difference between extraction by a polar solvent and extraction by a nonpolar solvent, we subjected a crude olive sample for extraction by distilled water and extraction by hexane. Sample KT120 was used for this purpose. In this case three TG curves can be compared; one for the crude sample (KT120), one for the hexane-extracted sample (KT120h), and one for the water-extracted sample (KT120w). The graph given in Figure 3 shows the TG thermograms of these samples. If we focus our attention on the segments of the TG curve between 350 and 600˚C, we find that the segment of sample KT120h lies above that of sample KT120. This observation is in line with our previous observation concerning the samples of groups I and II. On the other hand, we find the segment of sample KT120w lies below the other two segments. To explain this observation, we consider the following logical consequences of exposing a crude olive sample to water. When extracted by water, the crude olive pomace is freed from water soluble soil and other debris objects that originate from the storage yards of olive mills. In addition to this, dissolution of some inorganic matter and certain fractions of hemicellulose can take place. All these processes are believed to enhance the pyrolysis of the residue of the water-extracted pomace. By carrying TG runs at three different heating rates, García et al. [30] reported that the waterleached olive pomace and the un-leached pomace gave different thermal degradation rates in both inert and oxidizing atmospheres. Our results for KT120 and KT120w seem to be in agreement with this literature information.
3.8. Proximate Analysis of Olive Pomace
The determination of the proximate analysis of a fuel is necessary when a fuel is assessed for energy considerations. The quantities usually reported for the proximate analysis of a fuel are the percentages of moisture, volatile matter, fixed carbon, and ash. The traditional method for finding the percentages of volatile matter and fixed carbon by a non-automated method is the ASTM method [31]. In order to avoid the longer time of the ASTM method, the TGA technique is now used for getting the percentages of moisture, volatile matter, and fixed carbon [32]. An article devoted to determination of biomass proximate analysis by using thermogravimetry has appeared very recently [33].In the present study we were unable to carry out the usual steps of holding times and switching between inert and oxidizing atmospheres during a TG run due to a temperature limitation of not exceeding 600˚C. To do the best we can, we have used the TG pyrolysis curve of a test sample to estimate its % moisture (% w), % volatile matter (% VM), and % of fixed carbon (% FC) according to the following equations.
 (8)
(8)
 (9)
(9)
The symbols M3 and M4 appearing in these two equations are residual masses with values given in Table 12. The values of % ash were taken from Tables 4 and 5. The calculated values of % VM and % FC are reported in Table 13. The values of % w were obtained from the TG curve. The value of % w for a given sample was found to be nearly half the percentage of the mass lost from room temperature to T1 (which is 100 − M1). The average value of the ratio (100 − M1)/%w is given by Equation (10).
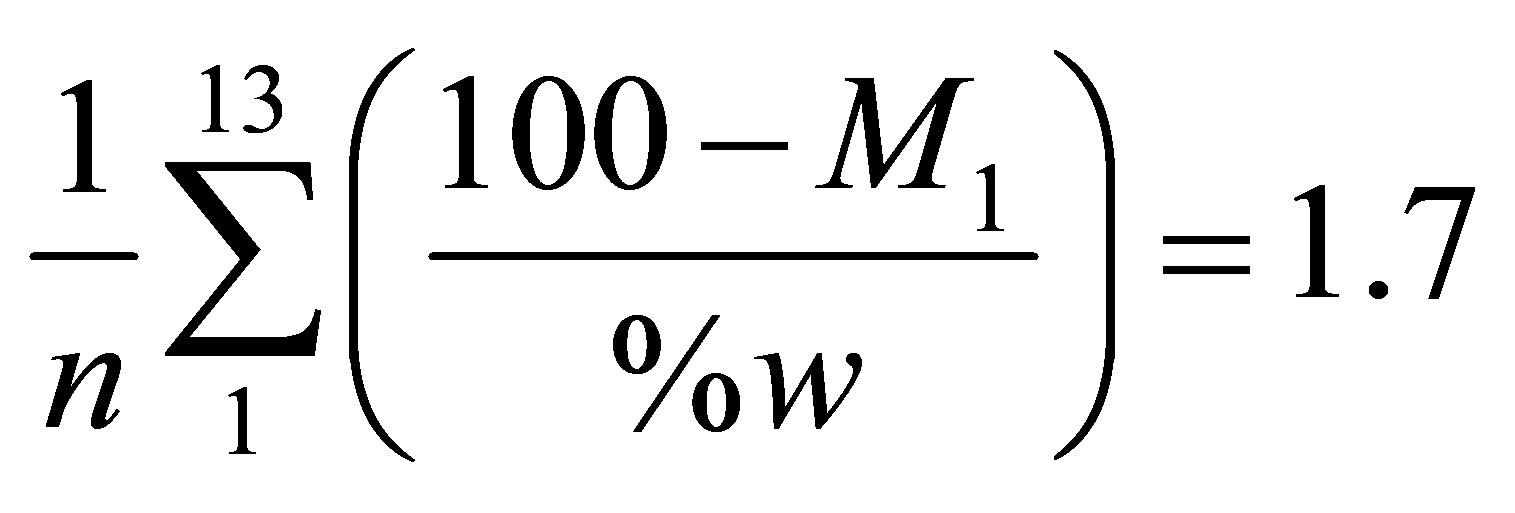 (10)
(10)
where n is the number of samples (n = 13)and M1 is a residual mass with values given in Table 12.
Inorder to check the adequacy of applying Equations (8) and (9) for calculating the values of % VM and % FC given in Table 13, we searched the literature to find data on proximate analysis of lignocellulosic biomass and to find empirical equations that predict the value of GCV from a known proximate analysis. As with regard to reported proximate analysis, Al-Widyan et al. [4] have reported the values % VM = 86.51, % FC = 10.7, and % ash = 2.76% on dry basis for briquettes of a Jordanian crude olive pomace sample. The values of % VM and % FC as reported in reference [4] are somewhat inconsistent with the values usually reported for a lignocellulosic biomass. The % VM is higher than usual and the % FC is lower than usually reported for lignocellulosic biomass as can be seen in references [25,34] and the literature data cited in references [28,35]. As examples of literature values we present two examples. For the first example we have %VM of 80.94, 79.10, 77.77; %FC of 18.50, 15.30, 17.92; %ash of 0.56, 5.60, and 4.31 on dry basis for pit, pulp, and residue of olive pomace, respectively [25]. For the second example we present the values % VM = 76.3, % FC = 19.2, %ash = 4.5 on dry basis for olive pomace samples [34]. In our case most of the values of % FC are substantially higher than the literature values while the values of %VM are somewhat close to literature values given in the two examples. Despite the fact that the sum of the percentages of VM, FC, and ash reported in Table 13 is very close to the theoretical value of 100%, we tried to look for another avenue that could support our findings given in Table 13. For this purpose we have chosen two empirical correlation formulas used for predicting the gross calorific value of a fuel from its given proximate analysis. The first correlation formula we tried is a versatile correlation formula, reported by-
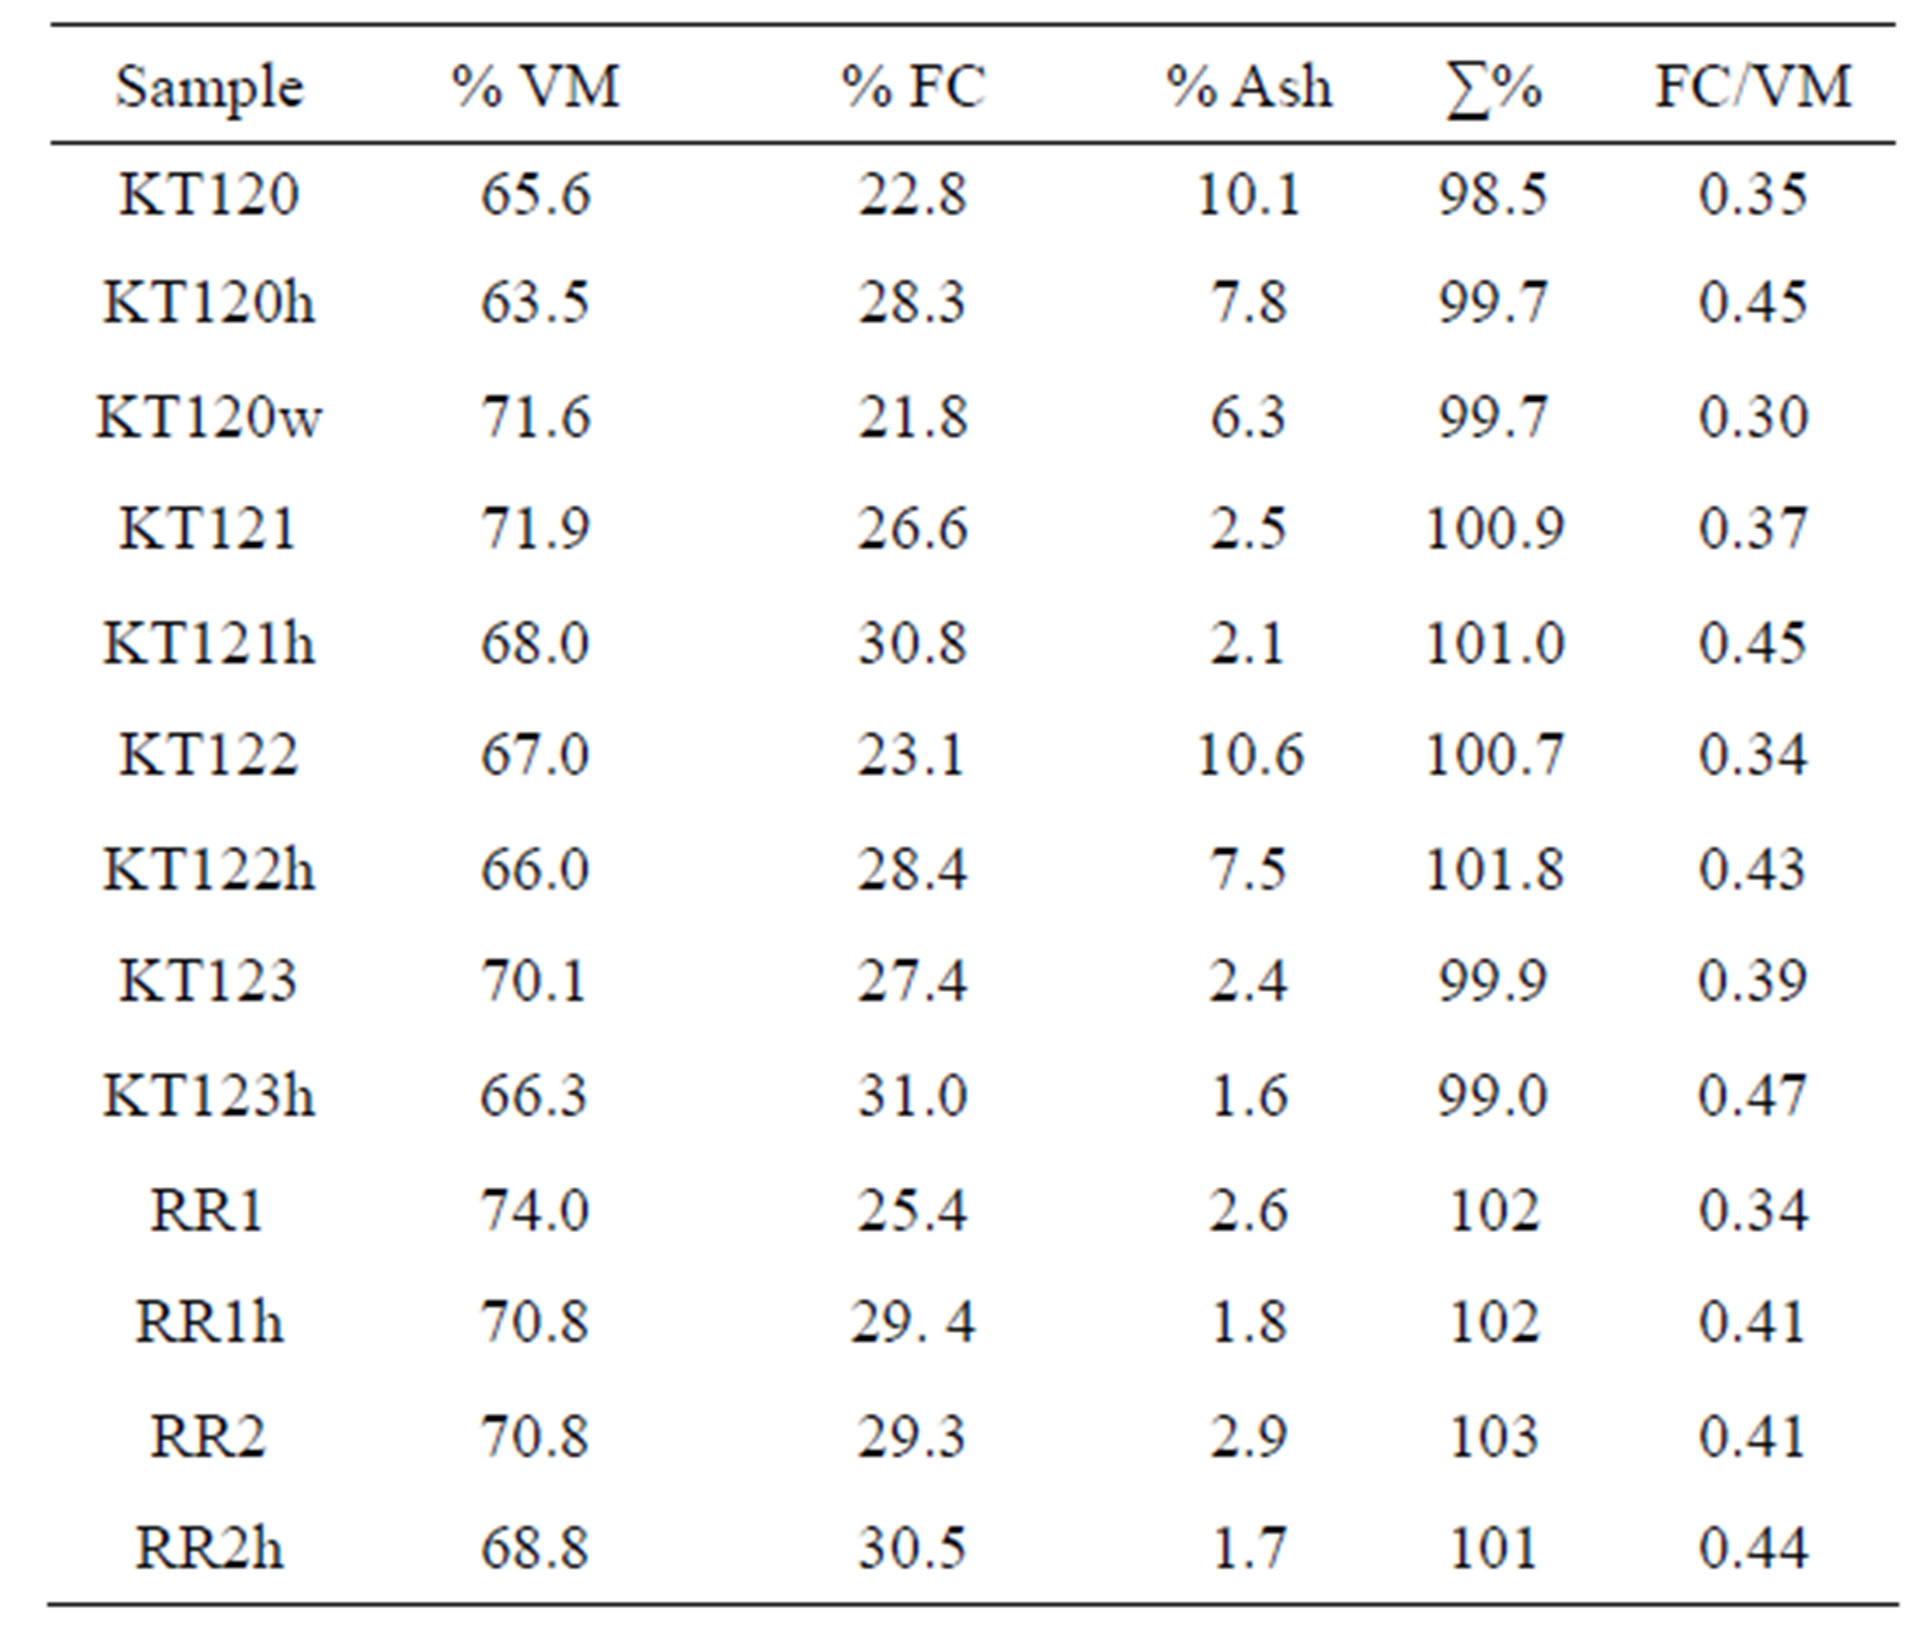
Table 13. The proximate analysis of crude, hexane-extracted, and water-extracted olive pomace samples on dry basis.
Parikh et al. [35], which gave minimum error levels over 450 data points. This correlation formula is given by Equation (11) while its error measures are given by Equations (12) and (13).
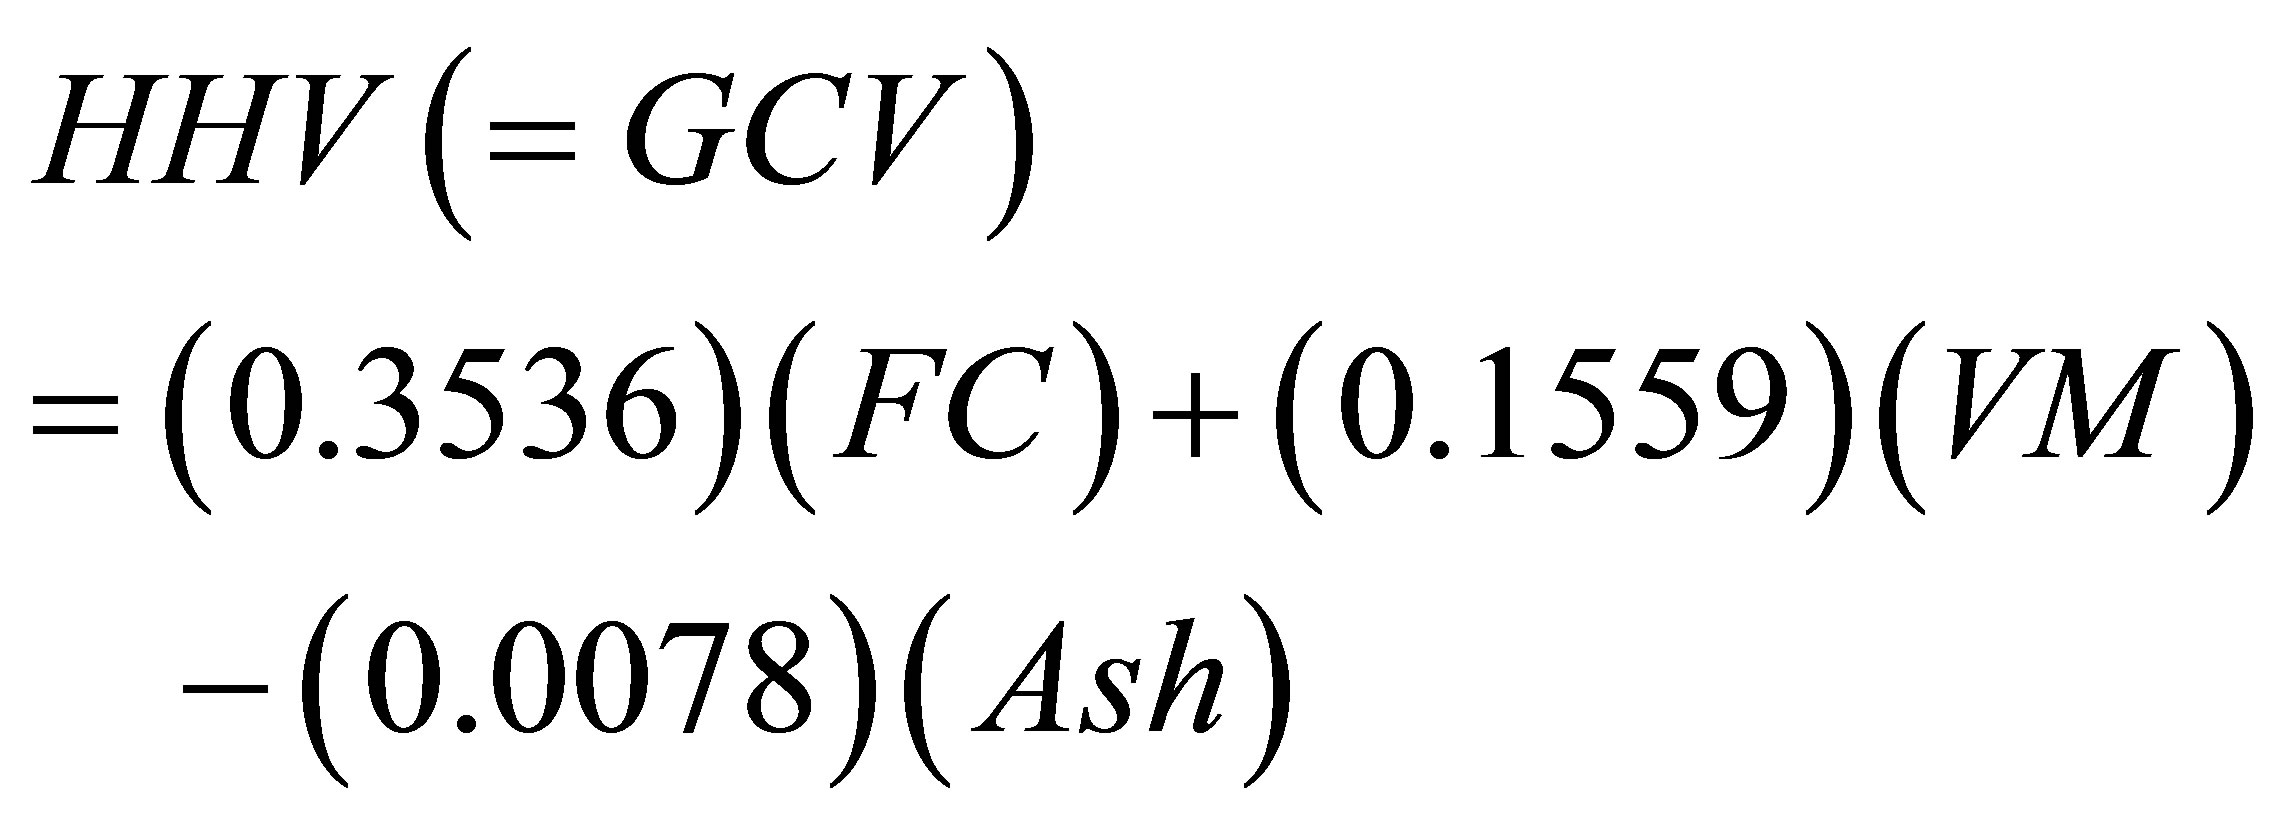 MJ/Kg (11)
 (12)
(12)
 (13)
(13)
where MAE and MBE are the abbreviations defined by Equations (5) and (6) in Section 3.6. The abbreviation HHVc stands for the calculated higher heating value while the abbreviation HHV stands for the measured value. In the present study we used the abbreviation GCV instead of the HHV; but both denote the same quantity.
The values of the average absolute error and the average bias error with respect to the measured values of HHV, as reported by Parikh et al. [35], are 3.74% and 0.12%, respectively. We have applied Equation (11) to calculate a value for the GCV by inserting the values of % VM and % FC given in Table 13 for 13 data points (n = 13 in Equations (12) and (13)). The measured GCV data given in the second column of Table 11 were used in calculating the error parameters defined by Equations (12) and (13). The average absolute error and the average bias error were found to be 6.49% and −0.54%, respectively. This finding gives support to the adequacy of the TG procedure that generated the values of % VM and % of FC. The second empirical formula we used was reported by C.Y. Yin [28]. The formula is given by Equation (14).
 (14)
(14)
By inserting the values of % VM and % FC given in Table 13, we calculated 13 HHV. These calculated values together with the measured values of GCV, given in Table 11, were inserted in Equations (12) and (13) to find the values of MAE and MBE associated with the predictions of Equation (14). The values were found to be 5.57% and −2.98% for MAE and MBE, respectively. As a comment, the correlation formula given in Equation (14) has a lower prediction accuracy when compared with Equation (11). The overall conclusion to be drawn from the application of Equation (11) is that the proximate analysis given in Table 13 has been justified.
The values reported in the last column of Table 13 represent the ratio of % fixed carbon divided by % volatiles. It is evident from this table that the exhausted olive pomace samples have their ratios of % fixed carbon to % volatiles higher than those of their parent crude pomace samples. The final point concerning the data of Table 13 has to do with proximate analysis for specification purposes. Based on the data given in Table 13 the average proximate analysis of the crude olive pomace samples is 69.9% volatiles, 25.8% fixed carbon and 5.2% ash and the proximate analysis of the exhausted olive pomace (sample KT120w not included) is 67.2% volatiles, 29.7% fixed carbon, and 3.8% ash.
4. Acknowledgments
The authors acknowledge the financial support of Yarmouk University since all the paid services at RSS and UJ were part of the fund allocated for project No. 28/ 2010. The authors would like to thank Mrs. Leena AlOtoom and Mrs. Nisreen Al-Khateeb (RSS) for their assistance in the GCV measurements, Miss Ruba Zaloom (UJ) for her assistance in the TG measurements and Miss Mona Tayyem (UJ) for her assistance in the elemental analysis measurements.
REFERENCES
- Department of General Statistics, “Agricultural Statistics,” Jordan, 2012.
- S. M. Al-Shdeifat and H. A. Al-Bdour, Annual Report, National Center for Scientific Research and Agricultural Extension, Jordan, 2009.
- K. M. Tawarah, “Thermochemical Characterization of Jordanian Olive Pomace,” Manuscript under Preparation for Publication.
- M. I. Al-Widyan, G. Tashtoush and A. I. Khdair, “Briquettes of Olive Cake as a Potential Source of Thermal Energy,” Journal of Solid Waste Technology and Management, Vol. 28, No. 2, 2002, pp. 51-59.
- M. S. Haddadin, J. Haddadin, O. I. Arabiyat and B. Hattar, “Biological Conversion of Olive Pomace into Compost by Using Trichoderma Harzianum and Phanerochaete Chrysosporium,” Bioresource Technology, Vol. 100, No. 20, 2009, pp. 4773-478. http://dx.doi.org/10.1016/j.biortech.2009.04.047
- M. S. Haddadin and S. M. Abdulrahim, “Solid State Fermentation of Waste Pomace from Olive Processing,” Journal of Chemical Technology and Biotechnology, Vol. 74, No. 7, 1999, pp. 613-618. http://dx.doi.org/10.1002/(SICI)1097-4660(199907)74:7<613::AID-JCTB80>3.0.CO;2-8
- N. Mameri, F. Aioueche, D. Belhocine, H. Grib, H. lounici and D. L. Piron, “Preparation of Activated Carbon from Olive Mill Solid Residue,” Journal of Chemical Technology and Biotechnology, Vol. 75, No. 7, 2000, pp. 625-631. http://dx.doi.org/10.1002/1097-4660(200007)75:7<625::AID-JCTB257>3.0.CO;2-9
- M. L. Cayuela, P. D. Millner, S. L. Meyer and A. Roig, “Potential of Olive Mill Waste and Compost as BioBased Pesticides against Weeds, Fungi, and Nematodes,” Science of the Total Environ, Vol. 399, No. 1-3, 2008, pp. 8-11.
- K. R. Cliffe and S. Patumsawad, “Co-Combustion of Waste from Olive Oil Production with Coal in a Fluidized Bed,” Waste Management, Vol. 21, No. 1, 2001, pp. 49- 53. http://dx.doi.org/10.1016/S0956-053X(00)00057-X
- D. Fisher, “Types of Olive Oil for Soap Making Recipes,” 2013. http://candleandsoap.about.com/od/soapmakingoils/a/Types-Of-Olive-Oil-For-Soap-Making-Recipes.htm
- F. Pagnanellia, S. Mainellia, F. Vegli and L. Toroa, “Heavy Metal Removal by Olive Pomace: Biosorbent Characterisation and Equilibrium Modelling,” Chemical Engineering Science, Vol. 58, No. 20, 2003, pp. 4709- 4717. http://dx.doi.org/10.1016/j.ces.2003.08.001
- F. Pagnanelli, L. Toro and F. Veglio, “Olive Mill Solid Residues as Heavy Metal Sorbent Material: A preliminary Study,” Waste Management, Vol. 22, No. 8, 2002, pp. 901-907.
- P. S. Moral and M. V. Méndez, “Production of Pomace Olive Oil,” Grasas y Aceites, Vol. 57, No. 1, 2006, pp. 47-55.
- M. Abu-Qudais, “Fluidized-Bed Combustion for Energy Production from Olive Cake,” Energy, Vol. 21, No. 3, 1996, pp. 173-178. http://dx.doi.org/10.1016/0360-5442(95)00101-8
- M. Abu-Qudais and G. Okasha, “Diesel Fuel and OliveCake Slurry: Atomization and Combustion Performance,” Applied Energy, Vol. 54, No. 4, 1996, pp. 315-326. http://dx.doi.org/10.1016/0306-2619(95)00077-1
- T. M. Alkhamis and M. M. Kablan, “Olive Cake as an Energy Source and Catalyst for Oil Shale Production of Energy and Its Impact on the Environment,” Energy Conversion & Management, Vol. 40, No. 17, 1999, pp. 1863- 1870. http://dx.doi.org/10.1016/S0196-8904(99)00023-0
- M. I. Al-Widyan, H. F. Al-Jalil, M. M. Abu-Zreig and N. H. Abu-Hamdeh, “Physical Durability and Stability of Olive Cake Briquettes,” Canadian Biosystems Engineering, Vol. 44, 2002, pp. 341-345.
- Y. H. Khraisha, M. A. Hamdan and H. S. Qalalweh, “Direct Combustion of Oive Cake Using Fluidized Bed Combustor,” Energy Sources, Vol. 21, No. 4, 1999, pp. 319-327. http://dx.doi.org/10.1080/00908319950014803
- S. Meziane, H. Kadi and O. Lamrous, “Kinetic Study of Oil Extraction from Olive Foot Cake, “ Grasas y Aceites, Vol. 57, No. 2, 2006, pp. 175-179.
- S. Kmieciak, S. Meziane, H. Kadi and R. l. Uloussaoui, “Oil Extraction from Olive Foot Cake with Acidic Hexane,” Grasas y Aceites, Vol. 42, No. 1, 1991, pp. 46-50.
- “Parr 587 M-6400 Oxygen Bomb Calorimeter Operating Instruction Manual,” Chapter 7, Parr Instrument Company, Moline, 2011.
- ASTM Standard D5865-11A, “Standard Test Method for Gross Calorific Value of Coal and Coke,” Appendix X1, ASTM International, West Conshohocken, 2011.
- K. N. Marsh, “Recommended Reference Materials for the Realization of Physicochemical Properties,” Blackwell, Oxford, 1987.
- S. Gaur and T. B. Reed, “Thermal Data for Natural and Synthetic Fuels,” Marcel Dekker, New York, 1998, p. 259.
- T. Miranda, A. Esteban, S. Rojas, I. Montero and A. Ruiz, “Combustion Analysis of Different Olive Residues,” International Journal of Molecular Science, Vol. 9, No. 4, 2008, pp. 512-525. http://dx.doi.org/10.3390/ijms9040512
- “Olive Cake Pellets, Typical Specifications,” Integra Fuels, C/Conde De Aranda 8-1D 28001 Madrid.
- L. Meraz, A. Dominguez, I. Kornhauser and F. Roja, “A Thermochemical Concept-Based Equation to Estimate Waste Combustion Enthalpy from Elemental Composition,” Fuel, Vol. 82, No. 12, 2003, pp. 1499-1507. http://dx.doi.org/10.1016/S0016-2361(03)00075-9
- C. Y. Yin, “Prediction of Higher Heating Value of Biomass from Proximate and Ultimate Analyses,” Fuel, Vol. 90, No. 3, 2011, pp. 1128-1132. http://dx.doi.org/10.1016/j.fuel.2010.11.031
- W. Chun-Te and L. Far-Ching, “The Properties of Torrefied Biomass from Six Major Bamboos in Taiwan,” Proceedings of the 55th International Convention of Society of Wood Science and Technology, Beijing, 27-31 August 2012, 8 Pages.
- P. García-Ibañez, M. M. Sánchez and A. A. Cabanillas, “Thermogravimetric Analysis of Olive-Oil Residue in Air Atmosphere,” Fuel Processing Technology, Vol. 87, No. 2, 2006, pp. 103-107. http://dx.doi.org/10.1016/j.fuproc.2005.08.005
- ASTM Standard D3172, “Standard Practice for Proximate Analysis of Coal and Coke,” ASTM International, West Conshohocken, 2007. www.astm.org
- M. C. Mayoral, M. T. Izquierdo, J. M. Andres and B. Rubio, “Different Approaches to Proximate Analysis by Thermogravimetry Analysis,” Thermochimica Acta, Vol. 370, No. 1-2, 2001, pp. 91-97. http://dx.doi.org/10.1016/S0040-6031(00)00789-9
- R. Garcia, C. Pizarro, A. G. Lavin and J. L. Bueno, “Biomass Proximate Analysis Using Thermogravimetry,” Bioresources Technology, Vol. 139, 2013, pp. 1-4. http://dx.doi.org/10.1016/j.biortech.2013.03.197
- M. Varol, “Combustion and Co-Combustion of Olive Cake and Coalina Fluidized Bed,” Thesis, Middle East Technical University, Turkey, 2006.
- J. Parikha, S. A. Channiwalab and G. K. Ghosal, “A Correlation for Calculating HHV from Proximate Analysis of Solid Fuels,” Fuel, Vol. 84, No. 5, 2005, pp. 487-494. http://dx.doi.org/10.1016/j.fuel.2004.10.010
Supplementary Material
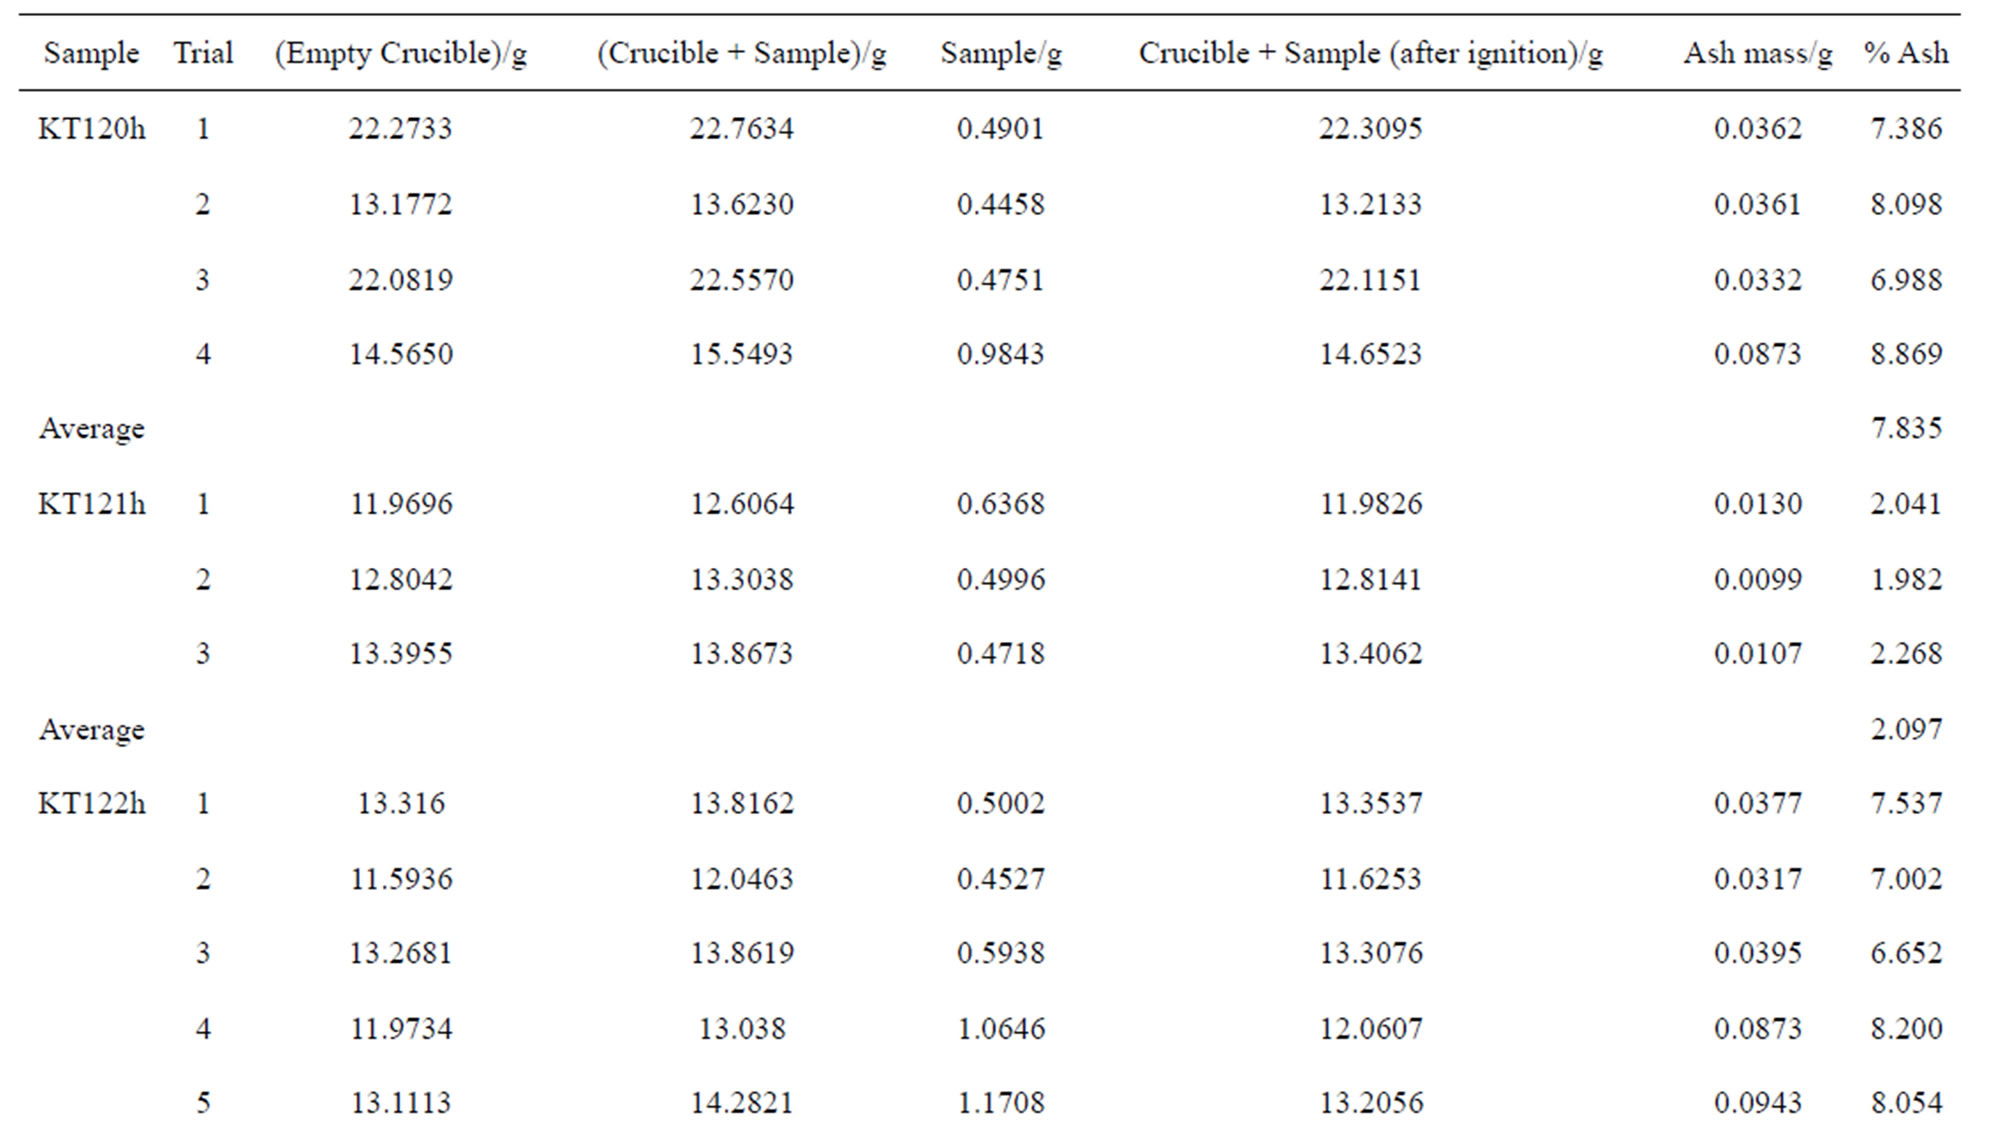

Table S1. The percentages of the ash content of the hexane-extracted and water-extracted olive pomace samples on dry basis.
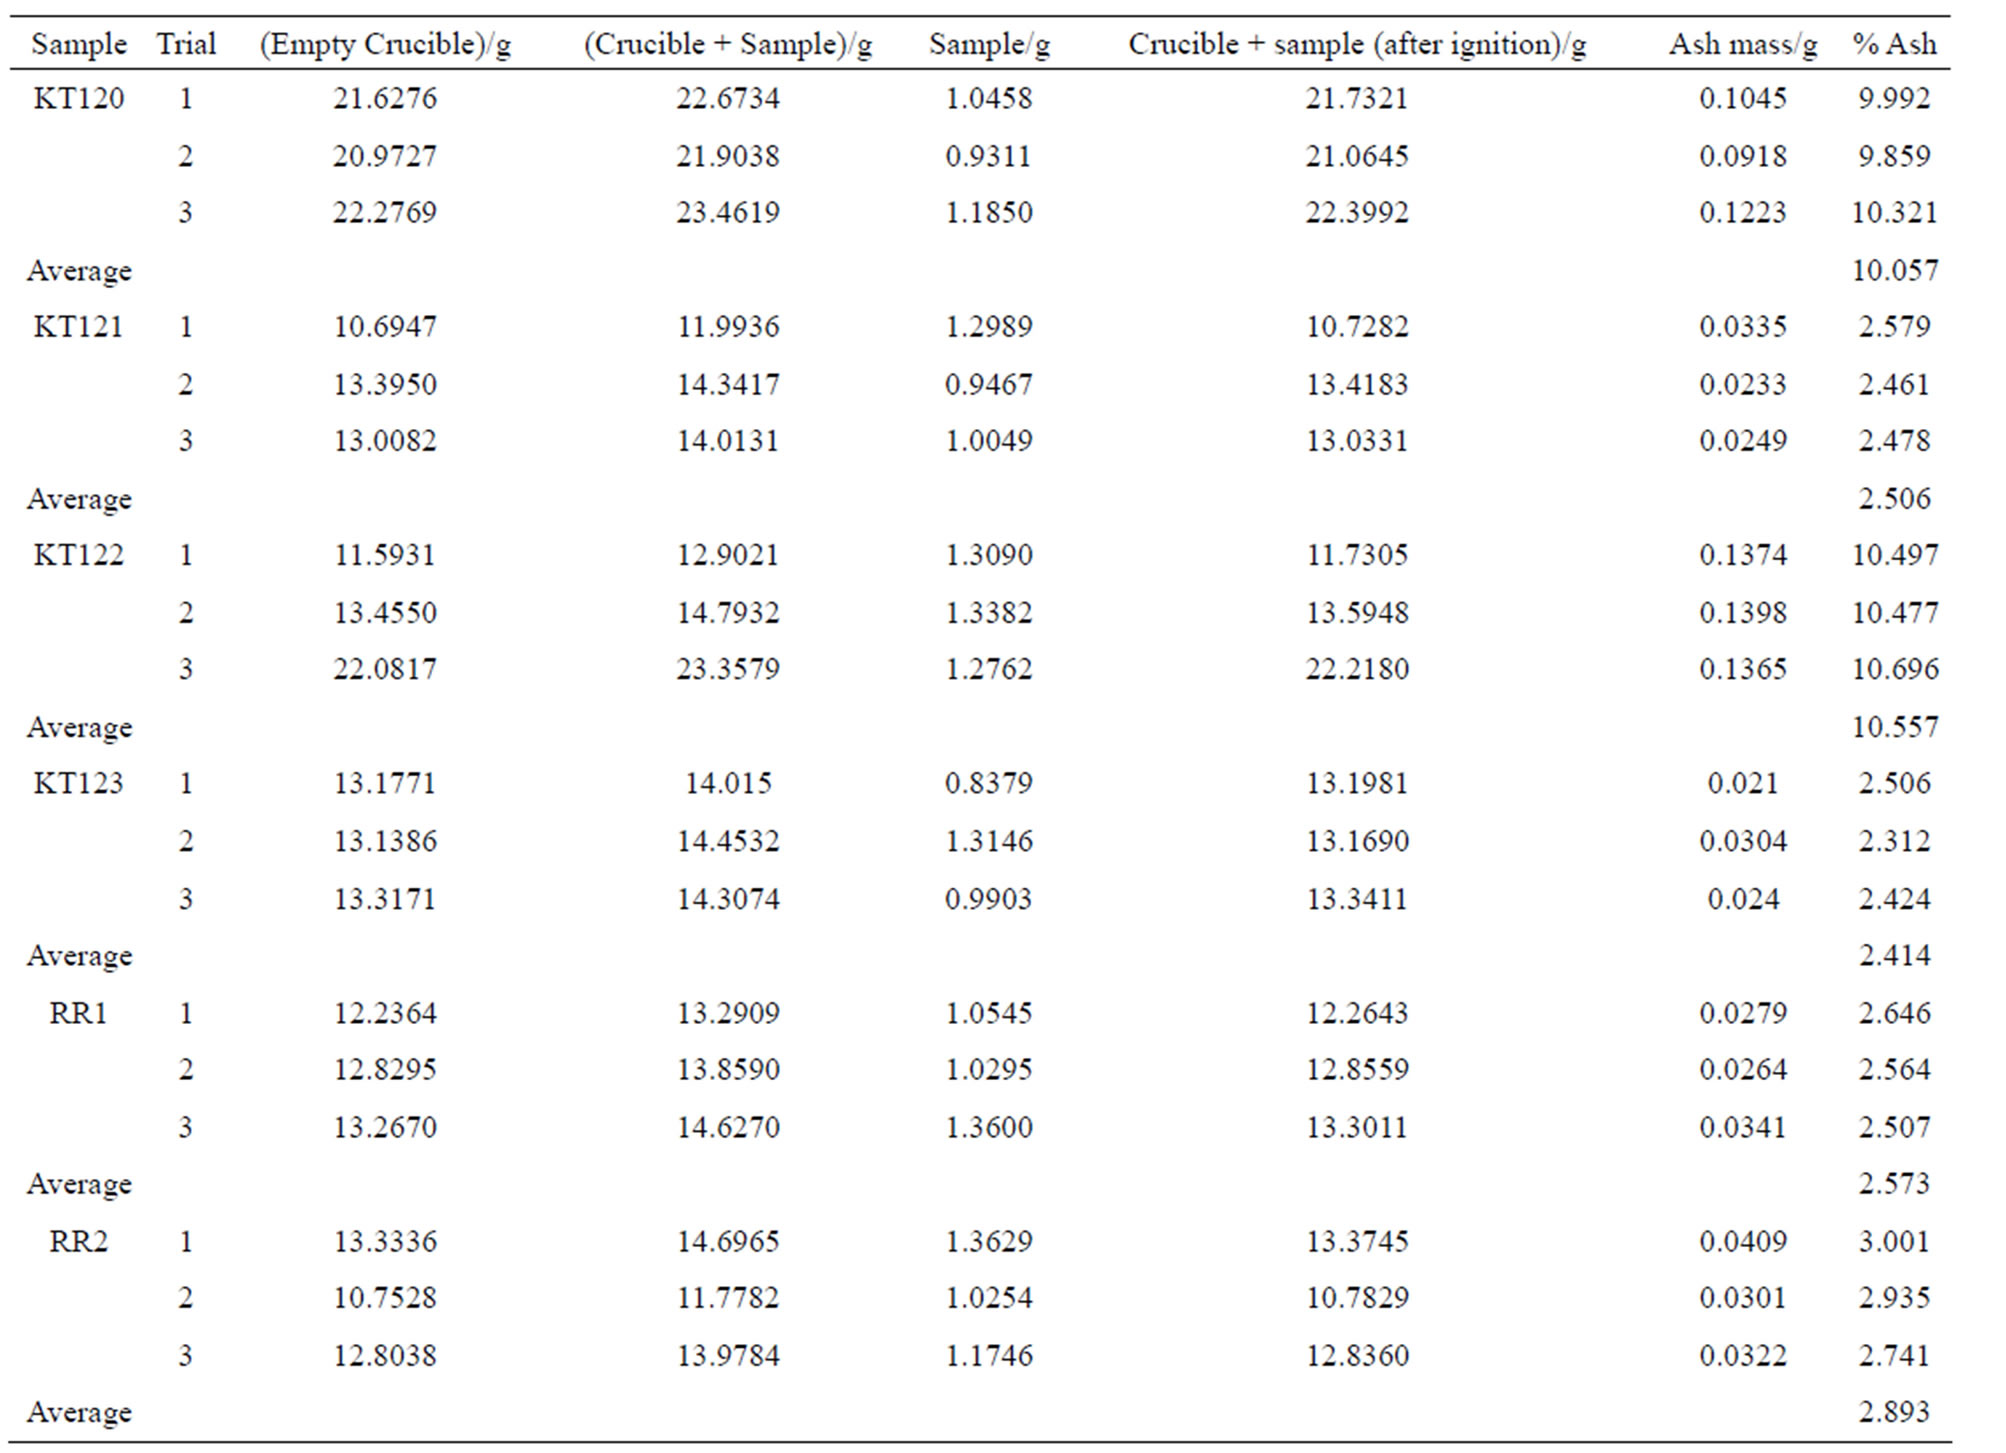
Table S2 . The percentages of ash content of the crude olive pomace samples on dry basis.
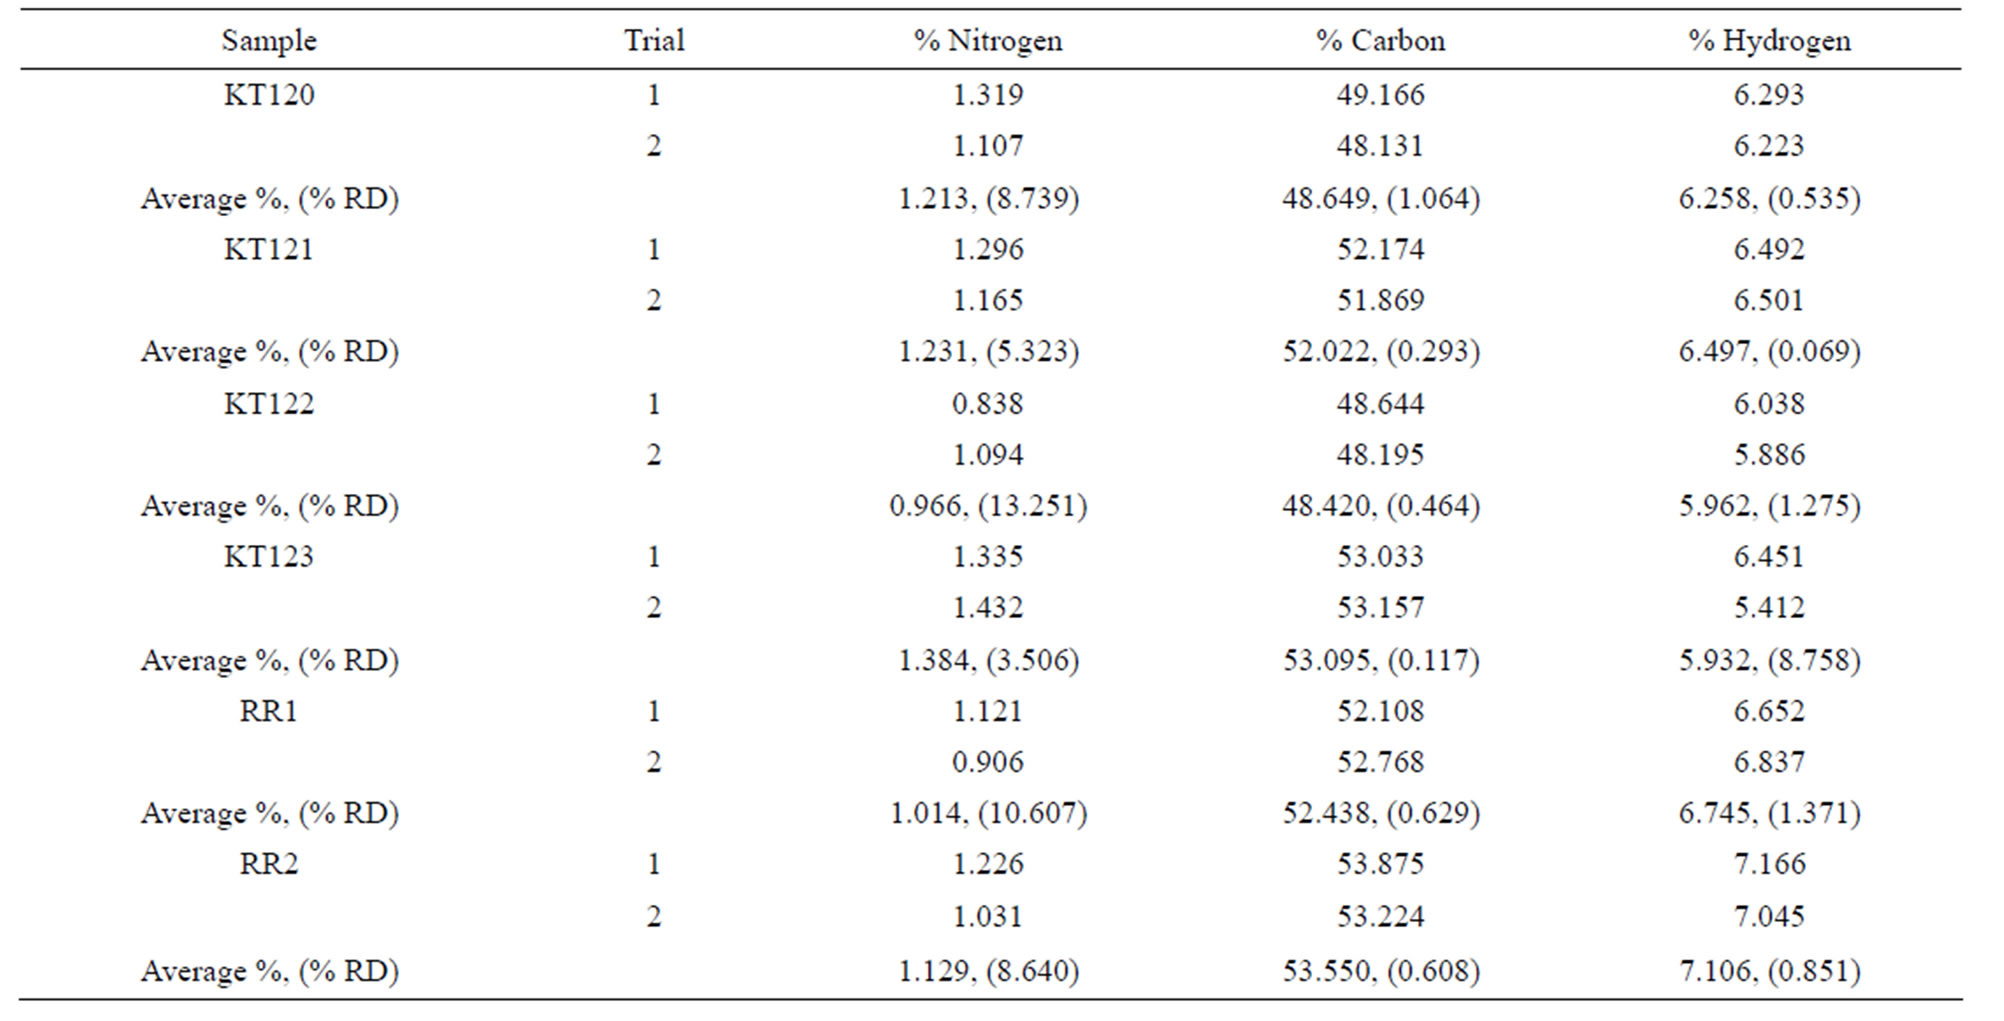
Table S3. Elemental analysis of crude olive pomace samples on dry basis. The values in parenthesis are % RD.
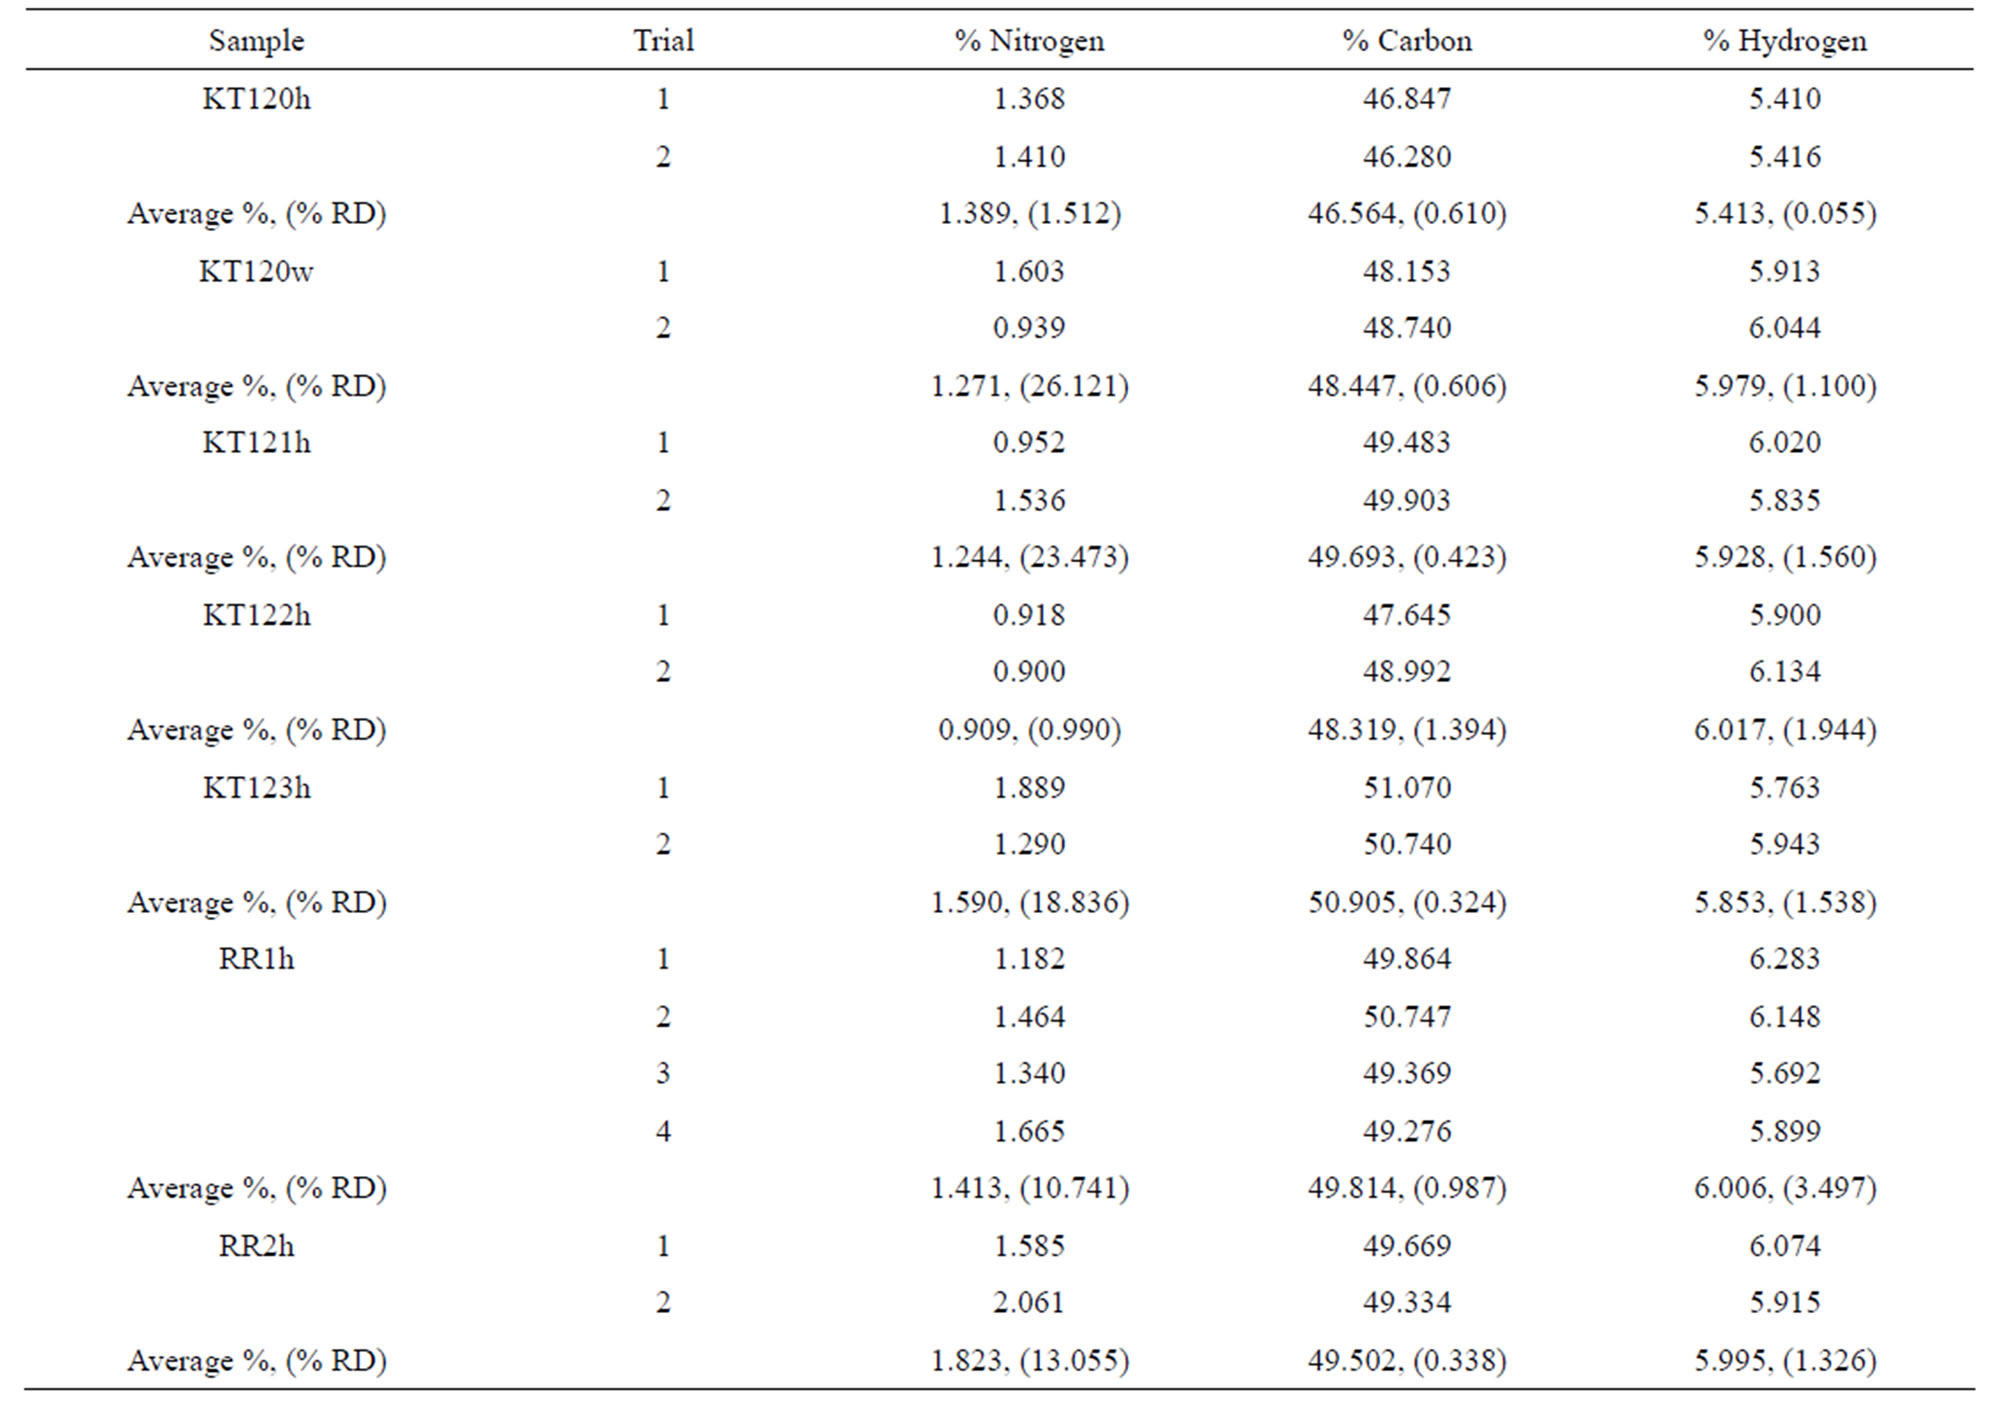
Table S4. Elemental analysis of hexane-extracted and water-extracted olive pomace samples on dry basis. The values in parenthesis are % RD.
NOTES
*Corresponding author.

