Journal of Water Resource and Protection
Vol. 2 No. 1 (2010) , Article ID: 1185 , 15 pages DOI:10.4236/jwarp.2010.21003
The Combined Approach When Assessing and Mapping Groundwater Vulnerability to Contamination
Applied Hydrogeology at the Poltecnicodi Torino, Torino, Italy
E-mai: Massimo.civita@polito.it
Received October 12, 2009; revised November 11, 2009; accepted December 4, 2009
Keywords: Groundwater Vulnerability, Contamination, GIS, SINTACS R5, Basic Method
ABSTRACT
In early 1980’s, the Italian scientific community, together with a number of institutional decision-makers, realized how urgent it was to protect natural and environmental resources. They agreed that an adequate level of scientifically organized knowledge allows the accurate planning and development of environment systems through the management and direction of the effective development process, but without stopping it. Since the special VAZAR1 project was first set up in 1984, as part of the GNDCI-CNR2 scientific context it has been the cardinal center point of Research National Program “Aquifer Vulnerability Assessment”. The problem of groundwater contamination was examined in this program for the very first time in Italy in an organic and extensive manner as a key for forecasting and prevention purposes. The Italian approaches to assessing and mapping groundwater vulnerability to contamination are essentially based on two main methodologies: 1) the GNDCI Basic Method [1,2] a HCS type approach that can be used for any type of Italian hydrogeologic situation, even where there is a limited number of data. A unified legend and symbols are also defined for each hydrogeologic level. 2) The SINTACS method [2,3], a PCSM developed for use prevalently in areas with a good data base coverage. The methodological approaches described in this paper now make up the Italian standard which has been dealt with in the recent very important Italian Law (152/993) and which are now ratified in the national guidelines [4] produced by ANPA, the Italian National Agency for Environment Protection. The methods, besides Italy [5] have been applied in several other Countries [6–10] and others.
1. Introduction
The intrinsic (i.e. natural) vulnerability of aquifers to contamination is “the specific susceptibility of aquifer systems, in their various parts and in the various geometric and hydrodynamic settings, to ingest and diffuse fluid and/or hydro-vectored contaminants, the impact of which, on the groundwater quality, is a function of space and time” [11]. The intrinsic vulnerability depends on three main factors:
1) The ingestion process and the time of travel of water (and/or a fluid contaminant) through an unsaturated zone down to the underlying saturated zone of the aquifer system;
2) The groundwater (and/or a fluid contaminant) flow dynamics in the saturated zone;
3) The residual concentration of the contaminant as it reaches the saturated zone, compared to the original concentration, which indicates the aquifer attenuation capacity of the contaminant impact.
The previously mentioned factors in turn depend on the different possible synergies of several parameters of a hydrogeologic and anthropic nature, and which are therefore subject to change in each area.
The attenuation process that takes place inside an aquifer system (i.e. soil + unsaturated zone + saturated zone) as it receives a contaminant (fluid and/or water vectored) depends on the properties and primary concentration of each contaminant but also on the reactivity of the system, which can be reduced or, in the long term, completely depleted in time. Thus, when a CSC4 impact persists for a long time or if a contaminant is persistent and mobile, the attenuation capacity of the soil dwindles and vulnerability increases in time. In these cases, groundwater protection is only aided by the time of travel, that is, by the thickness of the unsaturated zone; it is also inversely related to the ingestion capacity, vertical percolation velocity and to the mechanical dispersion that are typical of the medium. During the travelling, many interactions take place between a soil, subsoil, groundwater and the contaminants, the overall result being an attenuation of the contaminant impact. A further and surely not negligible dampening effect takes place as the residual concentration of the contaminant dilutes, in the saturation zone, to a lower degree, due to the flow velocity, unit flow rate and hydrodynamic dispersion.
The evaluation of the specific vulnerability of an aquifer should be made case by case, taking into account all the chemical and physical features of each single contaminant that is present (or of a group of similar contaminants), the type of source (punctual or diffused), quantity, means and rates of contaminant applications [12–14]. This approach, although scientifically valuable and adequate for the case of the evaluation of a potential contamination [15] of a csc in small areas, is quite impracticable where the goal is the assessment of aquifer vulnerability for large areas or when it is carried out as part of contamination prevention and aquifer protection planning.
1.1. Advantage and Disadvantage of the Various Methods
In the last 30 years, a number of techniques have been developed for the general treatment of data (Table 1). These techniques vary considerably, according to the physiography of the tested areas [16,17] to the quantity and quality of the data, and to the aim of the study. Because of the limited space available for this contribution, the reader can refer to Civita [2,18], for an exhaustive discussion of the previously mentioned methods and a complete reference list.
A division into two distinct classes is therefore important: use for any physiographic scenario, or use for a particular area. For the sake of simplicity, the terms universal and local are proposed. However, these two classes can also be subdivided into three basic groups:
1) Homogeneous area zoning (hydrogeologic complex and setting assessment-HCS);
2) Parametric system assessment (i.e. Matrix Systems [MS]; Rating Systems [RS]; Point Count System Models [PCSM];
3) Analogical relation (AR) and numerical model assessment.
As has been widely verified from a comparison of several different approaches applied to the same sample-area [2], the choice of the method that is most suitable to build a vulnerability map for a certain area should initially depend on a strictly realistic evaluation of the number, distribution and reliability of the available (and/or researchable) data. It should therefore be underlined that an aquifer vulnerability map is an environment planning document. The map must be an integrant part of a land planning scheme for any order and degree of the administrative territory: it cannot depend on the morphology as it must cover a wide mixture of plain, hilly and mountain areas, as can be found throughout a lot of country worldwide.
Considering the recent experience gathered in Italy5, it is possible to indicate the correlation between the three main factors that are necessary when mapping vulnerability, namely the density of surveyed points, the amount of information secured for any point and the scale denominator (SD) at which the map can be constructed. It must be pointed out that only when there are a great number of information points per unit area (for any of which a variety of ground data are attainable) can complex, low SD models be applied; for a medium information point density with a fair distribution, a more complex or less complex parametric system (depending on the number of data available per point) can be used; if the specific basic information is inadequate and/or scarce and scattered throughout the area, as is often the case, an HCS method fitted to a medium-large SD must be used.
A very important consideration that must be made when choosing a method for vulnerability assessment is the reliability of the basic data, as the inadequate reliability of data can give rise to a false precision. Even worse, it can completely falsify the results, making them quite useless.
The reliability of data, moreover, can vary widely with a mean elevation of the investigated area. A sharp decrease in the reliability of results is above a comparatively low altitude (300-400 m a.s.l.) due to the increasing scarcity of data in mountainous areas, a problem which cannot be resolved through the use of extrapolation techniques. This is true for hydrogeologic and hydrostructural data (piezometric levels, unsaturated zone, flow directions, hydraulic conductivity, aquifer geometry), but no less so for pedological and climatological data (rainfall, evapotranspiration, wind, temperatures, etc.). In mountainous regions and in most hilly areas, however, it may be necessary to avoid the more complex techniques, using HCS or MS systems coupled to medium-high SD mapping, instead of the more sophisticated parametric systems. The validity of these is greater in plain areas with high data density and reliability, but they are also suited to adequately low SD mapping.
On the basis of this consideration, it was realized that it is impossible to elaborate an aquifer vulnerability map using one single method, particularly when the target is assessing vulnerability in less developed countries, where the worse experience of developed countries might be a spur to a prevention protecting policy.
It is necessary to point out advantage and disadvantage of the various methods reported in Table 1:
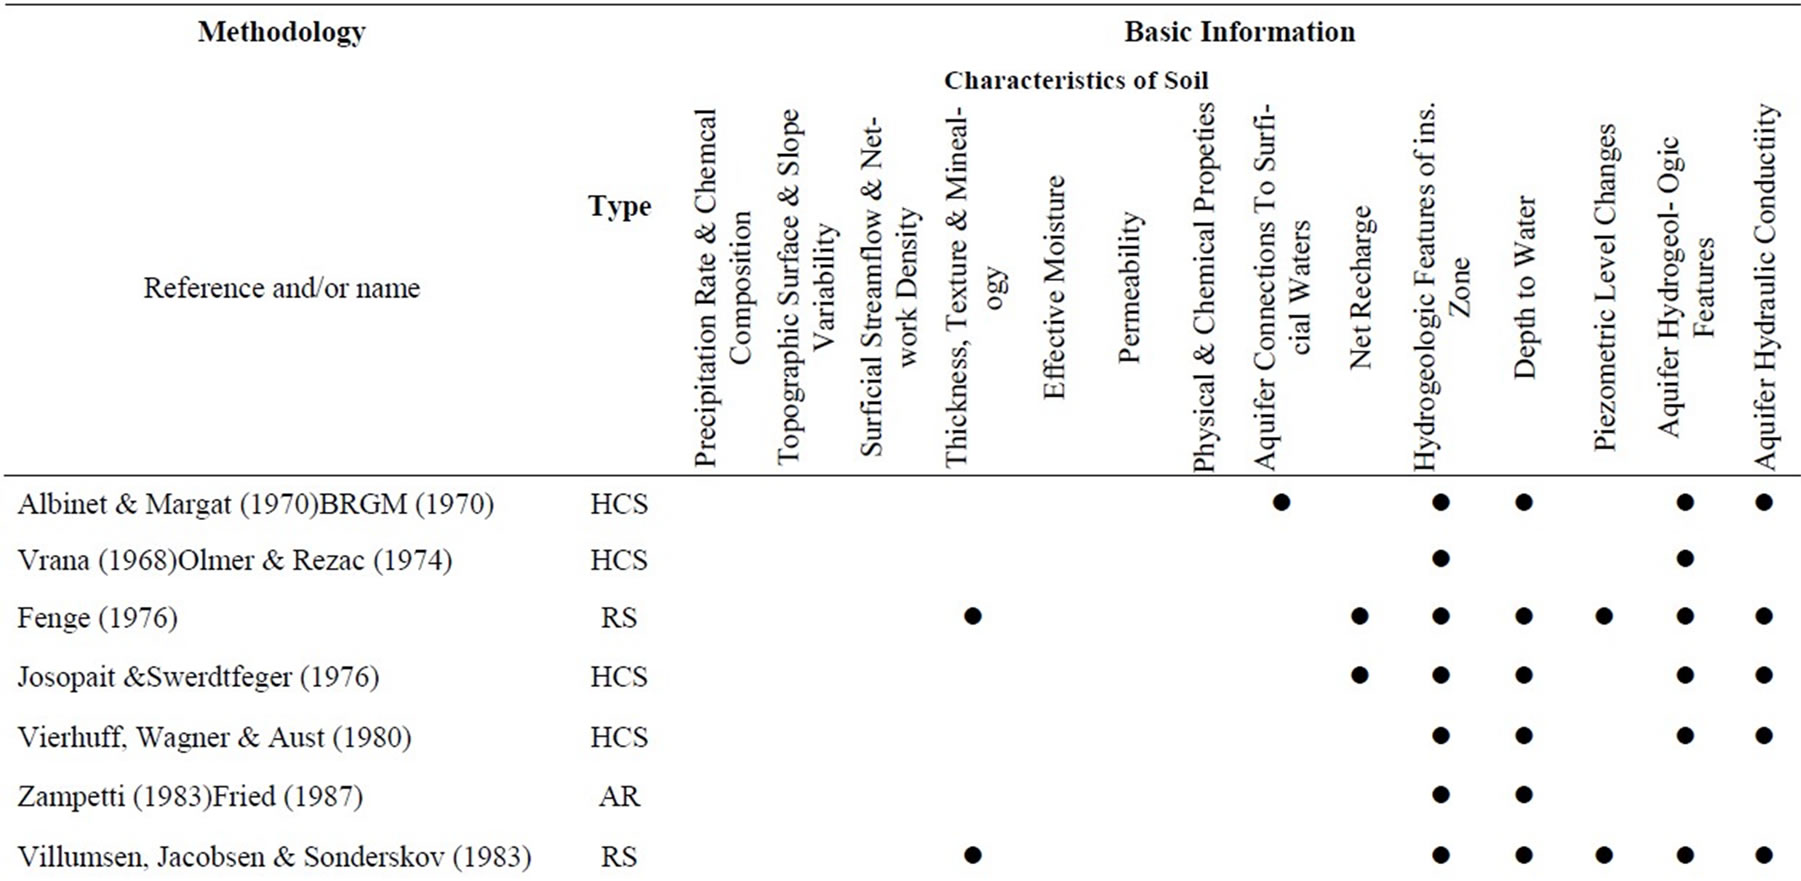
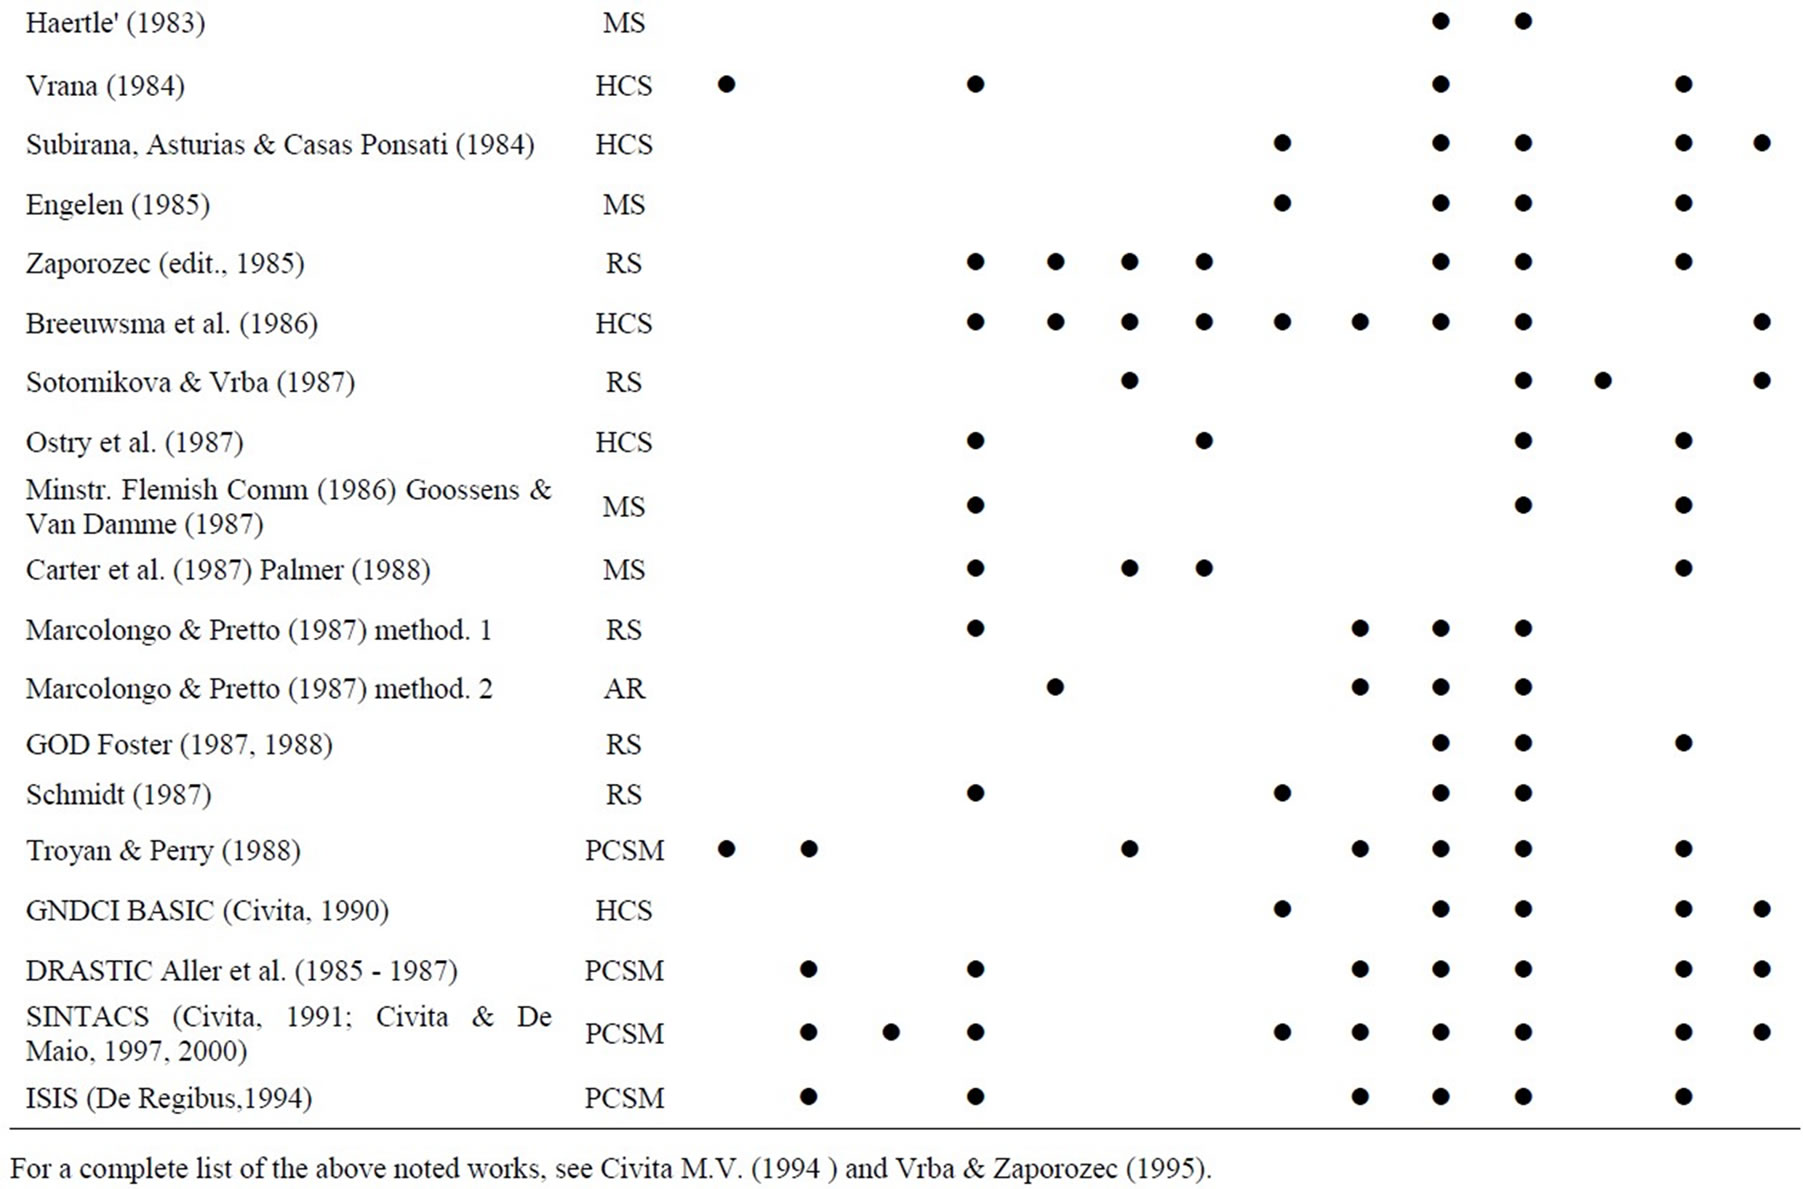
Table 1. Methods of assessing the aquifer vulnerability to pollution and the relative basic information.
Several methods are applicable only to the restrict zone where they had been performed:
1) Some of the methodologies consider only the action of the soil and not that of the whole system;
2) Some of most evolutes PCSM (e.g. DRASTIC [19], GOD [13]) not contemplate the climatic factors and the exchange with the surficial watercourse;
3) None method is built up for using GIS data treatment, so, derived maps may illustrate only a situation “crystallized” in the time and not updatable to provide the situation in real time;
4) Without the census of pollution producer and their hazard level is not possible to use vulnerability maps for planning and contamination prevention.
With the target to built out standard methods usable all country wide, since the ninety the Italian Scientific Program began to realize two methodologies usable one in hilly and mountain areas and the other in plain area. Since 2000, a new approach (named combined approach) was studied and tested, for use in any part of the Italian6 territory, which was based on the overlapping of the two different GIS ready methodologies:
1) A parametric method (a highly advanced PCSMi.e. SINTACS Release 5 [3]), which has been improved for plain and pedhilly areas, where the amount and reliability of data, measurements, tests and analysis can be considered to be sufficient for the mapping scale;
2) Homogeneous areas zoning, based on the survey of hydrogeologic complexes, characteristics and settings (HCS), to be used in mountainous and hilly areas where a scarcity or lack of underground information is normal (GNDCI-CNR Basic Method).
1.2. Brief Description of the Methods
The vulnerability of a groundwater body is a function of several parameters, the most important of which are lithology, structure, geometry of the hydrogeologic system, the type of overburden, the recharge-discharge process, the interaction of the physical and hydrochemic processes that regulates the quality of the groundwater, and the fate of the contaminants that impact the system.
Where the data base is complete and the frequency of the available information is adequate, the factors that are used to assess the aquifer vulnerability to contamination are selected; a subdivision into value intervals and/or declared types is applied to each selected factor; a progressive rating (P, ranging from 1-10) is given to each interval as a function of the importance in the final assessment (Table 2); the selected ratings of each factor must be multiplied for a choice of weight (W) strings, which are used in parallel and not in series (Table 3), each one describing a hydrogeologic and impact setting that emphasizes the action of each parameter.
The acronym Sintacs comes from the Italian names of the factors that are used, i.e. Soggicenza (depth to groundwater); Infiltrazione (effective infiltration); Non saturo (unsaturated zone attenuation capacity); Tipologia della copertura (soil/overburden attenuation capacity); Acquifero (saturated zone characteristics); Conducibilità (hydraulic conductivity); Superficie topografica (topographic surface slope). A vulnerability index is calculated for each cell of a discretisation grid that is overlaid on the basic map of the considered zone:
 (1)
(1)
The types of basic information, the necessary elaborations to transform them in SINTACS factors and the definition of the hydrogeologic and impact settings used to select the weight strings can be found in [2,3], together with a number of application tests.
1.3. GNDCI-CNR Basic Method
This method [1] is based on a standard in which a number (about 20, see Table 4) of hydrogeologic settings that can be found in the Mediterranean countries is collected and the intrinsic vulnerability characteristics of the aquifer are identified. This method is highly flexible and can be adapted, if necessary, to other situations that are not dealt with in the standard. The lithologic, structural, piezometric and hydrodynamic indexes are not rigorously quantified. Starting from a complete examination of the main Italian hydrogeologic settings, the representative sites were extracted from those that best define the settings, e.g. the Po river Plain, the carbonatic massifs of the Apennine ridge, the karst settings of Apulia and Trieste, the volcanic terrain of central Italy, the ancient basement of the Alps, and so on. The main factors of the aquifer vulnerability (e.g. depth to groundwater, porosity, fracturing index, karst index, linkage between stream and aquifer, and so on) were identified for each representative site. Bearing in mind the dynamics and frequency of the contamination cases that were collected and previous similar experience at an international level, the settings were distributed over the 6 degrees of intrinsic vulnerability (i.e. contamination potential) that form the synoptic legend of the maps.
1.4. The Combined Approach
From what has been seen, in many areas where it is necessary to cover vast areas identified by administrative (i.e. Municipalities, Provinces, Regions) or physical boundaries (interregional watershed) with a Vulnerability Map,
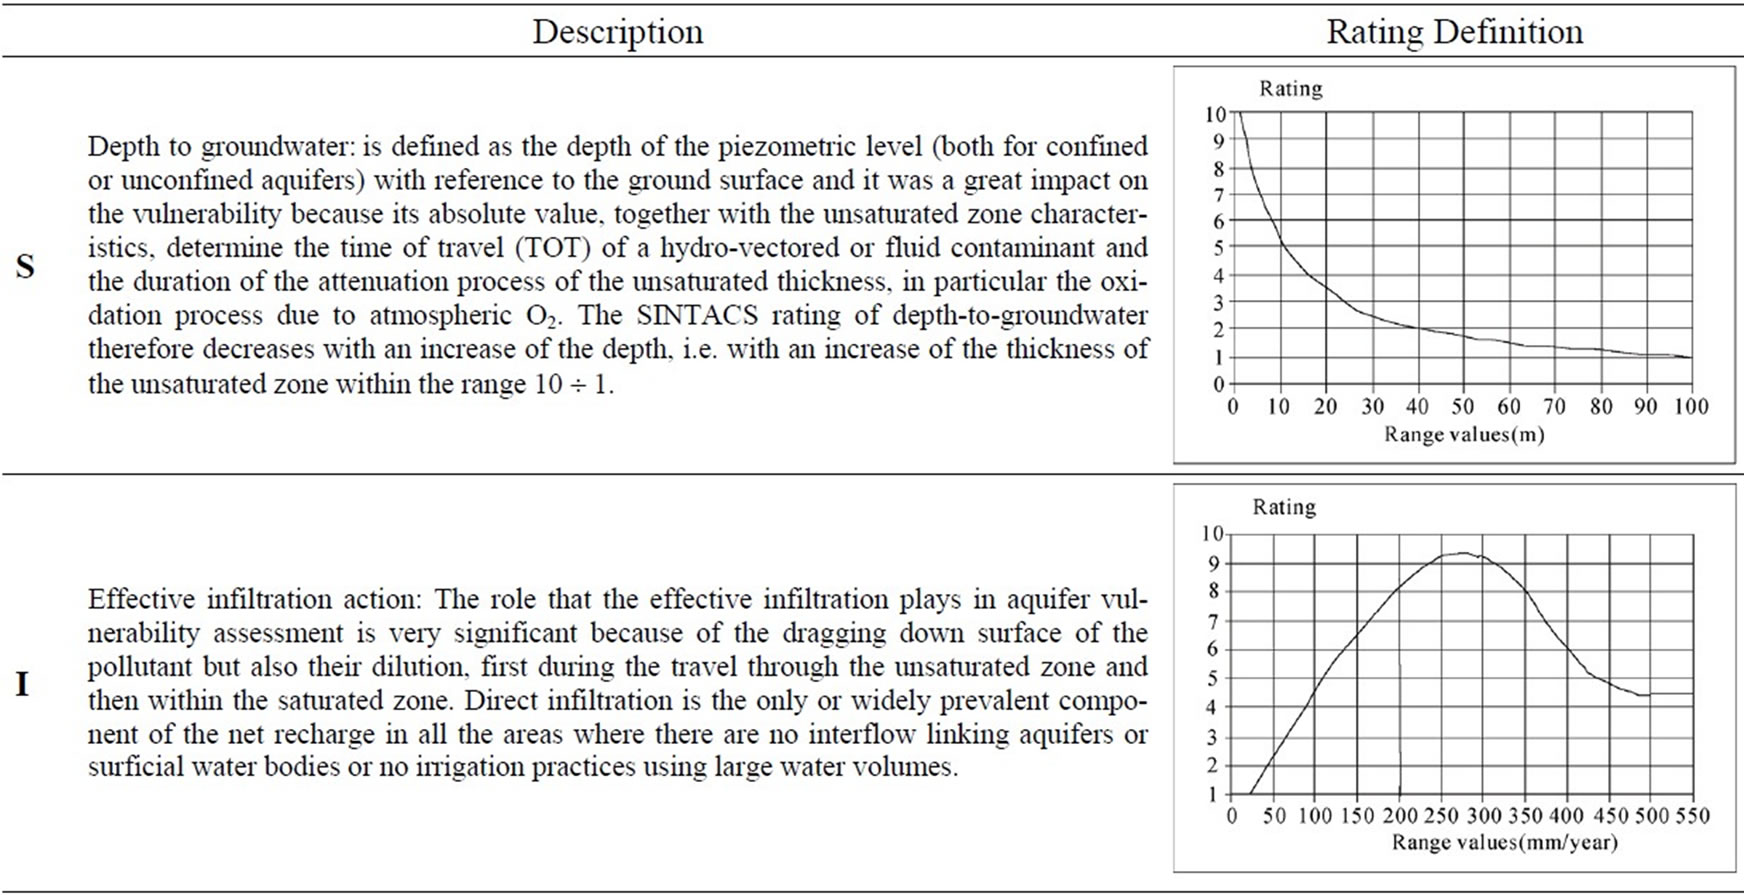
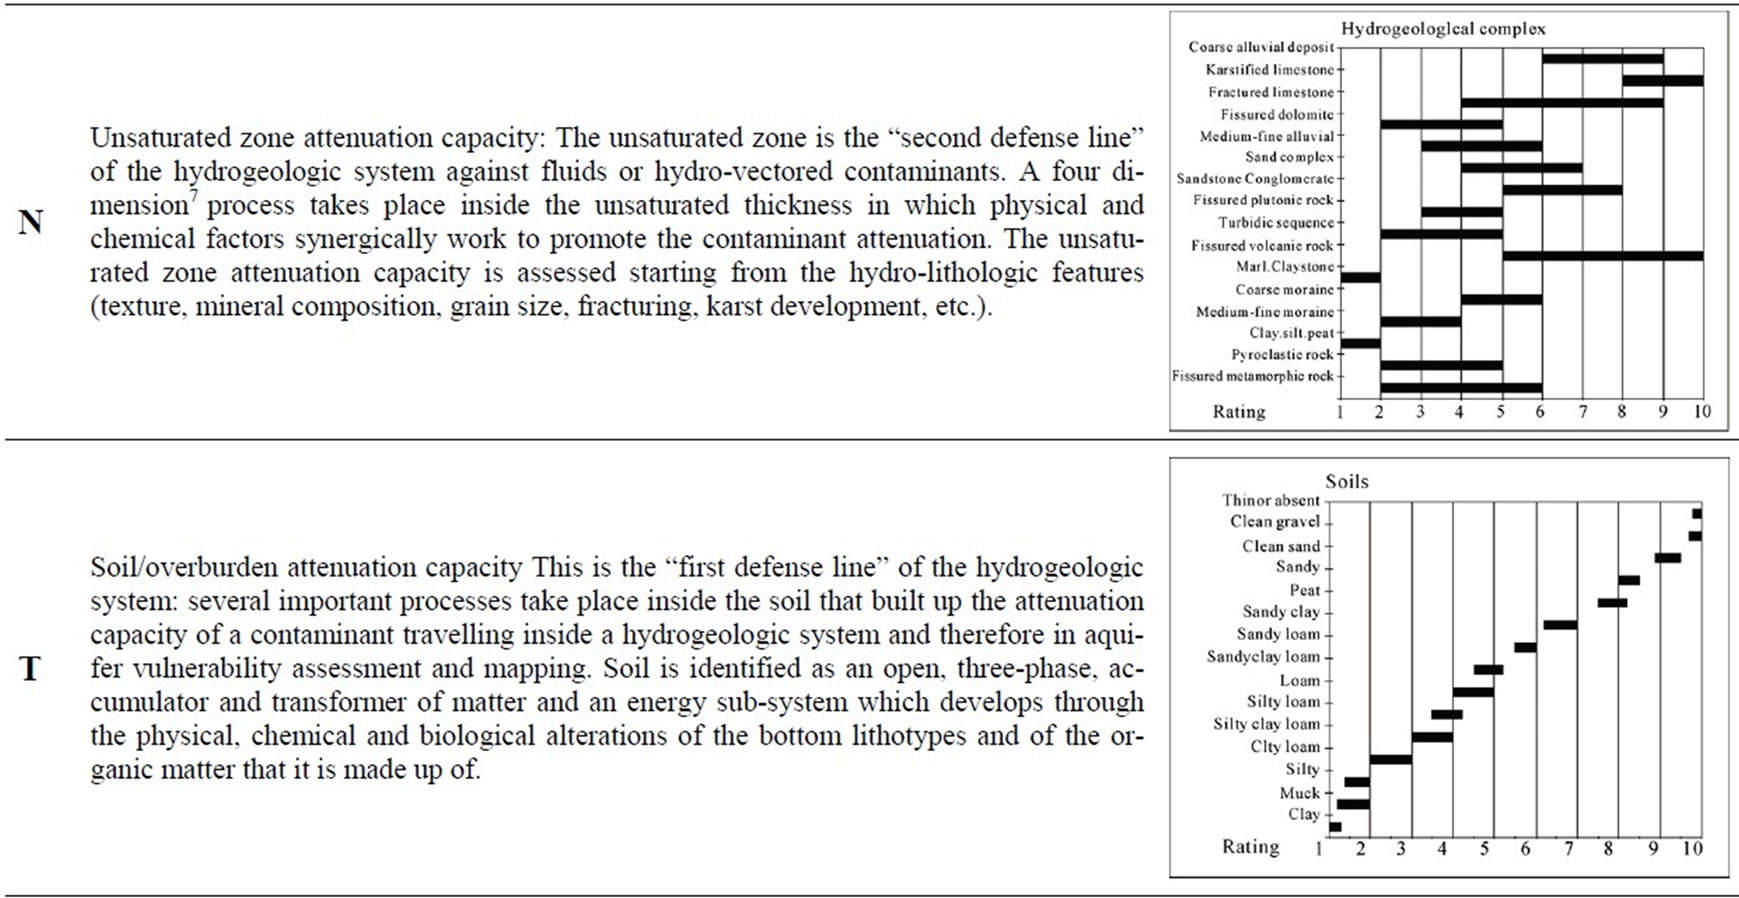
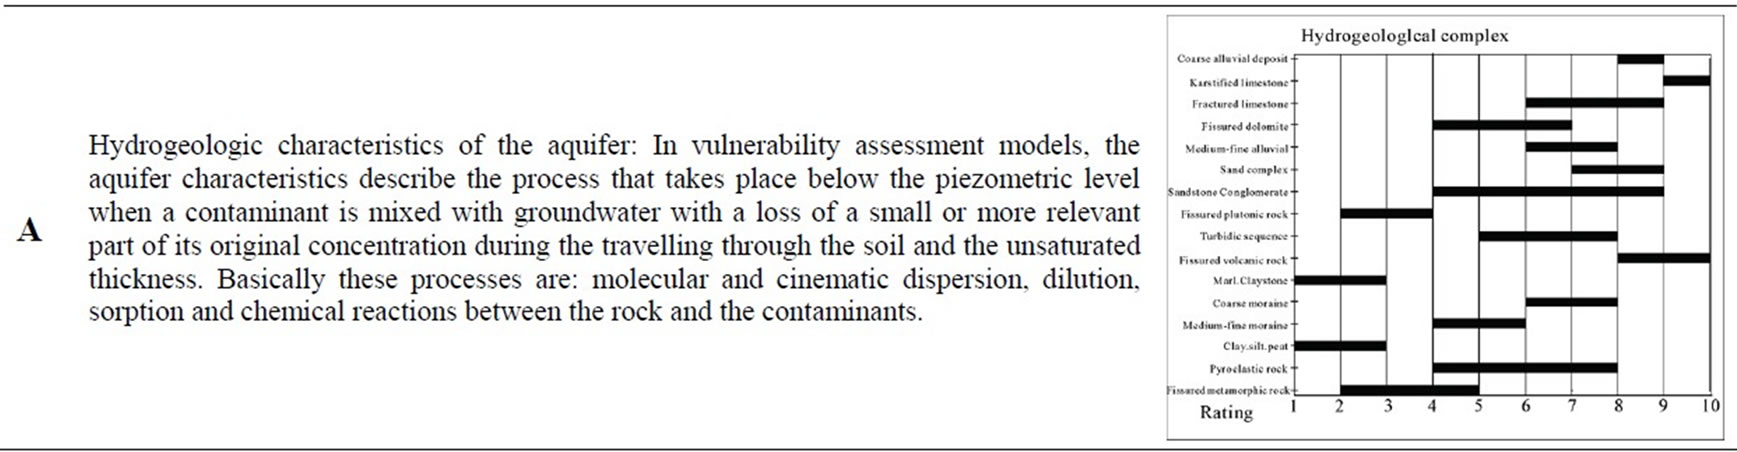
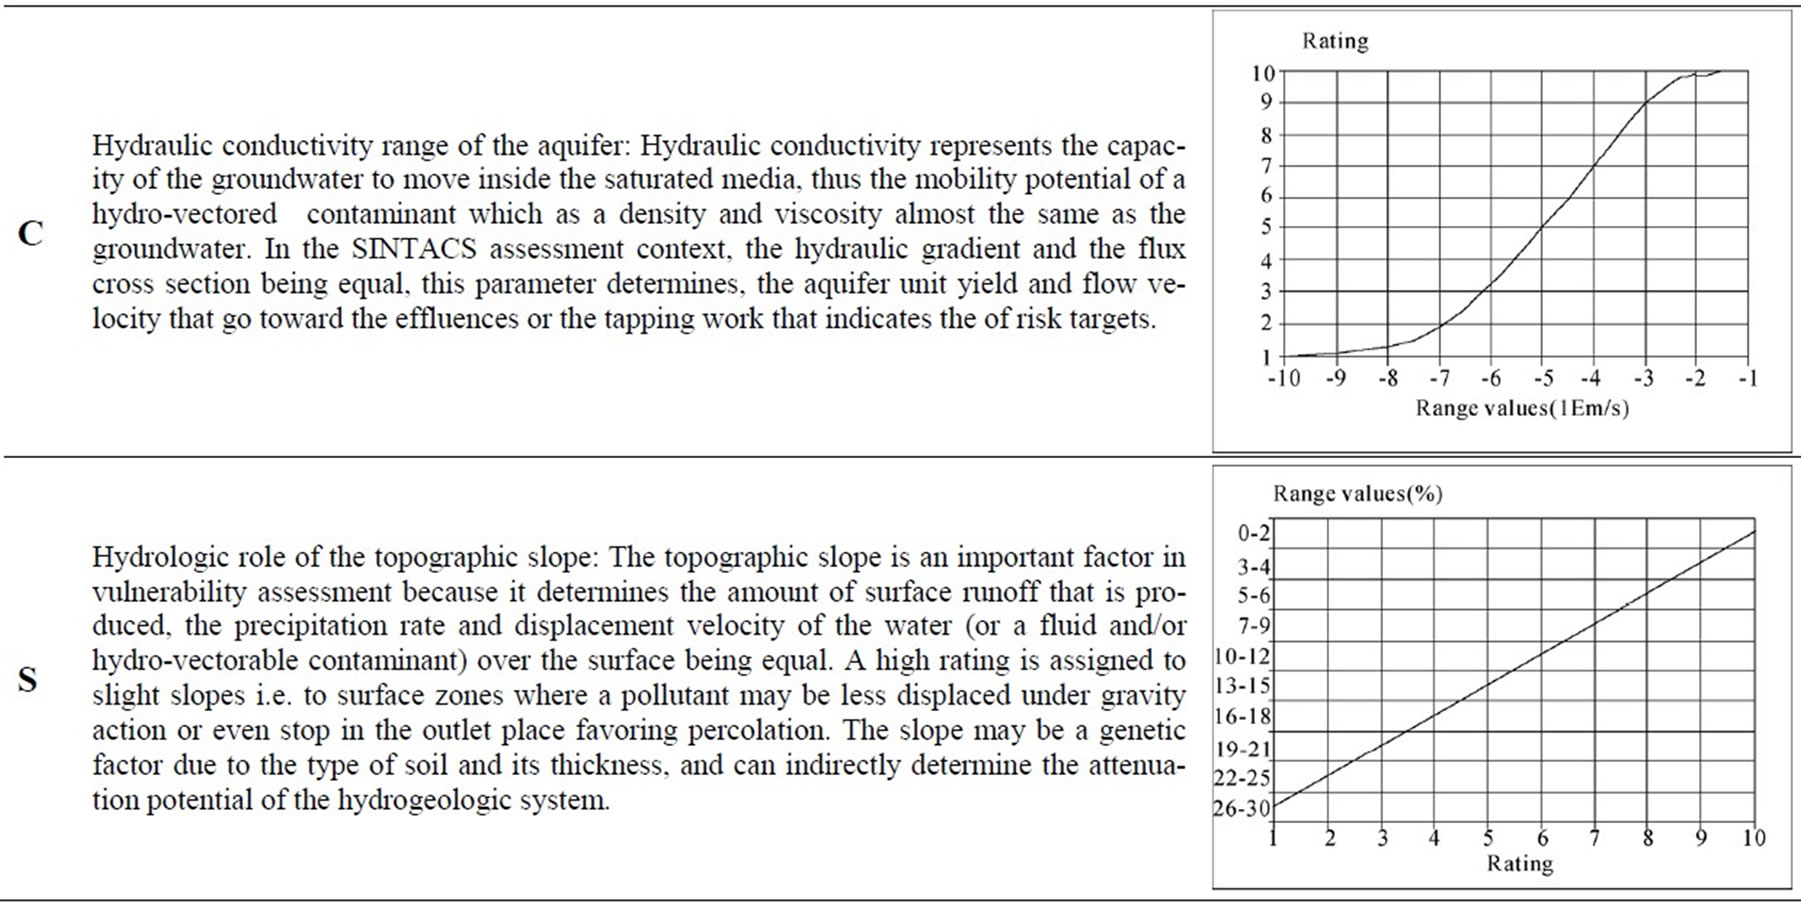
Table 2. Description of the parameters and related rating graphs for PCSM SINTACS.

Table 3. Strings of multiplier weights given for SINTACS.
the parametric models that have been set up cannot be applied due a lack of data at those points where the terrain changes from a plain morphology to a hilly or mountainous area. In these situations, in the past, a simple method was chosen that was able to perform a less refined and detailed evaluation, but which however was applied to many land and environmental problems connected to the contamination of aquifers with good results.
The solution that has been found for this problem and which has been tested, is the combined approach. This approach allows the GNDCI-CNR Basic method to be combined with the PCSM SINTACS method without continuity solutions: the latter in areas where the data that are necessary and sufficient to apply a parametric model exist; the first in areas where the great depth to water, the hydrolithologic and hydrostructural complexity and the lack of certain data on the terrains, the hydraulic conductibility and active recharge do not allow details to be obtained that can be compared with those that can be obtained using SINTACS. The experience gained over recent years has led to a reconsideration of the methodological problem: why renounce the detail that can be offered by point and weight parametric models [1,2] in areas with moderate relief where the majority of the CSCs and the DCSs8 and many of the supply springs are concentrated (that is, the subjects at risk - SAR)? On the other hand, how can we carry out the evaluation of vulnerability and the risk to contamination for areas with great depth to water, areas that can be described in less detail on the basis of hydrogeologic situations and complexes?
The necessary connection, whether conceptual or cartographic, between adjacent areas where different methodologies should be applied, is supplied by the parametric evaluations. In practice, for those complex ones where a parametric evaluation already exists, the same degrees of vulnerability are applied but the changed slope and water table conditions are also taken into account. All this is possible thanks to the fact that the calibration with SINTACS was carried out by comparing and crossing, as already mentioned, the SINTACS evaluation with that obtained with the GNDCI-CNR Basic method, on over 600 test-sites distributed throughout the different Italian areas and territories. The division of the numerical index into 6 degrees of vulnerability, the same as those used for the Basic Method, makes the two methods comparable and the results optimally combinable.
The application of the combined approach has given excellent results in the Tanaro Project area [20] and led to a complete covering being obtained without any loss of basic information or accuracy of synthesis. The same numbers of cartographic examples of the vulnerability carried out using the combined approach of the two methods are shown in Figure 1. The thick black line in
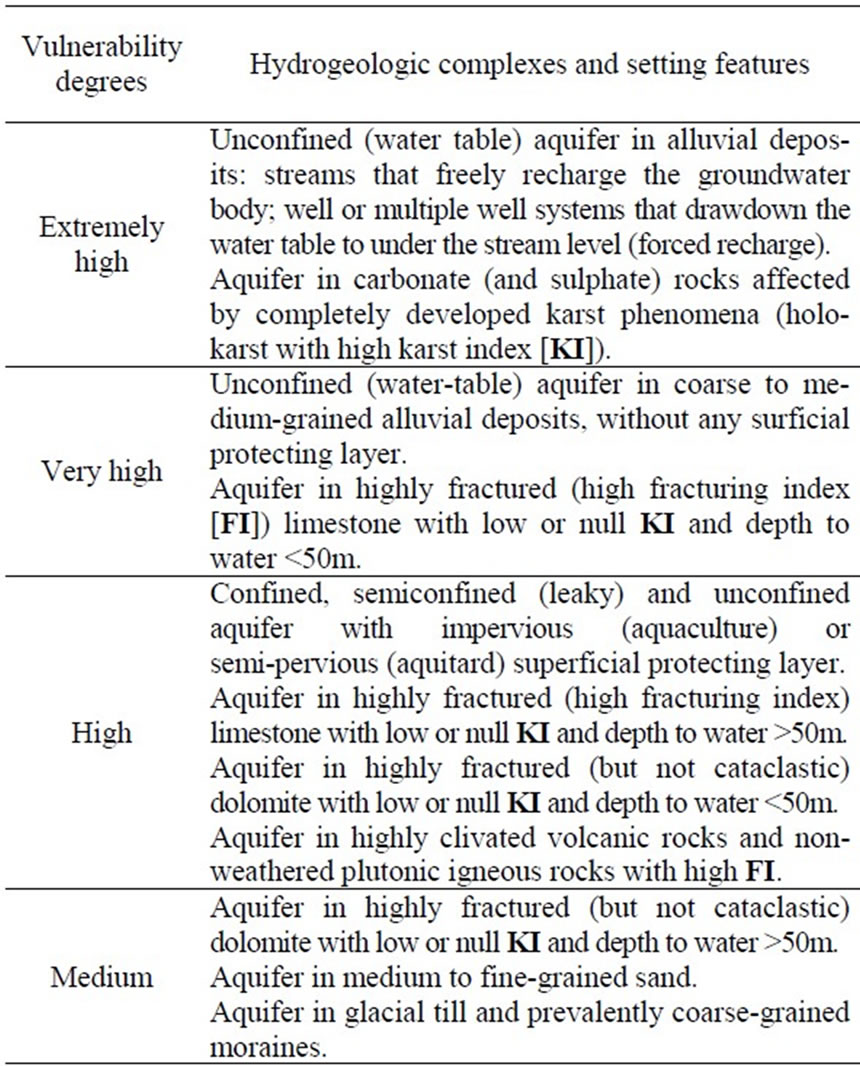
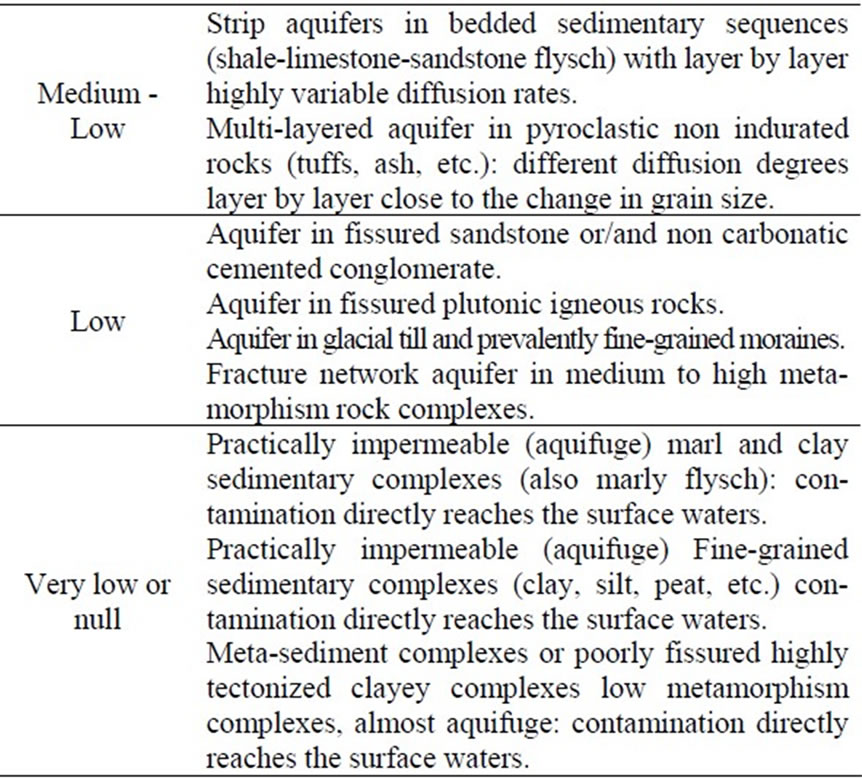
Table 4. Standards of Italian hydrogeologic settings (GNDCICNR basic method).
the figure represents the dividing line between the areas treated with the two methods. The homogenization that the approach involves can clearly be seen.
2. A Case Study
2.1. Generality
The study of vulnerability to contamination of the aquifers in the Tanaro Valley, Piedmont (Italy) was initially
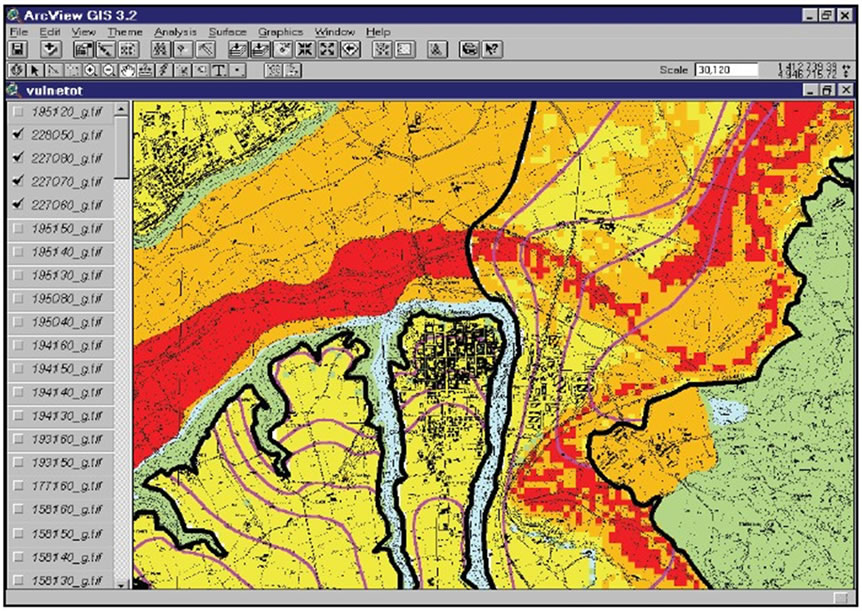
Figure 1. Vulnerability map: (Red) extremely elevate degree; (Orange) elevated degree; (Yellow) high degree; (Green) medium degree; and (Cyan) low extremely degree of vulnerability.
set up and planned on a very large territorial basis. It was considered that not only the areas that were directly involved by the 1994 flood event should be considered, but also the remaining territory belonging to the Municipalities that were involved in the catastrophe, which were subject to the direct and derived consequences of the flood.
The case-study landscape is a part of the territory of the Alessandria Province-Piedmont, Italy (Figure 2.) and its hydrogeologic layout is synthesized in Table 5.
However, detailed data were not available for the external areas on the depth to water, the hydraulic conductivity, the soil characteristics, etc.
The vulnerability map of aquifers is a planning document and cannot therefore be limited to only the parts of the territory that were involved. Given, however, the cover conditions-data that has previously been illustrated - it was not possible to carry out an elaboration of the Vulnerability map with a uniform method. It therefore proved necessary to appropriately use the SINTACS r5 method together with the Basic GNDCI-CNR method applied in a combined approach.
2.2. Databases and Monoparametric SINTACS Maps
2.2.1. Depth to Water
The SINTACS points relative to this parameter decrease with an increase of the depth, that is, with an increase of the thickness of the unsaturated area, and they take on values between 10 and 1.
Therefore, when selecting the data to use in SINTACS it was necessary to consider the minimum depth to water value that was revealed from the survey campaign, in order to be in the most cautionary conditions possible when evaluating the vulnerability, the value of which, in all cases, is inversely proportional to the time of travel
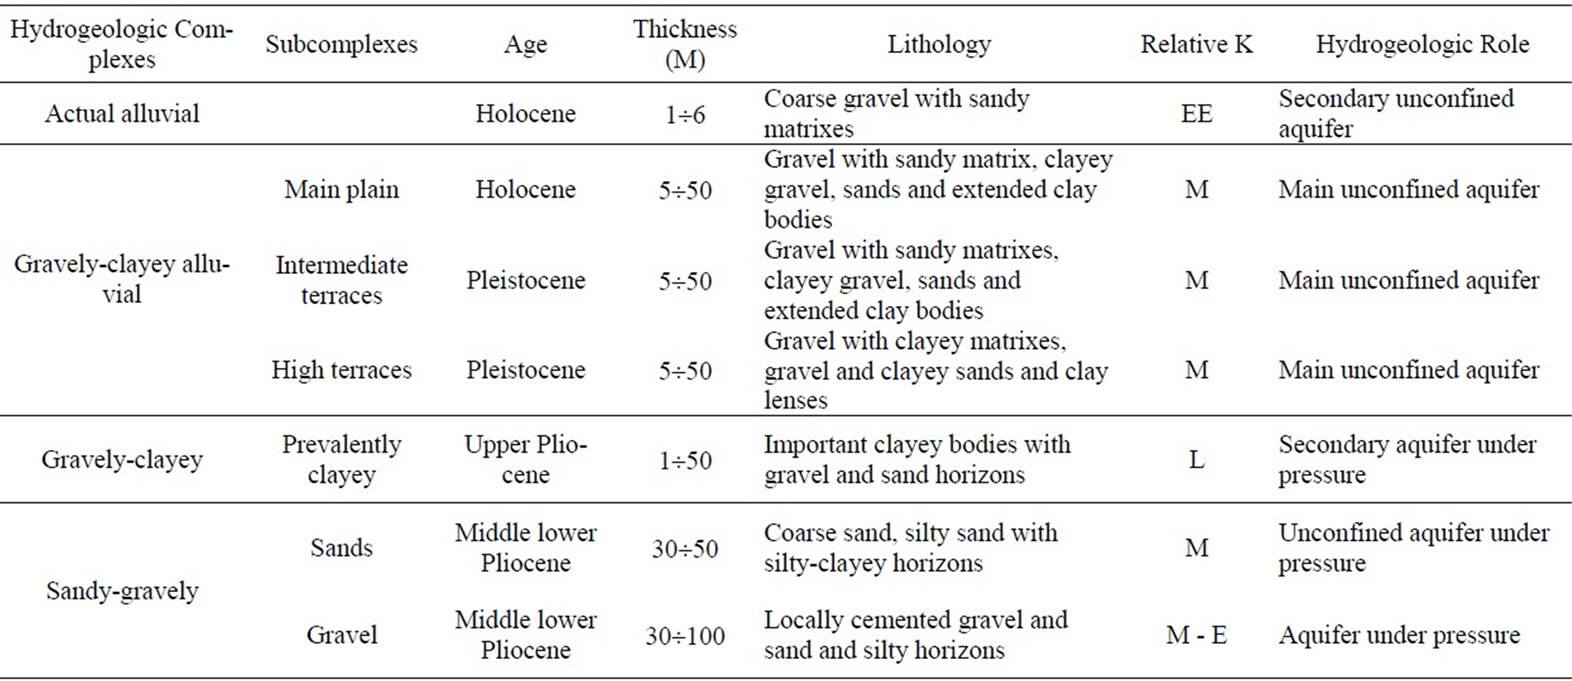
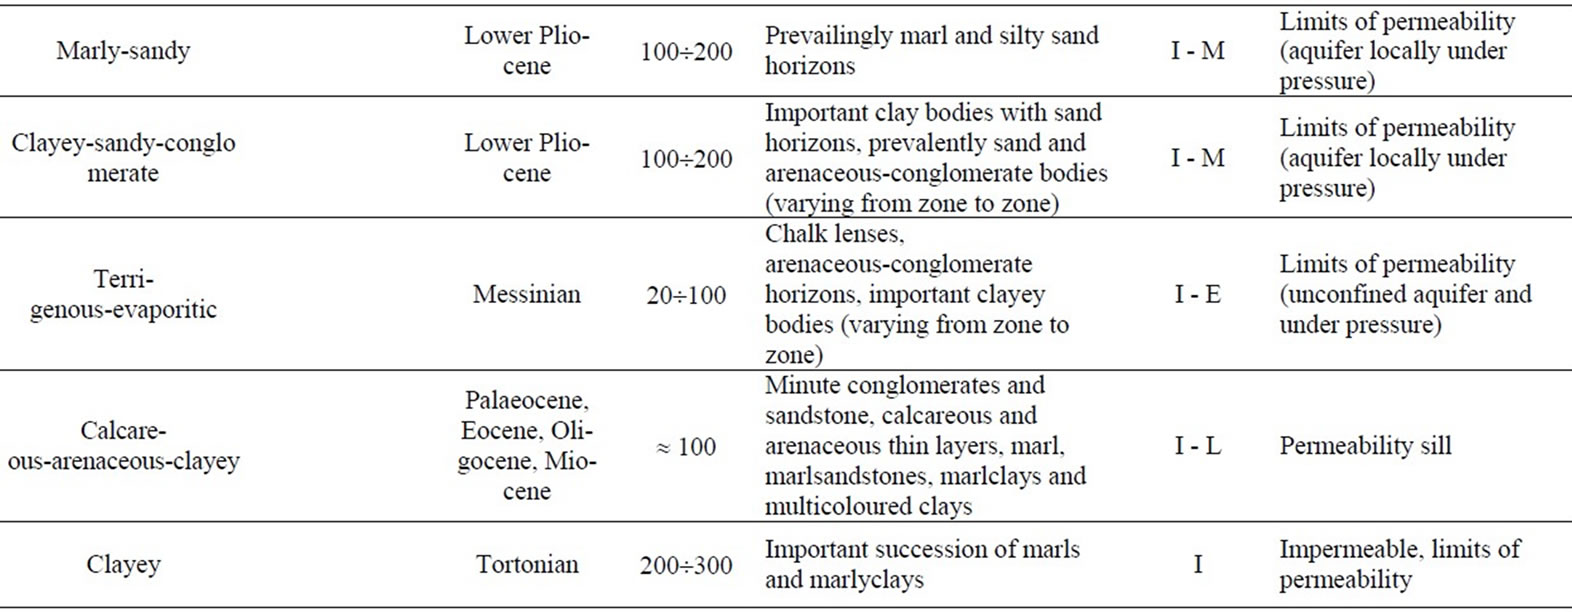
Table 5. Hydrogeologic characteristics of the complexes.
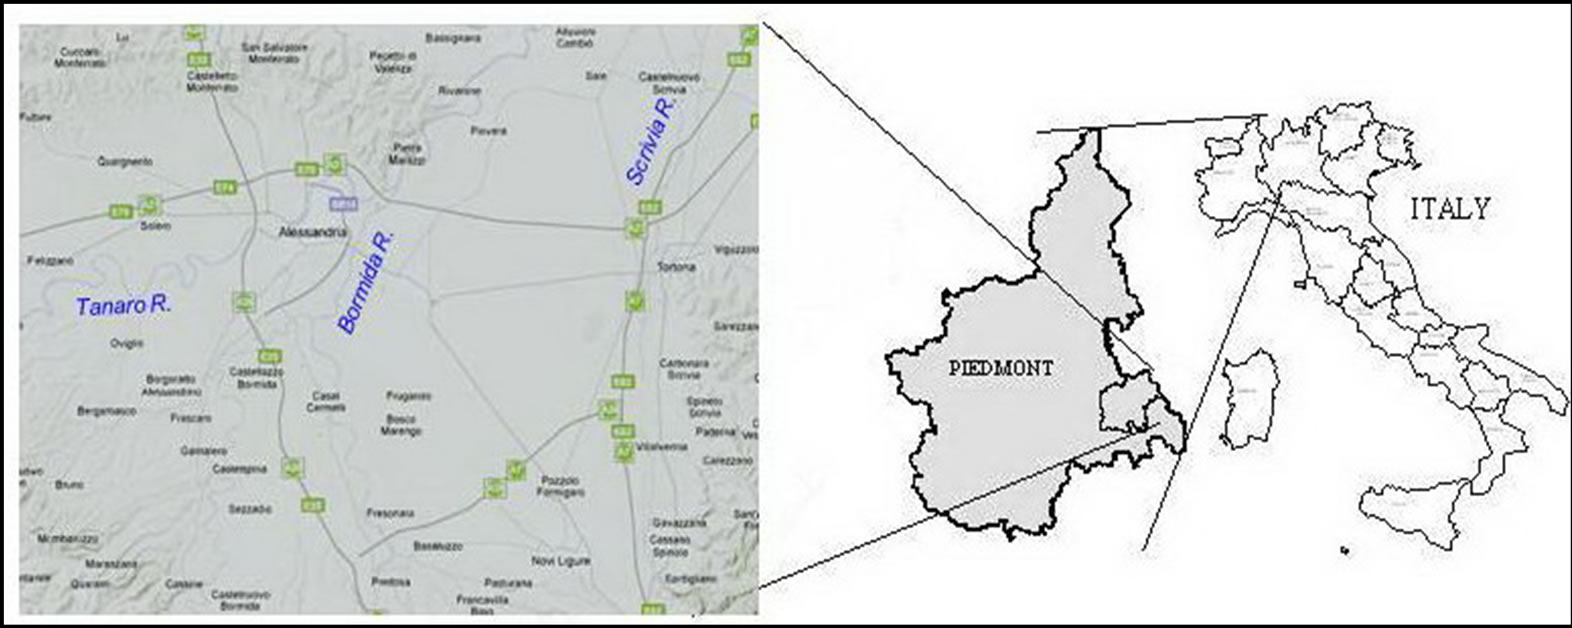
Figure 2. Geographical sketch of the case study.
(TOT). The raw depth to water data were elaborated in an ARC/INFO ambient, first to obtain a satisfactory and descriptive territorialisation9, while taking into consideration the limits of the system and the georeferenced position of the 0 depth to water descriptions. Then the spaces were reclassified on the basis of the SINTACS points and cartography was obtained relative to the S parameter, which was plotted on a raster basis (Regional Technical Map) at a 1:100,000 scale.
The depth to water map was obtained automatically from subtractions of the height grids of the topographic surfaces and from the piezometric surface height grid. The topographic surface was obtained using the DTM (Digital Terrain Model) of the Regione Piemonte. This is not compatible with ARC/INFO: this led to specific software being prepared in the DOS environment to transform the original files into ASCII files which are instead compatible with ARC/INFO with the GaussBoaga coordinates (x, y, z) of the points that make up the DTM. The thus obtained file was imported and appropriately elaborated (Figure 3) so as to obtain a covering of the quoted points on which to apply the 50 m side grid, GRID 1 was obtained in this manner.
The piezometric surface was obtained from the surveyed point piezometric data. The Isopiezometric Map (∆h=1m) was generated from these data through linear interpolation using a traditional method. It was digitised in ARCVIEW and imported into ARC/INFO as a shape file. The creation of the topology made it possible to attribute the mean height of the piezometric level to the iso-value areas. GRID2 was obtained from the thus obtained cover.
The DTM has an accurate precision and the extraordinary potentialities of a GIS make it possible to use it in a great number of territorial applications (planning of infrastructures at a mean denominator scale, the study of landslide phenomena, etc.).
The elaboration that was made also constitutes a remarkable innovation of the traditional techniques used for the drawing up of depth to water maps. These traditional techniques do not supply great precision, even in the case of situations with moderate variability, and, above all, the automatic elaboration makes it possible to obtain maps almost in real time.
The thus obtained depth to water map was then reclassified using the RECLASS command of GRID in the intervals foreseen by the SINTACS method. This allowed a grid with the depth to water parameter points to be obtained.
2.2.2. Infiltration
The evaluation and territorialisation method of this parameter in the latest SINTACS versions (R5) [21] is based on the inverse hydrogeologic balance technique.
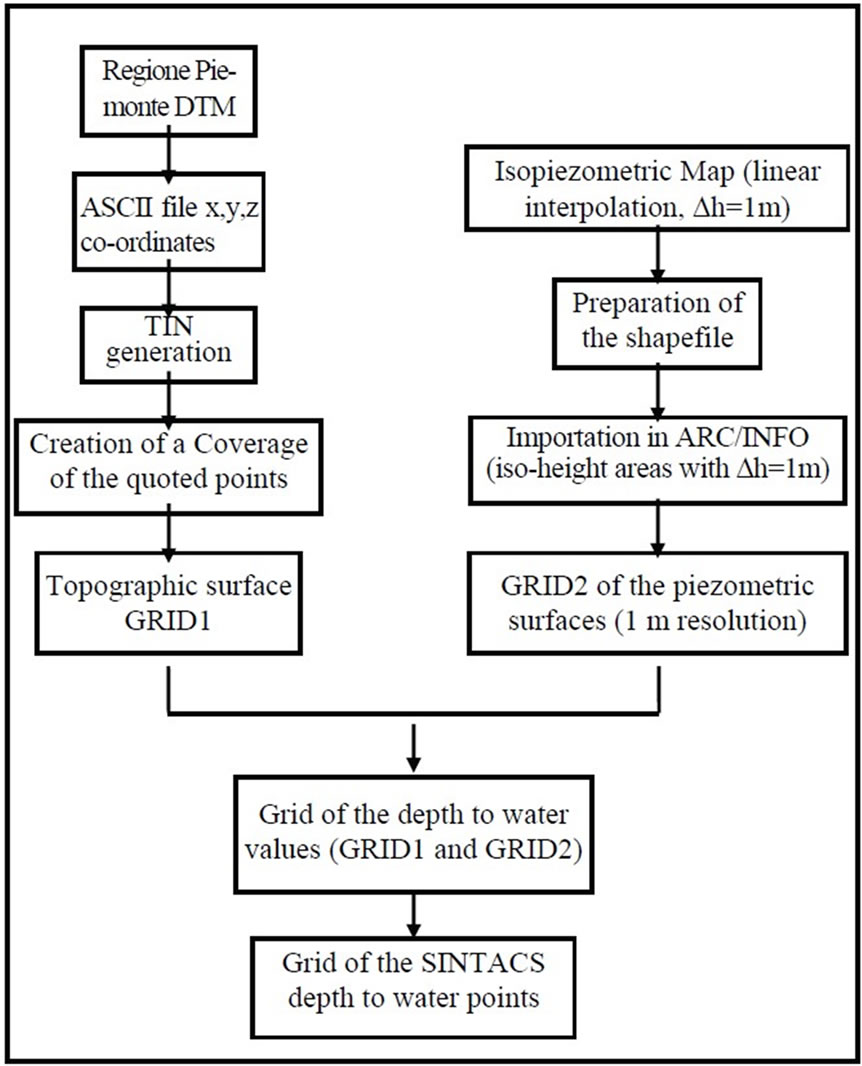
Figure 3. Flow chart of the depth to water map.
The parameter is calculated from the effective rainfall territorialized using a grid square numerical model and from the surface hydrogeologic conditions that are incorporated in the infiltration index (c).
In the case under examination, the historical series registered in 28 pluviometric stations and 11 thermometric stations distributed over the area under examination and in the vicinity were examined for the periods 1931- 1941 and 1954-1964. Five homogeneous areas were identified on the basis of the mean rainfall/elevation ratio; four homogeneous areas were identified on the basis of the mean corrected temperature/elevation ratio.
On the basis of the points obtained from the DTM, of the mesh defined for the studied area, from cover of the c performed for the entire studied area and constructed in ARCVIEW as a polygonal shape file, through an AML script in the ARC/INFO GRID ambient, the following data are automatically calculated for each cell:
1) The specific rainfall ( );
);
2) The specific corrected temperature ( );
);
3) The specific evapotranspiration ( );
);
4) The specific effective rainfall ( );
);
5) The specific active (infiltration) charge ( );
);
6) The specific surface run off ( ).
).
Once the value of the potential infiltration had been calculated for each grid element, a reclassification is made according to the point intervals defined by the method and with the redrawing up of the Map for parameter I, in a 1:100.000 scale on a RASTER basis.
2.2.3. Effect of the Auto-Depuration of the Unsaturated Zone
The values of parameter N were obtained from a point elaboration of the stratigraphies of about 700 wells and surveys under examination in the area.
Once the depth to water is known, it is possible to make an initial sub division into unsaturated or saturated for each item of point information. Once the unsaturated thickness and the relative lithologic variations deduced from the reference stratigraphy are known, it is possible to proceed with the elaboration of the pondered mean of the SINTACS N point for each measurement point.
A heterogeneous substance with N parameter values of between 1 and 9 is indicated in the Alessandria sector, with a dominance of point 4 in the plain south of the Alessandria-Spinetta-Tortona alignment.
As expected, a value N =8 was assigned to the recent alluvial complex (prevalently gravel).
The lowest value, equal to 3, was assigned to the prevalently insistent clay complex west of the sector under examination. The Map relative to the autodepuration effect of the unsaturated zone was obtained using traditional mapping of the data derived from the hydrogeologic survey and from the many drillings that were available. The data relative to the subsoil on which the parameterisation of the unsaturated zone is based almost all derive from the drilling of water wells and from geognostic and geophysics investigations.
The different items of point information, which were placed in a specific database that contains about 15.000 data, were subjected to cross-checking and homogen isation in order to construct the greatest possible number of hydrogeologic profiles, so as to obtain a correct zoning of the hydrolithologic information.
The next step consisted in importing the previously treated data into the ARCVIEW ambient, where the points foreseen by the SINTACS method for the unsaturated thickness of heterogeneous composition were attributed to homogeneous areas. The information relative to the N parameter was reclassified according to the foreseen points and the Map relative to the 1:100.000 scales was redrawn on a raster basis. This elaboration was then imported into ARC/INFO. The normal mesh was applied to this cover and the grid of the SINTACS points for the unsaturated zone was obtained.
2.2.4. Typology of the Cover
The values of the SINTACS T parameter were obtained from an analysis of 106 samples of the soil obtained from the 1998 sampling campaign that was carried out in the province of Alessandria through a correlation diagram of the T parameter and the contents in the soil of organic substances (SO) and fine mud-clayey particles (AL) [3,22]. Given the remarkable extension of the area under examination (1042 km2), recourse was made to the Map of the Capacity of use of the Soils and their limitations [23] to have an adequate pedologic knowledge of the entire area, and the entire area under examination was then pedologically zoned thanks to this map and that of the hydrogeologic complexes. The entire zoning was defined according to parameter T of the studied area through the use of the correlation diagram between the textural characteristics of the soils and the relative points for the evaluation of the mitigating action of the contaminants [24]. The dominant value of point T in the Alessandria plain area was 6, while in the hilly areas south and south east of the Alessandria sector, a T value equal to 7 was obtained. A higher value of 8 was only found in a plain area close to the Pontecurone village at the extreme south west of the area close to Cassine.
The thematic Map was obtained using traditional methods. The elaboration that was obtained was acquired as a polygonal ARCVIEW shape file in which the relative points were assigned according to the reference abacuses of the SINTACS method. The shape file was then imported into ARC/INFO where the usual 50 metre side grid was applied.
2.2.5. Hydrogeologic Characteristics of the Aquifer
The elaboration of the data relative to the SINTACS A parameter followed the same course as the elaboration for parameter N. Given the partial heterogeneity of the saturated zone, which also occurred for the analysis of the unsaturated zone, it was decided to apply the mean pondered technique (with respect to the thicknesses) of the value assigned to the point datum so that this totally reflected the real typology of the saturated zone.
The Alessandria sector is dominated by high values (7-8-9) of the A parameter, an indication of an elevated permeability type aquifer; a limited central zone diverges from this analysis with a SINTACS point equal to 5; a second zone central-east of Alessandria; a third zone to the extreme east of the Province, till the valley bottom of the Scrivia river.
The Map of the hydrogeologic characteristics of the aquifer was obtained by attributing the SINTACS points, according to the abacuses reported for the same method. The Grid in ARC/INFO, relative to the Map of the characteristics of the aquifer, was obtained through simple applications to the overall area.
2.2.6. Hydraulic Conductivity
The determination of the SINTACS C parameter was mainly based on the elaboration of the hydraulic conductivity data obtained from in situ tests (Slug test, recovery test, Lefranc test) and from the use of the QSPEC software [25] using the input data extracted from the stratigraphies of wells for the entire area under study and where the data were insufficient, the correspondence between the hydraulic conductivity intervals of the main aquifer complexes and the corresponding C parameter points was taken into consideration.
The hydraulic conductivity of the aquifers in the Alessandria sector is medium-high and the values of C therefore vary from a minimum of 5, relative to the high terraces of the southern sector, to 6 for the intermediate central sectors of the Alessandria plain. The highest values occur in the sub-complex of the main plain and for the present alluvial complex with C=7 and C=8, respectively.
As expected, the hydraulic conductivity value in the western sector of the area, in correspondence to the gravely-clayey-prevalently Clayey sub-complex, is medium-low and the corresponding C value is 3.
The Hydraulic Conductivity Map of the aquifer was prepared for each area under study by attributing the hydraulic conductivity value determined from slug tests and recovery tests and calculating the data of the specific discharge. The procedures for the creation of the covering of the hydraulic conductivity and the SINTACS point grid are similar to those carried out for the covering type Map.
The following tests were carried out in the studied area when there was a lack of specific data:
1) Recovery tests on agricultural wells;
2) Slug tests in observation wells;
3) Analysis of the specific discharge data, connected to the stratigraphies of about 250 wells, with a Qspec numerical calculation software specifically set up for the evaluation of the SINTACS C parameter.
The characterisation of the parameter in the areas that are not sufficiently covered by the aforementioned data was obtained using a protocol that is based on international statistics that allows the order of magnitude of the permeability of the different rock formations (hydrogeologic complexes) to be appraised, together with the SINTACS method. The different items of information relative to parameter C, appropriately reclassified according to the SINTACS points, have allowed the drawing up of the relative map, via GIS, at a 1:100.000 scale on a raster basis.
2.2.7. Slope
The different classes of slope (between 0 and 30 %) were directly obtained from the Regional DTM in the ARC/ INFO ambient and were then reclassified according to the SINTACS points.
The relative Map of the S10 parameter was thus prepared on a raster basis.
The Map, presented in 1:100.000 scale, was completely prepared in an automatic way. A grid of the heights was generated from the DTM and the grid of the topographic surface slope was generated from this using the SLOPE command. The range of the slope classes is defined by the user through a file in which the percentage slope intervals that one wishes to map are specified. The SINTACS method indicates the slope intervals and the points that are assigned to them. The polygonal cover of the slope from which the area of interest was cut was obtained using overlay operations with the cover of the border of the municipality area. The usual 50 metre side mesh was applied to the slope cover and the thus obtained grid was reclassified with the assignment of the relative SINTACS points.
2.2.8. Selection and Cartography of the Weight Strings
As known, the structure of the SINTACS method was thought up in order to be able to use various weight strings to attribute to parameters in function of different hydrogeologic and impact situations. In the present case, the conditions to apply 3 of the 6 strings were encountered, that is:
1) Areas subject to normal impact: barren areas, uncultivated or with spontaneous cultivations which however do not require the use of plant protection products or chemical fertilisers, unless in small doses, or irrigation practices. The breeding of a few wild animals, whether permanent or seasonal, often occurs in these areas.
2) Areas subject to relevant impact: areas with cultivation that foresee abundant treatments with plant protection products, chemical fertilisers, applications of fertirrigations, sewage spreading, uncontrolled dumping of waste materials, lagoons, petrol pipelines, sewage deposits, etc.; active and abandoned industrial areas, urban areas or similar.
3) Areas subject to drainage: from surface water bodies and shallow aquifer; depth to water areas subject to natural and man-made drainage networks; irrigation areas with large quantities of water, continuous or periodic outcropping areas of the unconfined piezometric surface.
The map and the relative grid were prepared using the standard procedures: traditional mapping, construction of the polygonal shape file in ARCVIEW and application of the usual ARC/INFO mesh.
3. Results
The combined approach was used to draw up the Intrinsic Vulnerability Map. The evaluation was carried out, for the so-called restricted area, using PCSM SINTACS where the necessary data were available. The GNDCI Basic method, suitably calibrated for the specific hydrogeologic situation, (combined approach), was used for the so-called enlarged area (Figure 5).
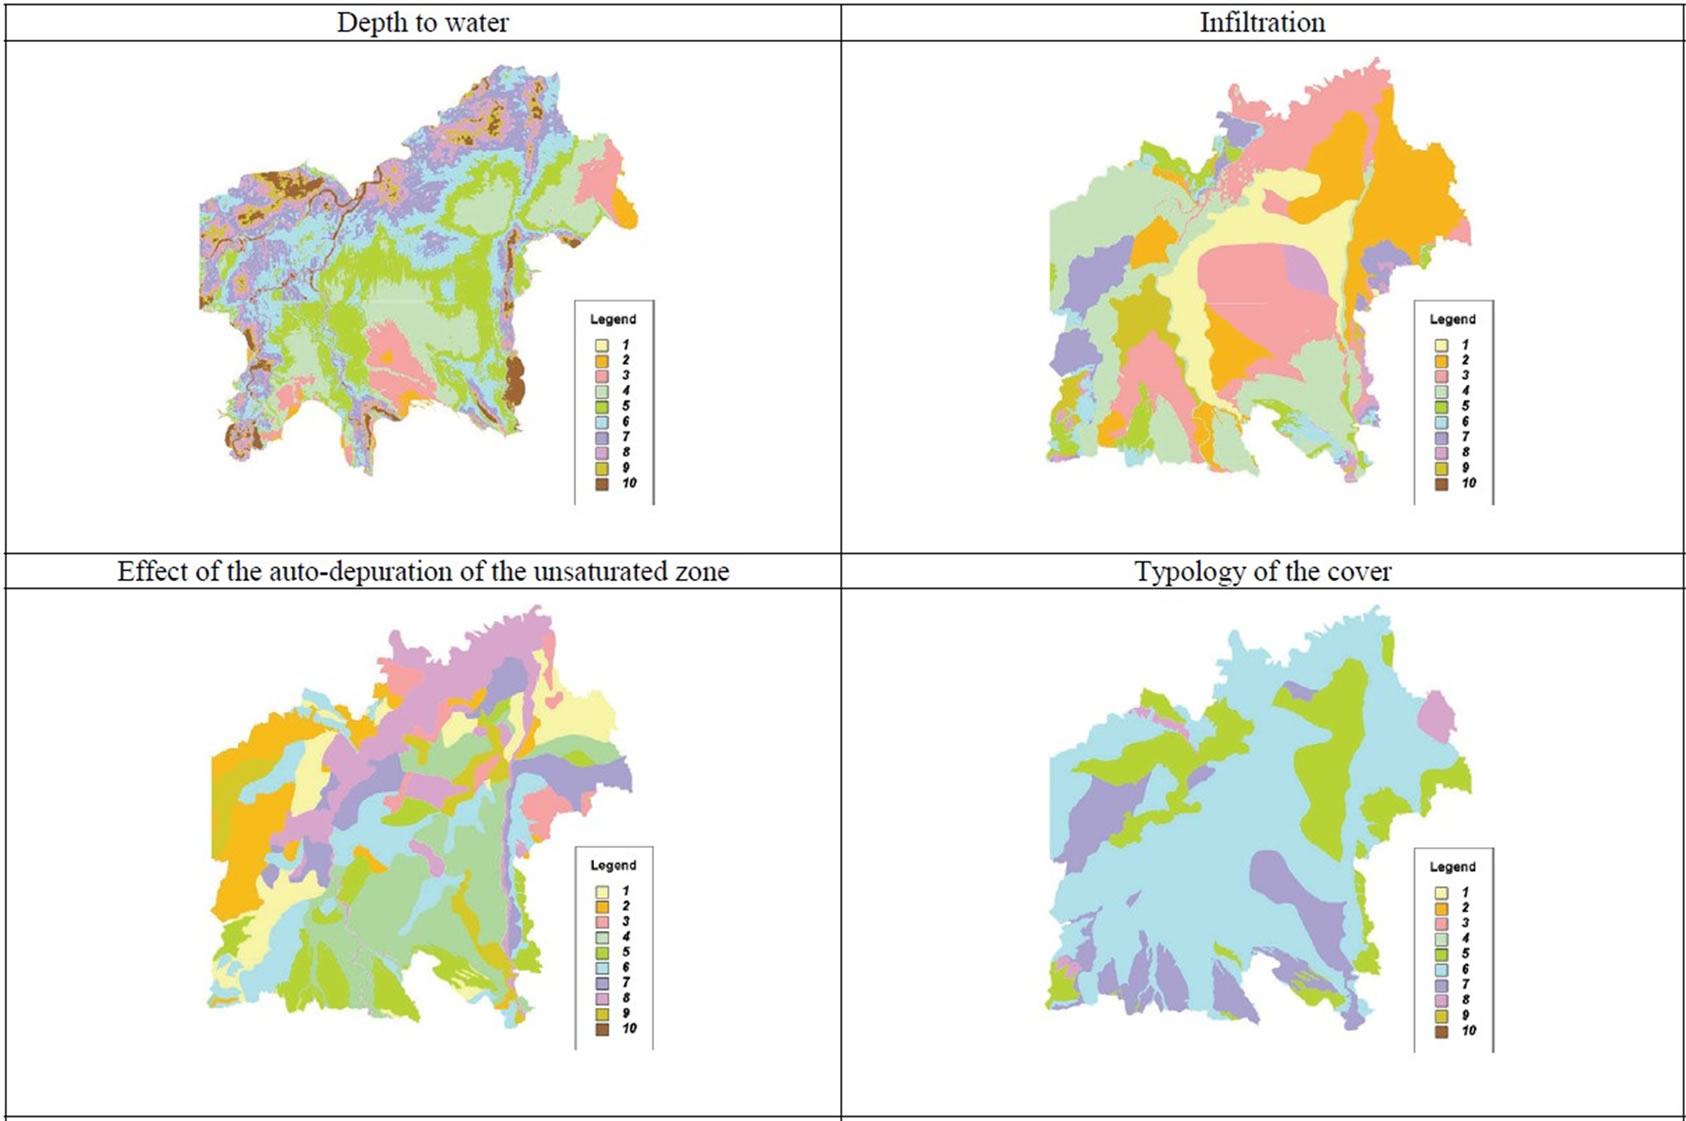
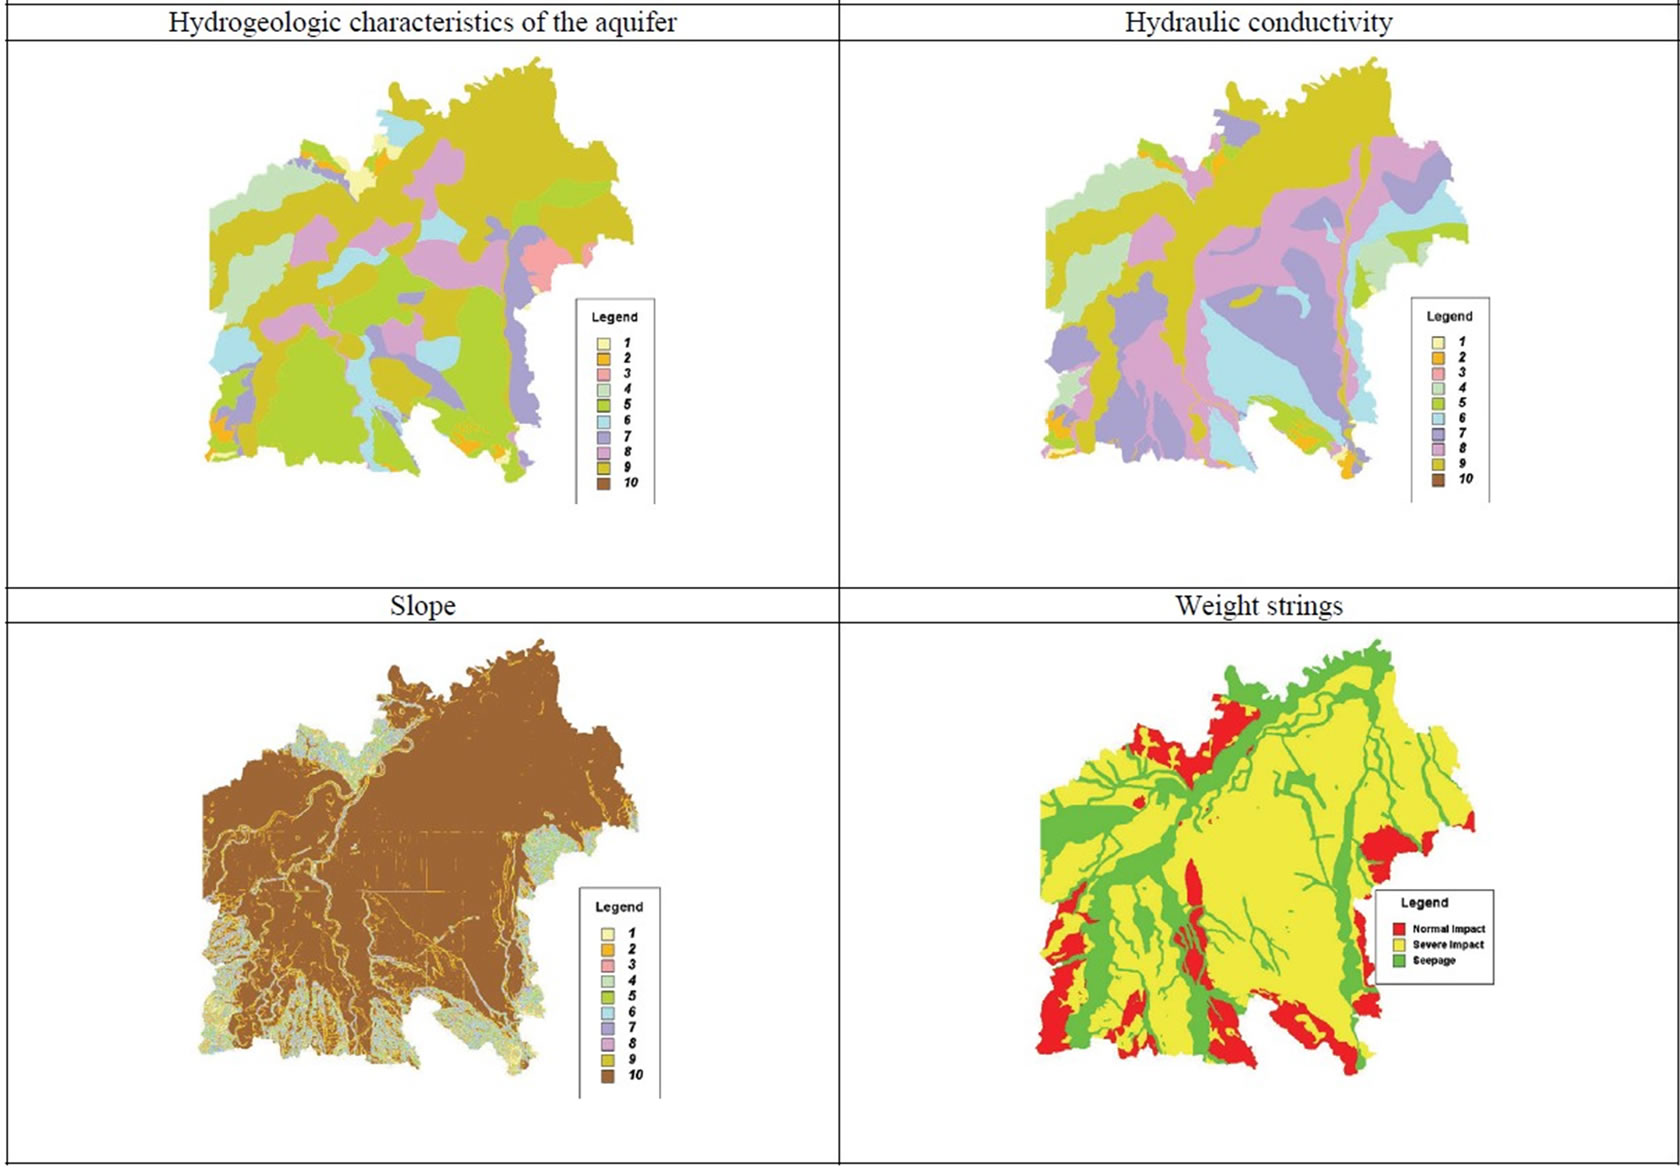
Figure 4. Lssandria plain: Parametric maps for SINTACS vulnerability map building.
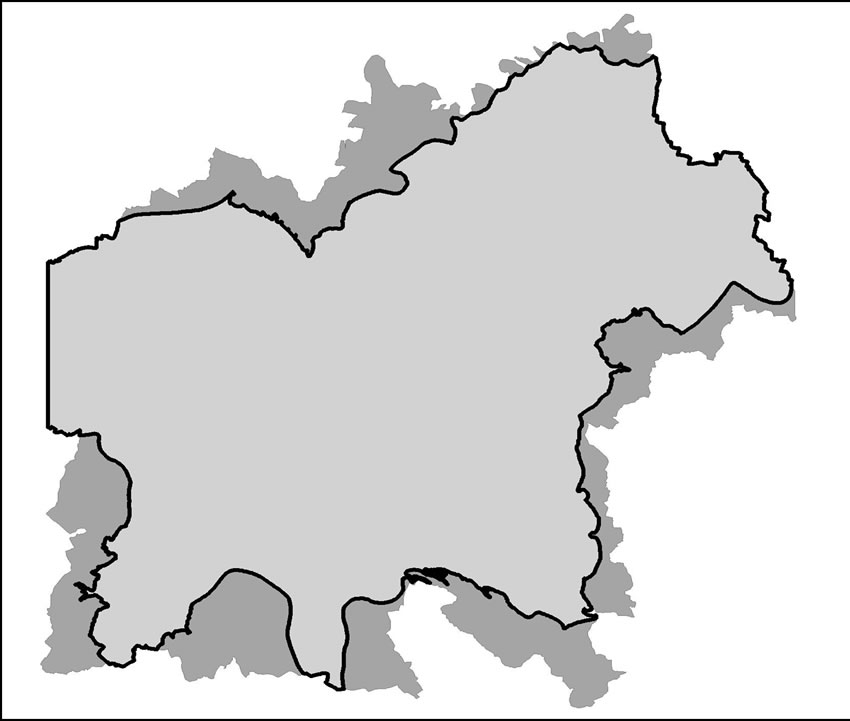
Figure 5. Light Grey: Restricted area elaborated with SINTACS; dark grey: enlarged area.
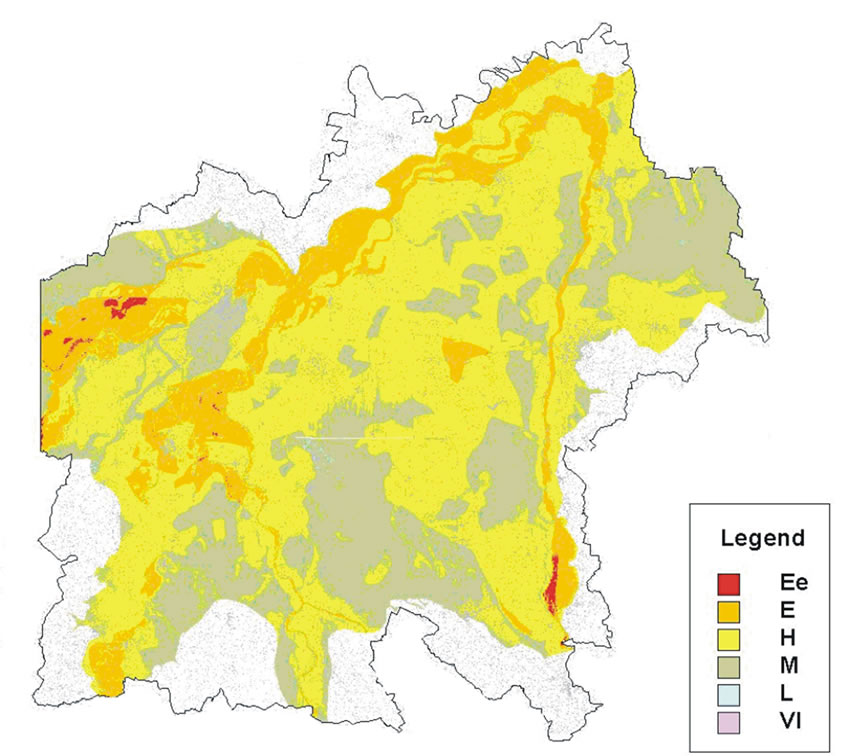
Figure 6. Vulnerability map. (Ee: extremely elevated; E: elevated; H: high; M: medium; L: low).
3.1. Vulnerability Map of the Restricted Area
The implementation of the SINTACS method to a GIS foresees:
1) Importation of the basic elaborations and production of the 8 basic thematic point maps to draw up the Vulnerability Map, relative to 7 SINTACS parameters and to the hydrogeologic and impact situation;
2) Production of the vulnerability map.
3) The vulnerability map (Figure 6) was obtained through implementation of a cell by cell procedure in a GRID ambient that foresees the verification of the value of the cell in the hydrogeologic impact characteristic grid and identification of the relative weight strings; and application of:
 (1)
(1)
The value of the SINTACS index of the single cells was then normalised through the implementation of another application of the relation cell by cell procedure [2]:
Inorm=(Isintacs-26)/2.34(2)
The Grid of the normalised intrinsic vulnerability was thus obtained and it was put on a raster basis and produced in three sheets at a 1: 50.000 scale. It was necessary to insert a thick black line to define the border between the area that was only elaborated with the SINTACS model and the so-called “enlarged” area which was elaborated with the Basic GNDCI-CNR Method.
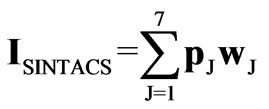
3.2. Vulnerability Map of the Enlarged Area
The classical method for discrete Hydrogeologic Complexes and Situations (HCS), which for many years was adopted for all the test sites studied as a part of the P.S. VAZAR program of GNDCI-CNR, was used for this map.
Details of this treatment can be found in the previous sections as far as the method is concerned and Table 6 shows the code that was attributed to the individual Complexes and Sub-Complexes, as far as the intrinsic vulnerability degree is concerned (Figure 7).
The congruence with the sintacs evaluation was confirmed with the criteria of the combined approach, introducing some corrections in some points that were however produced by the use of the estimation carried out with the rougher methodology.
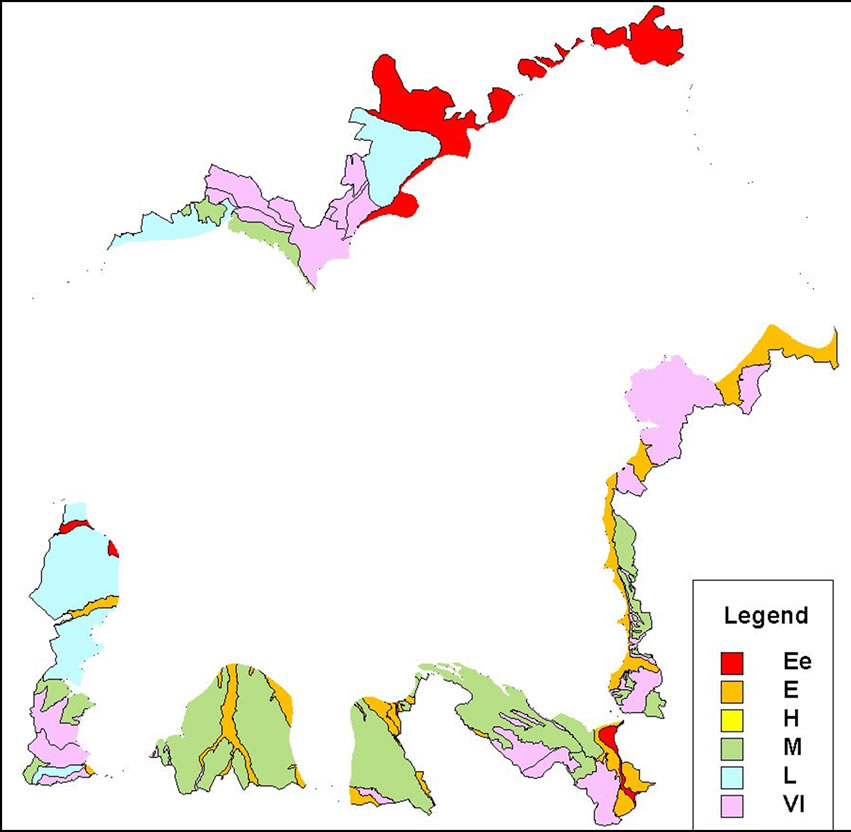
Figure 7. Vulnerability map of the enlarged zone.
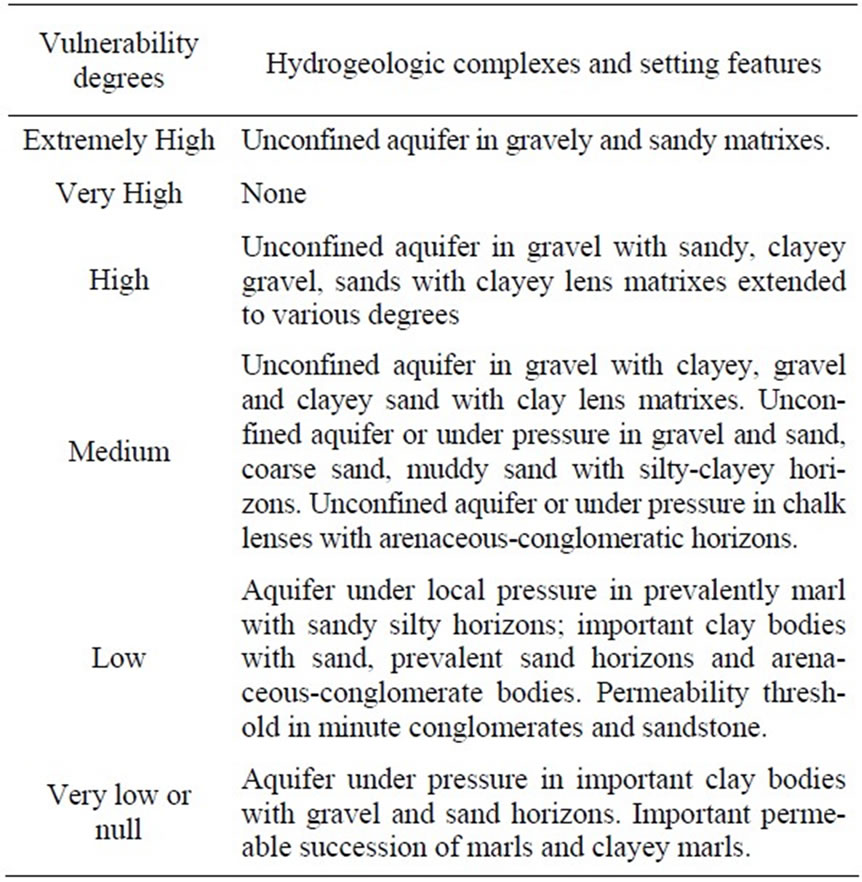
Table 6. Hydrogeologic complexes and their vulnerability degree (Basic GNDCI-CNR method).
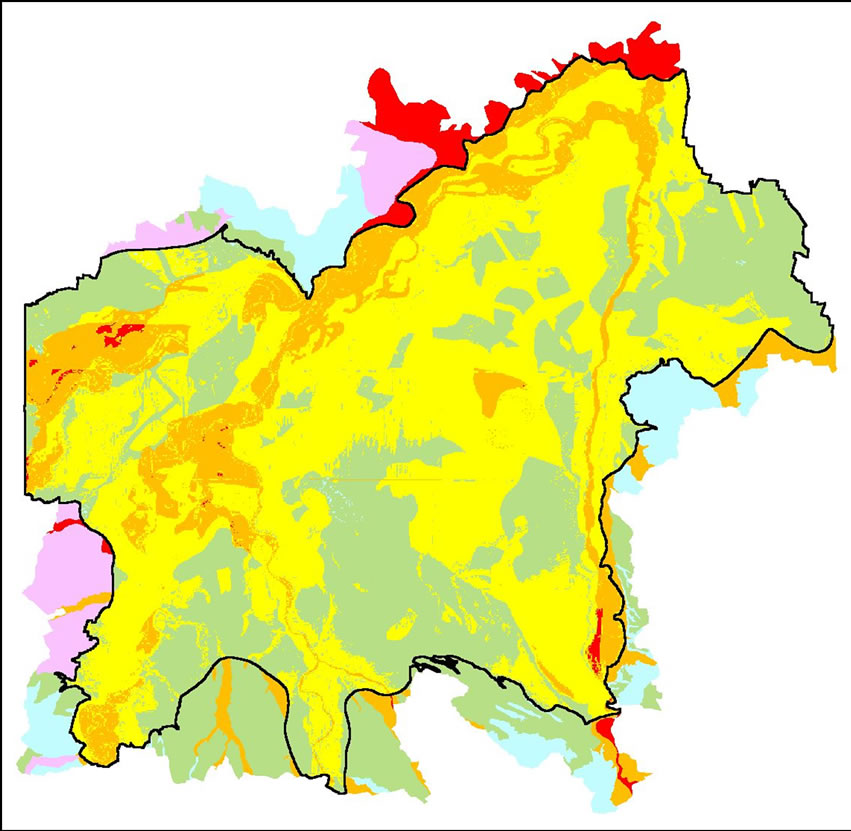
Figure 8. Vulnerability map of the entire zone.
4. Conclusions
The method that was applied to prepare the Intrinsic vulnerability map (Figure 8) has already been fully described in the previous sections.
From this map, it is possible to note the following remarks about the Alessandria district:
1) The vast Alessandria plain is characterised, with large extensions, by a high (H) degree of vulnerability of the aquifer to contamination;
2) The degree of vulnerability is just slightly lower (medium M) in the less depressed areas (terraces) of the low Tortona area (cfr. Figure 4 for the geographic locations); in the southern part of the Alessandia area; in the strip north of Solero; in the area east near Sezzadio;
3) In correspondence to the most important riverbeds and the relative floodable areas, the SINTACS index is greater than 70 (elevated vulnerability - E) and is often close to the border with the higher class (Ee - extremely elevated) for the area of Castellazzo B.-Sezzadio; to the south of the W province boundary; north east of Alessandia, next to the Tanaro river up to the convergence with the Po river;
4) All the flooded area of the Scrivia river is, likewise, in elevated (E) vulnerability conditions with some points in the higher degree (Ee) in the apical area of the fan (NW Novi Ligure): many uncontrolled waste disposal dumps of toxic and harmful materials were found in this area and structures subject to great risks are located in this area (e.g. the water intake system of the Novi Ligure aqueduct);
5) The waters from the Scrivia river derive in great part from numerous irrigation channels on the left that distribute the water from the river to areas with high to elevated vulnerability;
6) The hilly Tortonese areas, of Monferrato and the Alessandria part of the Langhe are usually characterised by a medium (M) to low (L) vulnerability degree.
REFERENCES
- M. V. Civita, “Legenda unificata per le Carte della vulnerabilità dei corpi idrici sotterranei: Unified legend for the aquifer pollution vulnerability maps,” Studi sulla Vulnerabilità degli Acquiferi, 1 (Annex), Pitagora Edit. Bologna, pp. 13, 1990.
- M. V. Civita, “Le carte della vulnerabilità degli acquiferi all’inquinamento: Teoria & pratica,” [Groundwater vulnerability maps to contamination: Theory and practice] Pitagora Editrice, Bologna, pp. 325 (with bibliography), 1994.
- M. V. Civita and M. De Maio, “Valutazione e cartografia automatica della vulnerabilità degli acquiferi all’ inquinamento con il sistema parametrico: SINTACS R5, a new parametric system for the assessment and automaticmap ping of groundwater vulnerability to contamination,” Pitagora Editrice, Bologna, pp. 240, 2000.
- M. V. Civita and M. De Maio, “Atlante delle carte di vulnerabilità delle regioni italiane,” [Atlas of vulnerability maps of the Italian regions] DBMAP, Florence, pp. 366, 2002.
- M. V. Civita, M. De Maio, M. Farina, and A. Zavatti, “Linee guida per la redazione e l’uso delle carte della vulnerabilità degli acquiferi all’inquinamento,” [Guidelines for drawing and use of the groundwater vulnerability maps to contamination] Agenzia Nazionale per la Protezione dell’Ambiente-Manuali e Linee guida, 1 CD, pp. 100, 2001.
- M. V. Civita, M. De Maio, and S. Lyakhloufi, “Assessment of groundwater intrinsic vulnerability of the Marrakesh Haouz aquifer (Morocco) by PCSM SINTACS,” GEAM, Vol. 24, No. 2–3, pp. 107–114, 1999.
- J. Uhan, J. Pezdic, and M. V. Civita, “Assessing groundwater vulnerability by SINTACS method in the lower Savinja Valley, Slovenia,” RMZ, Vol. 55, No. 3, pp. 363–376, 2008.
- J. Mejia, R. Rodriguez, and J. Mata, “The role of the river beds in the evaluation of vulnerability, the Lerma River, Salamanca, Mexico,” Proc. 2nd Workshop “Aquifer Vulnerability and Risk”, Colorno, Parma, pp. 9-10 + CD, September 21–23, 2005.
- S. Adelana and Y. X. Xu, “Vulnerability assessment in the cape flat aquifer, South Africa,” Proc. 2nd Workshop “Aquifer Vulnerability and Risk,” Colorno, Parma, pp. 21-22 + CD, September 21–23, 2005.
- D. De Ketelaer, H. Hötzl, C. Neukum, M. V. Civita, and G. Sappa, “Hazard analysis and mapping,” In: COST Action 620 “Vulnerability and Risk Mapping for the Protection of Carbonate (Karst) Aquifers” (Zwahlen F. Edit.), European Commission, Directorate-General for Research, EUR 20912, pp. 86–104, 2004.
- M. V. Civita, “La previsione e la prevenzione del rischio di inquinamento delle acque sotterranee a livello regionale mediante le carte di vulnerabilità,” [Forecasting and prevention of groundwater contamination risk at a regional level using vulnerability maps] In Proceedings Conf. Inquinamento delle acque sotterranee: Previsione e prevenzione, pp. 9–17, February 1987.
- L. J. Andersen and E. Gosk, “Applicability of vulnerability maps,” Int. Proceedings Conf. Vulnerab. of Soil and Groundwater to Pollutants, RIVM Proc. And Inf. Vol. 38, pp. 321–332, 1987.
- S. S. D. Foster and R. Hirata, “Groundwater pollution risk assessment: A methodology using available data,” Pan Ame. Cent. for Sanit. Engin. and Envir. Scien. (CEPIS) Lima, pp. 81, 1988.
- Y. Bachmat and M. Collin, “Mapping to assess groundwater vulnerability to pollution,” Proc. Int. Conf. Vulnerab. of Soil and Groundwater to pollutants, RIVM Proc. And Inf. Vol. 38, pp. 297–307, 1987.
- M. Albinet and J. Margat, “Cartographie de la vulnerabilitè à la pollution des nappes d’eau souterraine,” Bull. BRGM Paris, Vol. 2, 3, 4, pp. 13–22 (with bibliography), 1970.
- M. V. Civita, “L’assetto idrogeologico del territorio italiano: Risorse e problematiche,”[Hydrogeological outline of the Italian territory] Quaderni S.G.I., 3, 30, pp. (edition on line) www.socgeol.it, 2008.
- M. V. Civita, A. Massarutto, and G. Seminara, “Groundwater in Italy: A review,” EASAC Report on Ground Waters in Southern Europe Mediterranean Countries, Atti Conv. Accad. Lincei “Giornata dell’ Acqua 2008” (in print).
- J. Vrba and M. V. Civita, “Assessment of groundwater vulnerability,” Guidebook on mapping groundwater vulnerability, J. Vrba & A. Zaporozec (Edit.) IAH, Int. Contrib. to Hydrogeol, 16, Heise, Hannover, pp. 131 (with bibliography), 1995.
- L. Aller, T. Bennet, J. H. Lehr, R. J. Petty, and G. Hackett, “DRASTIC: A standardized system for evaluating groundwater pollution potential using hydrogeologic settings,” NWWA/EPA Ser., EPA600/287035, Vol. 455 pp. 11 Maps (with bibliography), 1987.
- R. Piemonte, “Relazione finale del Progetto Bacino del fiume Tanaro: Studio sui potenziali rischi dovuti all’ alluvione del novembre 1994 e realizzazione di una rete di monitoraggio delle acque sotterranee nonché identificazione dei siti potenzialmente pericolosi e valutazione della vulnerabilità della falda,” [Final report of the project “Tanaro River Basin: Study of the potential hazards from disastrous flood Nov. 1994, groundwater monitoring network, hazardous sites and aquifer vulnerability assessing”] Torino, pp. 254 (unpublished), 2000.
- M. V. Civita, M. De Maio, and E. Suozzi, “Upgrading the hydrogeological potential balance method for high mountain areas,” (in print), 2009.
- M. V. Civita and D. Persicani, “Approccio teorico alla definizione e stima della capacità di attenuazione del suolo nei modelli parametrici di valutazione della vulnerabilità degli acquiferi all’inquinamento,” [Theoretic approach when defining and assessing of the attenuation capacity of soils within the parametric models of evaluation of groundwater vulnerability to contamination] GEAM, Vol. 4, pp. 209–214, 1996.
- IPLA, “La capacità d’uso dei suoli in Piemonte ai fini agricoli e forestali,” Regione Piemonte, Istituto per le Piante da Legno e l’Ambiente, pp. 290, 3 Maps, 1982.
- E. Capri, M. V. Civita, A. Corniello, G. Cusimano, M. De Maio, D. Ducci, G. Fait, A. Fiorucci, S. Hauser, A. Pisciotta, G. Pranzini, M. Trevisan, A. Delgado Huertas, F. Ferrari, R. Frullini, B. Nisi, M. Offi, O. Vaselli, and M. Vassallo, “Assessment of nitrate contamination risk: The Italian experience,” Journal of Geochemical Exploration, pp. 1–16 (DOI:10.1016/j.gexplo.2009.02.006), 2009.
- M. V. Civita, “QSPEC: Software codex,” Realize 1 (in edite), 1997.
NOTES
1The acronym stands for “Vulnerability of Aquifers in High Risk Zones”.
2GNDCI-CNR stands for National Group for the Defence against Hydrogeologic Disasters of the Italian National Council of Research.
3Law Decree n. 152, May 11 1999 “Orders on the protection of water against contamination” and acknowledgement of the 91/271/CEE Directive regarding the treatment of urban wastewater and the 91/676/ CEE Directive regarding the protection of water against contamination by nitrates from agricultural sources.
4CSC=Contamination Spreading Centre.
5The Italian National Research Programme has produced, between 1984 and 2005, about 150 vulnerability maps using various methods, covering all the hydrogeologic scenarios of the Country (see Civita & De Maio, 2002).
6The choices that are made, as known, are based on over 13 years of research and experiments in the field, carried out by researchers who have taken part in the GNDCI-CNR Research Programme Aquifer Vulnerability Assessment (about 100 researchers within 21 Research Units all Country wide).
7The time has to add to the normal 3 dimensions that describe the volume and, in this particular case, the TOT should also be added.
8DCS=Diffused Contamination Sources.
9Territorialization means the method, geostatistically based, that allows the punctual value of a opportunely surveyed parameter to be assigned to a territorial frame.
10This is obviously the second “S” of the SINTACS acronym.