World Journal of AIDS
Vol.3 No.2(2013), Article ID:32256,6 pages DOI:10.4236/wja.2013.32011
Control Model of the HIV/AIDS Epidemic Based on Kinetic Equation
![]()
1School Hospital, Guilin Normal College, Guilin, China; 2The Centers for Disease Control and Prevention, Guilin, China; 3The HIV/ AIDS Prevention and Control Working Committee, Guilin, China.
Email: *yltoutou@163.com
Copyright © 2013 Cuihuan Xiong et al. This is an open access article distributed under the Creative Commons Attribution License, which permits unrestricted use, distribution, and reproduction in any medium, provided the original work is properly cited.
Received March 31st, 2013; revised April 30th, 2013; accepted May 8th, 2013
Keywords: Dynamics Equation Model; HIV/AIDS; Persuade Rate; Disease Mortality; Infection Rate
ABSTRACT
The corresponding dynamics equation model of HIV/AIDS was given based on the popular situation of HIV/AIDS in recent years. We studied the stability of the equilibrium point, discussed the threshold of epidemic, and carried on the numerical simulation based on the different persuade rate P, the different disease mortality α and the different infection rate β. The HIV/AIDS epidemic disease can pop in city at R0 > 1. We suggested that more persuade should be increased in addition to strengthening routine work according to the characteristics of R0 in the prevented and the controlled work of HIV/AIDS, which could more effectively reduce the number of HIV/AIDS patients. It provided the theoretical guidance, the beneficial reference on the prevented and the controlled work of HIV/AIDS.
1. Introduction
The AIDS program of the United Nations released “unaid report on the global aids epidemic/2012” in November 20, 2012 at Geneva [1]. The report showed that the positive results worldwide have yielded in AIDS prevention and taken unprecedented dynamics response action, the new HIV infection rate is reduced by more than 50% in 25 low-income countries. However, there are 34 million people globally HIV infected in 2011 according to agency figures, including 2.5 million new infections, and 1.7 million people died from diseases associated with HIV/AIDS. In addition, 6.8 million people can’t be healed timely, the prevention and control of AIDS is still severe [2].
It is original to just use some simple observation data and statistical data to make analysis and inference for the research of the spread of HIV/AIDS, HBV and HCV etc., but this does not effectively reflect the nature of the spread [3]. At present the research of the spread of AIDS has put into dynamics equation in the international academic community, namely, it is to reflect the basic phenomenon of differential equation model, then the solution of the corresponding equation is gained by using mathematical analysis method [4], which is a combination of interdisciplinary theory (biology, medicine and mathematics etc.) to research the dynamic rule. Basing on the survey of HIV/AIDS epidemic of a city, combining the corresponding nonlinear dynamics equation model and the perturbation theory of the modern mathematics, we discussed the stability of the equilibrium point and the epidemic threshold, and given the corresponding HIV/AIDS epidemic dynamics model from the viewpoint of population ecology research of the HIV/AIDS transmission characteristics. In addition, the different persuade rate P, the different mortality for disease α and the different infection rate β were separately carried on the numerical simulation, which provided the prevention and control strategy of HIV/AIDS with the theoretical guidance and the beneficial reference. It has also very important reference value to the hepatitis b and hepatitis c etc. with the similar epidemic route.
“The analysis report of AIDS epidemic in 2011” showed the first case of people infected with HIV (overseas personnel) was found in 1989, since then there had been accumulatively reported 2600 cases in this city, which is about one person infected with HIV or one patient per two thousand people. There were more than 800 cases in one county, between 401 - 500 cases in two counties, between 201 - 400 cases in five counties, under 200 cases in other nine counties, and the HIV/AIDS epidemic was growing rapidly in some counties in recent years. The report also showed that AIDS virus infections were priority to the low-income group such as the migrant workers in recent years. The top three careers of the new HIV infections and AIDS patients in the first 6 months report of 2011 were farmers, accounted for 72.3%, housekeeping and unemployment, accounted for 5.37%, and retiree, accounted for 5.08%. The AIDS virus infection was priority to men, accounted for about 67.8%, and women, accounted for 32.2%. The report also showed that the number of the person with HIV/AIDS and AIDS patients by sexual transmission increased year by year in recent years in the new report of the city, such as the sexual transmission ratio was only 19.1% in 2005, but reached to 92% in 2010, and reached to 93.7% in JanuaryJune of 2011. In addition, the proportion of the elderly patients infected with HIV raised fast. The percentage of the person with HIV/AIDS over sixty years old was about 18% in 2008, the proportion of elderly AIDS patients was 12%, and the proportion of the elderly AIDS death was 22%. By the first half of 2011, the percentage of the person with HIV/AIDS over sixty years old was about 31%, the proportion of elderly HIV/AIDS patients was about 24%, the proportion of the elderly AIDS death was about 42%.
By the end of the first half of 2011, there were 219 cases died of AIDS, accounted for 33.5% of the epidemic. There were 34 patients died in 2011, accounted for 65.7% of deaths in 2010. The overall mortality declined obviously, which owed to the prevention and control work of HIV/AIDS epidemic and the increasing antiviral treatment point of the city in recent years [5].
2. The Model of the HIV/AIDS
The total population of the city  is divided into four categories: the at-risk group, the group with HIV, the AIDS patients, the persuade group. We can use the nonlinear dynamic equation to describe the spread of the disease process:
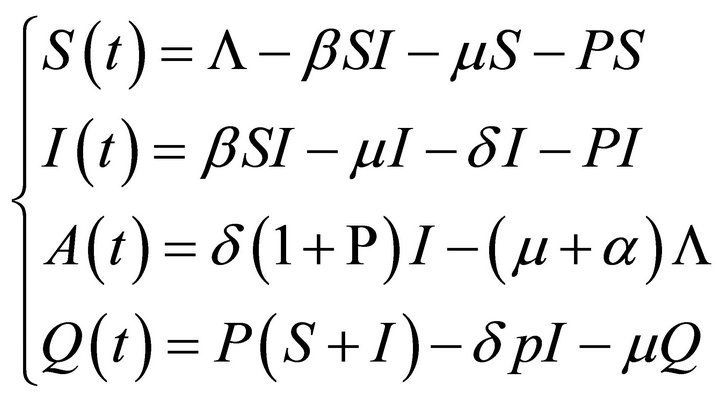 (1)
(1)
where S(t) is the number of the at-risk group at the t moment, I(t) is the number of the group with HIV at the t moment, A(t) is the number of the AIDS patients at the t moment, Q(t) is the number of the persuade group at the t moment,  is the infection rates of sexual transmission, μ is the natural mortality, α is the mortality because of disease, δ is the conversion rate of development of the HIV virus to AIDS, P is the persuade rate, namely not contact with the high-risk groups in “persuasion”, and then AIDS disease no longer spread.
The initial value: S(0) = S0, I(0) = I0, A(0) = A0, Q(0) = Q0, the parameter β, α, δ, μ, P are non-negative, population is described by N(t) = S(t) + I(t) + A(t) + Q(t) or the Formula (2):
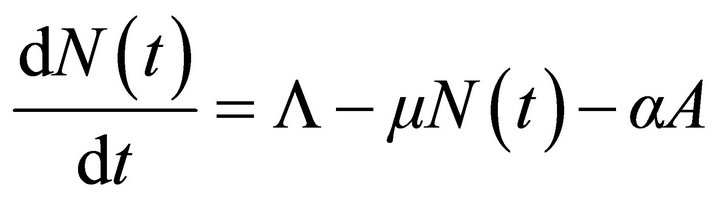 (2)
(2)
Make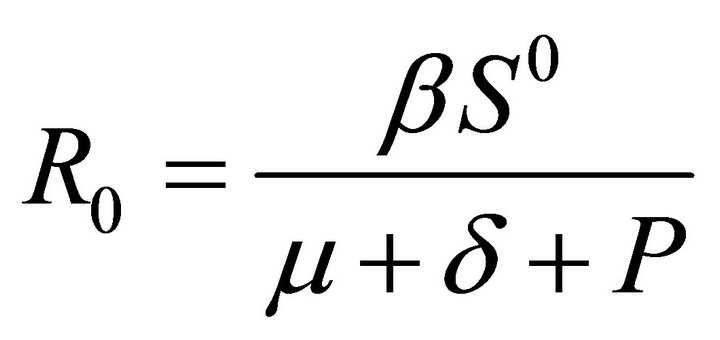 , R0 is the average of patients infected by HIV in the susceptible population.
Theorem 1, I) if R0 < 1, System (1) have only the equilibrium points without infectious diseases (S0, I0, A0, Q0), then
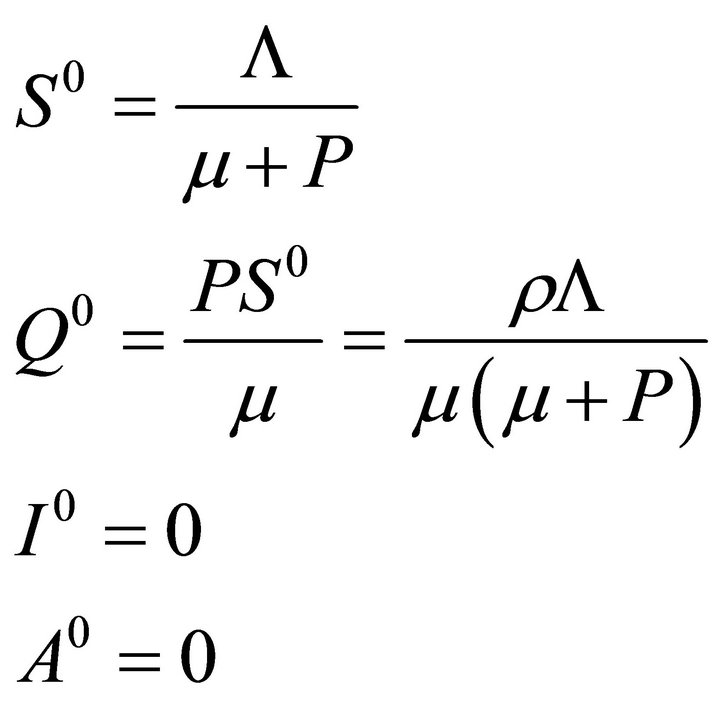 (3)
(3)
II) if R0 > 1, System (1) have the equilibrium points of the local epidemic E*=(S*, I*, A*, Q*), then
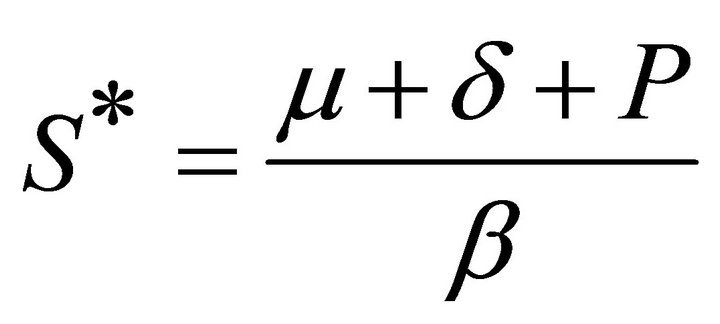 (4)
(4)
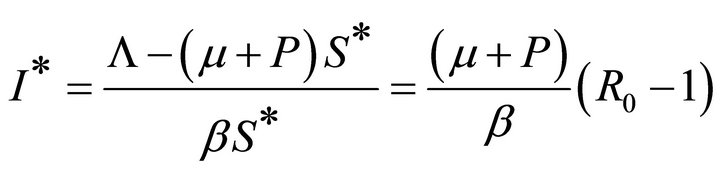 (5)
(5)
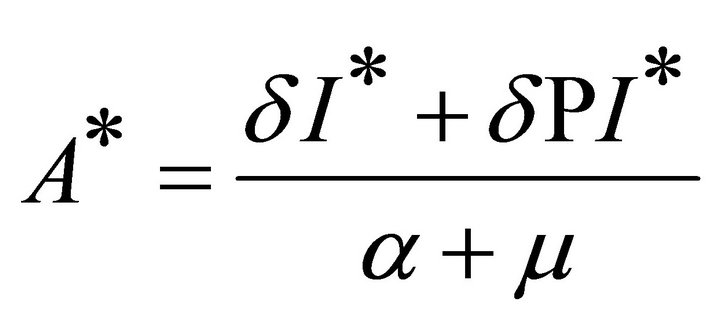 (6)
(6)
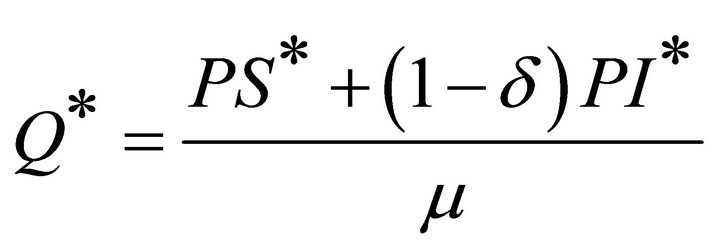 (7)
(7)
3. Stability of HIV/AIDS Model of the Equilibrium Point
Theorem 2 if R0 < 1, the equilibrium points without infectious diseases is locally asymptotically stable, while R0 > 1, the equilibrium points without infectious diseases is not stable.
Proof: the characteristic equation of the obviously system (1) in the disease-free equilibrium is described by the formula (8) [6]:
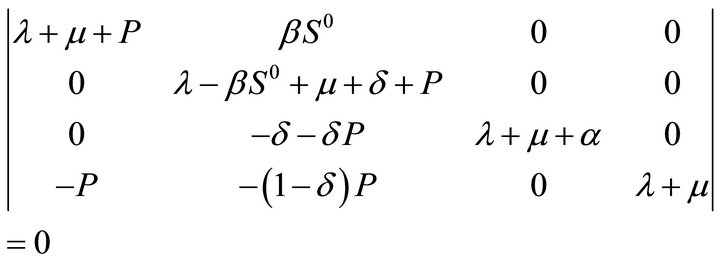 (8)
(8)
Namely:
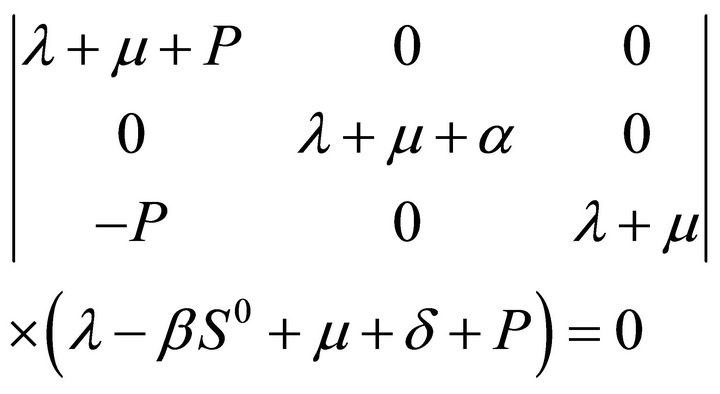 (9)
(9)
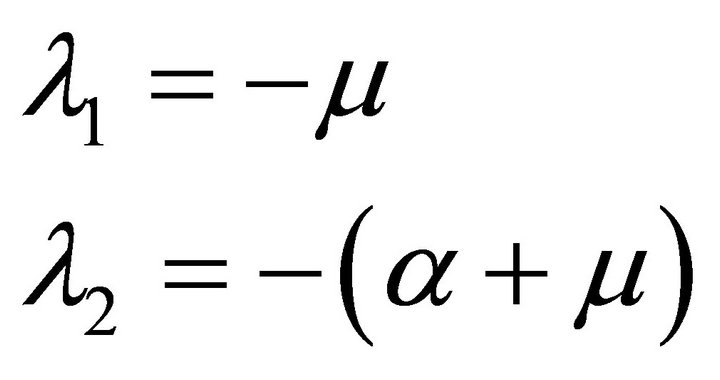
Obtain:
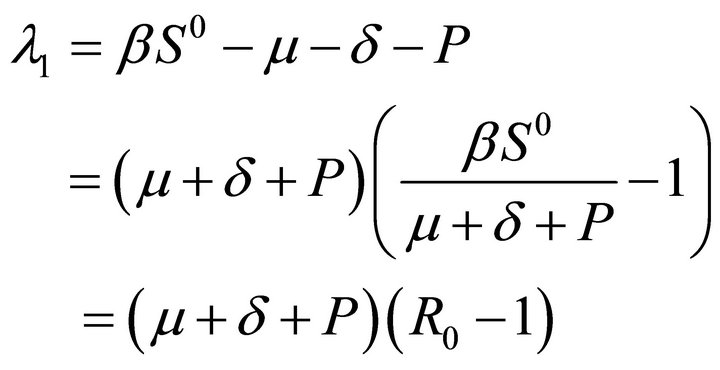 (10)
(10)
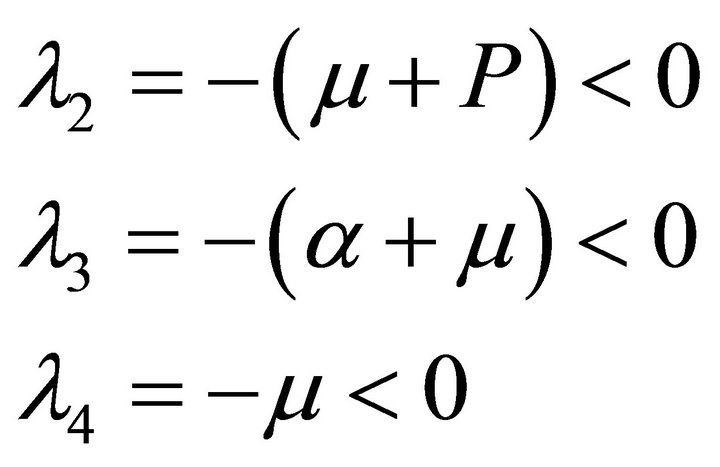 (11)
(11)
So the equilibrium points without infectious diseases is locally asymptotically stable at R0 < 1, and the equilibrium points without infectious diseases is not stable at R0 > 1.
Theorem 3 the equilibrium balance E* of the local infectious disease is locally asymptotically stable at R0 >1.
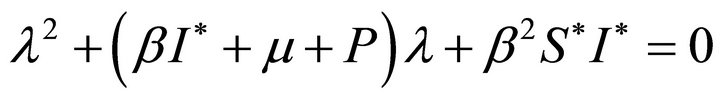
Proof: the characteristic equation of the equilibrium balance E* of the local infectious disease is described by the following Formula (12):
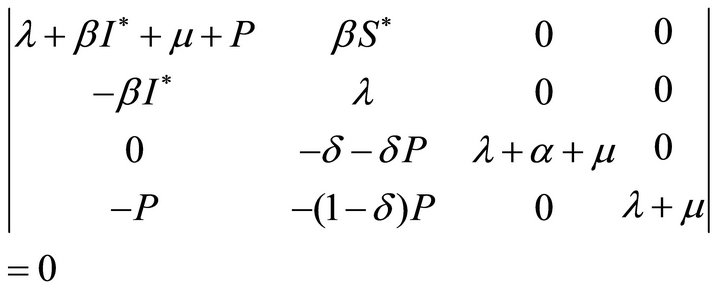 (12)
(12)
Namely
 (13)
(13)
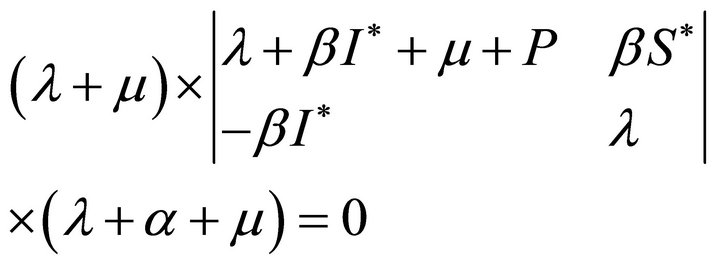
Obtain
 (14)
(14)
 and
and  are the two roots. In addition, because
 (15)
(15)
Then
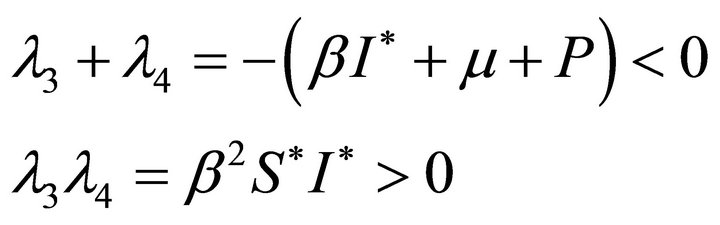 (16)
(16)
Namely
 (17)
(17)
So the equilibrium balance E* of the local infectious disease is stable at R0 > 1.
4. Numerical Simulation Analysis of HIV/AIDS Model
We estimated the initial numerical of the model in order to validate the validity of the system (1) relative to the data about HIV of the report of the city, N(0) = 11983 was the number of persons surveyed in 2010 as the initial population, I(0) = 293 was the number of the infected persons in 2010, A(0) = 47 was the number of ADIS patients at the end of 2010, λ = 9000 was the number of the annual flowing persons (immigration). Then we set the parameters Λ = 10, β = 0.02, μ = 0.02, δ = 0.1, α = 0.33, P = 0.1, and
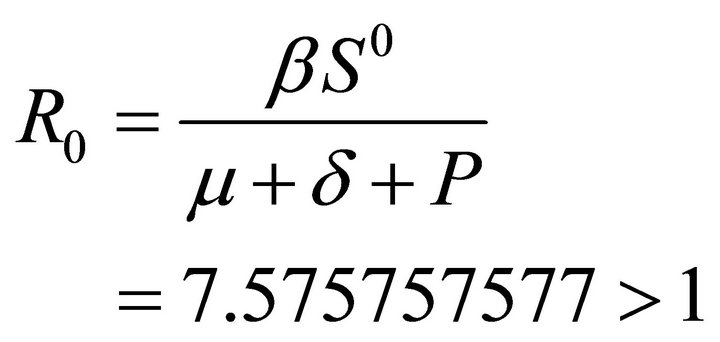 (18)
(18)
The following figure showed its stability. If there are not immigrants, the four people would continue to reduce as shown in Figure 1, which first lead to an increase and then decrease in the number of people with HIV, and finally destroy because of dying from disease when the total number is constant. Figure 2 is the sequence diagram of the four people and the time if there are immigration, the number of the easily infecting person first increase, so the infected person become endemic and the population is continuous over time [7]. The Figures 3-6 are the sequence diagram of the group with HIV, AIDS patients, persuade group and the time. With the increase of P, the persuade group increases and the group with HIV decrease, which causes that the number of AIDS patients will reduce. So it is effective that increase consciously the efforts of persuade so as to make the spread of disease range minimum [8,9]. The Figures 7 and 8 are the sequence diagram of the HIV/AIDS and the time at
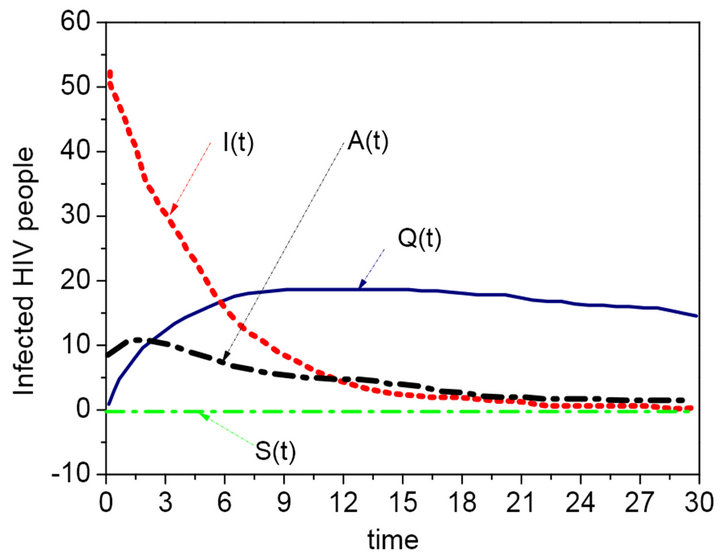
Figure 1. Sequence diagram of the four people and the time (no immigration).
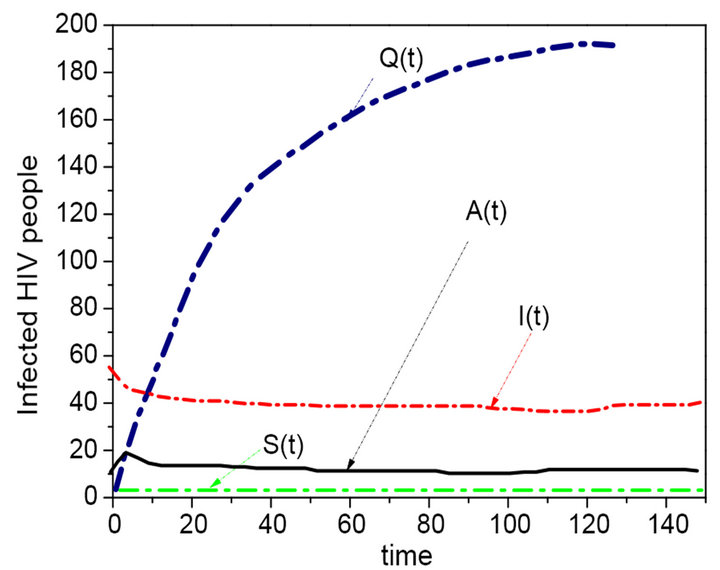
Figure 2. Sequence diagram of the four people and the time (immigration).
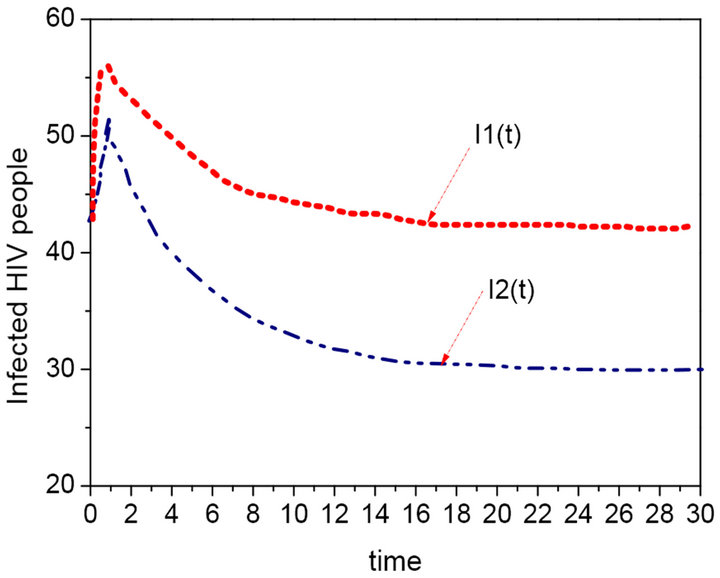
Figure 3. Sequence diagram of the HIV infection with different persuade rate P (P = 0.1, P = 0.2).
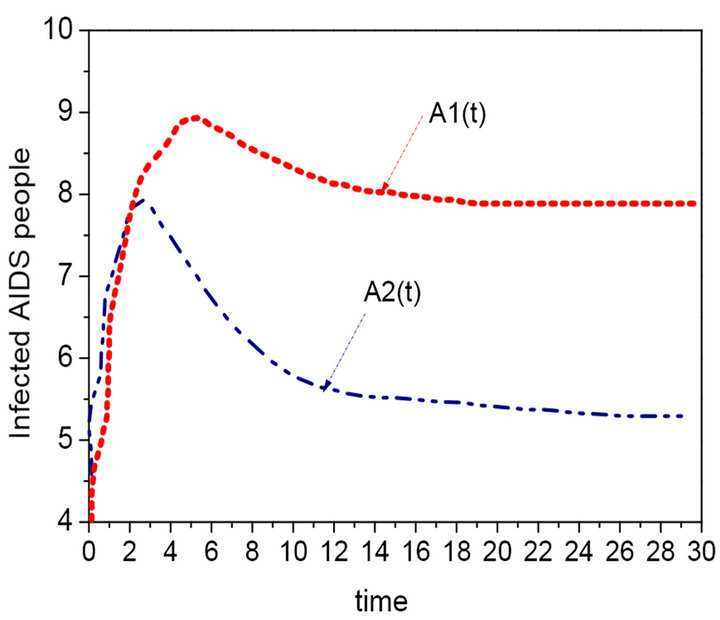
Figure 4. Sequence diagram of the AIDS infection with different persuade rate P.
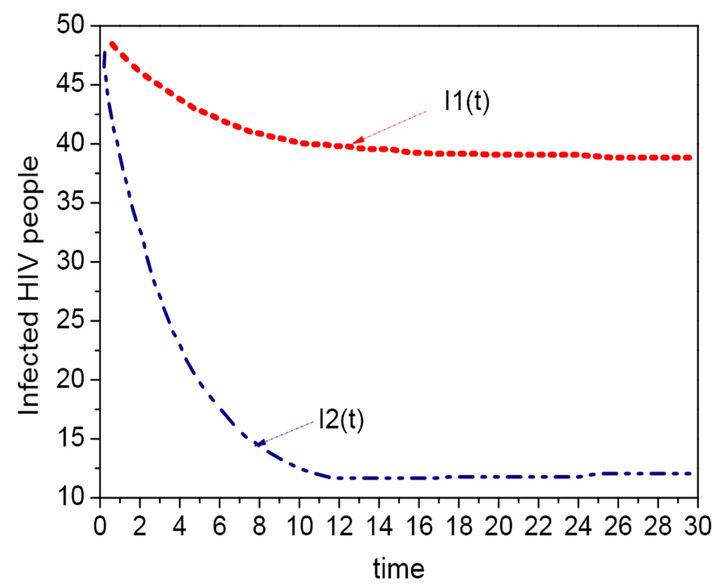
Figure 5. Sequence diagram of the group with HIV (β = 0.02, 0.15).
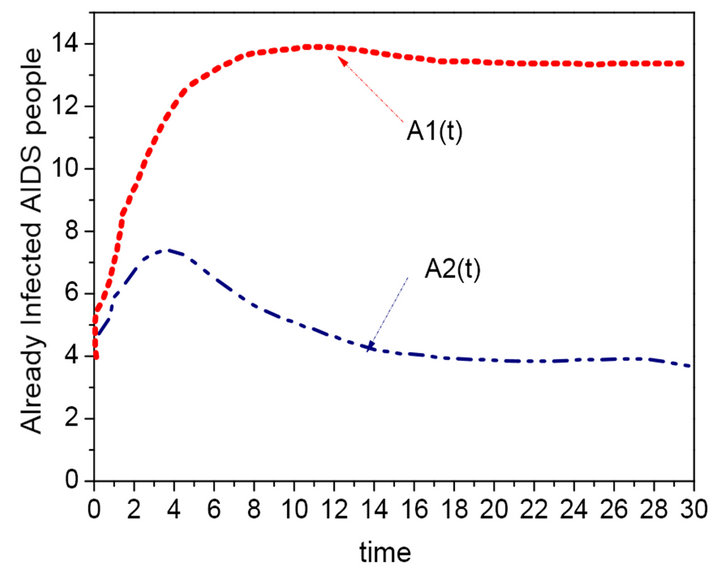
Figure 6. Sequence diagram of the AIDS patients (β = 0.02, 0.15).
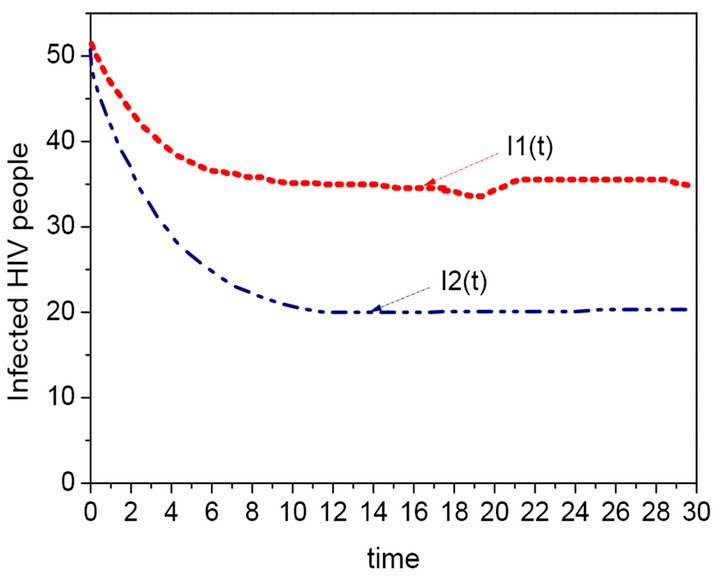
Figure 7. The sequence diagram of the HIV and time with different value of δ (δ = 0.1, 0.02).
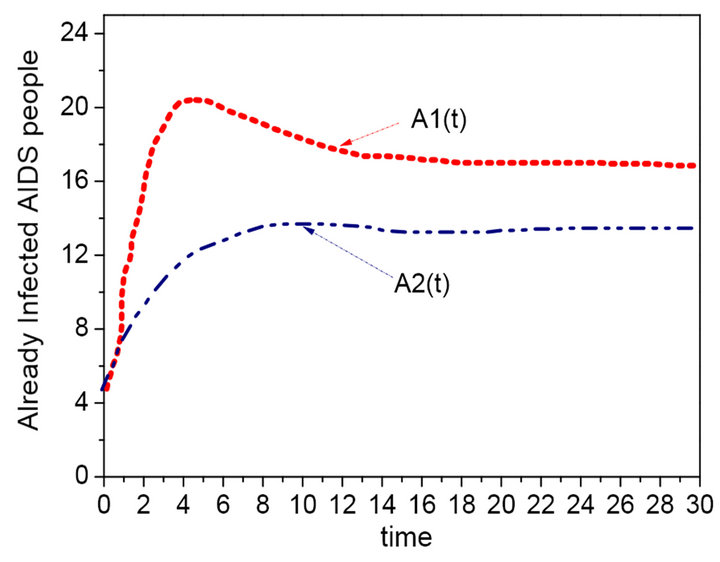
Figure 8. The sequence diagram of the AIDS and time with different value of δ (δ = 0.15, 0.02).
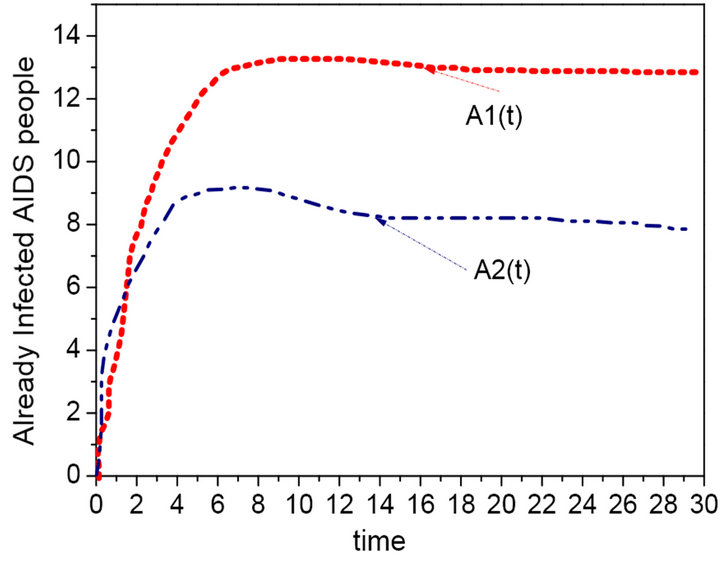
Figure 9. The effect of mortality due to illness α (α = 0.33, 0.5).
different value of the conversion rate δ, the persuade group and the group with HIV decreases with the increase of the conversion rate δ, which lead to the increase of the AIDS patients. Figure 9 is the effect of mortality due to illness α, the AIDS patients will reduce gradually along with the increase of α. In a word, the related groups are equilibrium level. The local infection balance points are not only locally asymptotically stable but also globally asymptotically stable [10].
5. Conclusion
The HIV/AIDS epidemic model was set up according to the characteristics of HIV/AIDS epidemic in the city, and the stability of the equilibriums and the epidemic threshold value were discussed and simulated numerically. It was concluded that the HIV/AIDS epidemic disease could pop in city at R0 > 1. We suggested that more persuade should be increased in addition to strengthening routine work according to the characteristics of R0 in the prevented and the controlled work of HIV/AIDS, which more effectively reduced the number of HIV/AIDS patients, and provided a theoretical basis for the prevented and the controlled strategy of the popular disease in city.
6. Acknowledgements
This work was supported by the province science and technology in the Guangxi offends pass item (No. 1099043), province science and technology in the Guilin offends pass item (No. 20120106), and start-up funding of Guilin university of technology (No. 002401003330 and No. 002401003329).
REFERENCES
- R. Kandwal, P. K. Garg and R. D. Garg, “Health GIS and HIV/AIDS Studies: Perspective and Retrospective,” Journal of Biomedical Informatics, Vol. 42, No. 4, 2009, pp. 748-755. doi:10.1016/j.jbi.2009.04.008
- E. J. Singer, M. Valdes-Sueiras, D. Commins and A. Levine, “Neurologic Presentations of AIDS,” Neurologic Clinics, Vol. 28, No. 1, 2010, pp. 253-275. doi:10.1016/j.ncl.2009.09.018
- R. Arnab and S. Singh, “Randomized Response Techniques: An Application to the Botswana AIDS Impact Survey,” Journal of Statistical Planning and Inference, Vol. 140, No. 4, 2010, pp. 941-953. doi:10.1016/j.jspi.2009.09.019
- Z. Mukandavire, C. Chiyaka, G. Magombedze, G. Musuka and N. J. Malunguza, “Assessing the Effects of Homosexuals and Bisexuals on the Intrinsic Dynamics of HIV/AIDS in Heterosexual Settings,” Mathematical and Computer Modelling, Vol. 49, No. 9-10, 2009, pp. 1869- 1882. doi:10.1016/j.mcm.2008.12.012
- P. van den Driessche and J. Watmough, “Reproduction Numbers and Sub-Threshold Endemic Equilibria for Compartmental Models of Disease Transmission,” Mathematical Biosciences, Vol. 180, No. 1-2, 2002, pp. 29-48. doi:10.1016/S0025-5564(02)00108-6
- J. M. Hyman and J. Li, “An Intuitive Formulation for the Reproductive Number for the Spread of Diseases in Heterogeneous Populations,” Mathematical Biosciences, Vol. 167, No. 1, 2000, pp. 65-86.
- W. Z. Huang, K. L. Cook and C. C. Carlos, “Stability and Bifurcation for a Multiple Group Model for the Dynamics of HIV/AIDS Transmission,” SIAM Journal on Applied Mathematics, Vol. 52, No. 3, 1992, pp. 835-854. doi:10.1137/0152047
- S. M. Moghadas and A. B. Gumel, “Stability of a TwoStage Epidemic Model with Generalized Nonlinear Incidence,” Mathematics and Computers in Simulation, Vol. 60, No. 1-2, 2002, pp. 107-118. doi:10.1016/S0378-4754(02)00002-2
- R. Naresh, A. Tripathi and D. Sharma, “Modelling and Analysis of the Spread of AIDS Epidemic with Immigration of HIV Infectives,” Mathematical and Computer Modelling, Vol. 49, No. 5-6, 2009, pp. 880-892. doi:10.1016/j.mcm.2008.09.013
- H. Ying and S. P. Sheu, “The Effect of the Density-Dependent Treatment and Behavior Change on the Dynamics of HIV Transmission,” Journal of Mathematical Biology, Vol. 43, No. 1, 2001, pp. 69-80. doi:10.1007/s002850100087
NOTES
*Corresponding author.