World Journal of Mechanics
Vol. 3 No. 2 (2013) , Article ID: 30860 , 10 pages DOI:10.4236/wjm.2013.32009
Measurement of the Deformation of Aluminum Alloys under High Strain Rates Using High Speed Digital Cameras
1Department of Mechanical Engineering, Howard University, Washington DC, USA
2Department of Mechanical Engineering, University of Saskatchewan, Saskatoon, Canada
Email: *gbadebo.owolabi@howard.edu
Copyright © 2013 Gbadebo Owolabi et al. This is an open access article distributed under the Creative Commons Attribution License, which permits unrestricted use, distribution, and reproduction in any medium, provided the original work is properly cited.
Received January 31, 2013; revised March 9, 2013; accepted March 16, 2013
Keywords: Split Hopkinson Pressure Bar; Torsion Kolsky Bar; Digital Image Correlation System; Adiabatic Shear Band; Post Deformation Analysis
ABSTRACT
Aluminum alloys exhibit an attractive combination of mechanical and physical properties such as high stiffness and low density, which favors their utilization in many structural applications. Thus, increasing the structural applications of aluminum alloy is the driving force for the need to adequately understand its deformation and failure mechanisms under various types of dynamic loading conditions. In this study, full field plastic deformation of AA6061-T6 aluminum alloy at high strain-rates under compressive and torsion loads are measured using split Hopkinson compression, torsion Kolsky bars, and a high speed digital image correlation system. The stress-strain curves obtained using the high speed digital cameras are compared with results obtained from the elastic waves in the compression and torsion bars. A post deformation analysis of the specimen also shows strain localization along narrow adiabatic shear bands in the AA6061-T6 alloy.
1. Introduction
Plastic deformation behavior of metals and alloys at high strain rates has continued to attract research interest in order to understand their deformation and failure mechanisms at rapid rates of loading. Strain rates generated under massive and rapid loading condition such as high velocity impact can be in excess of 103 s−1 [1]. The dynamic and fracture behavior of materials at such high strain rates are different from those normally observed under quasi-static loading conditions. Ductile materials under mechanical loading conditions undergo elastic and plastic deformation before failure. During elastic deformation, the deformation is uniform and recoverable when the load is removed. When the elastic limit is exceeded, the deformation becomes plastic and the material is not recoverable when the load is removed. At the initial stage of plastic deformation, the strain hardening occurs due to dislocation interactions up to point of maximum stress. The subsequent stage of plastic deformation depends on the type of load applied which can be fatigue, creep, impact, quasi-static tensile or compressive loading. The basic mechanisms of plastic deformation under quasi-static loading, that is the strain rate between 10−5 to 10−1 s−1 are by slip and twinning. The failure is typical preceded by necking (for tensile loading) and buckling (for compression loading). Deformation and failure under dynamic shock loading are known to be characterized by shear strain localizations. High strain rate impacts have been observed in a wide range of engineering processes such as chip formation in machining [2], dynamic deformation processes, and military technologies concerned with ballistics [3].
The split Hopkinson bar (SHB) systems have been widely used in investigating the behavior of materials under high strain-rate loadings [4]. In SHB systems, elastic waves captured by strain gauges attached to the incident and transmitter bars are used is determining the strains generated in the test specimens during dynamic impact loading. A homogenous deformation is assumed in the computation of dynamic stress and strain values for the SHB test specimens [4,5]. However, these homogenous stress states are difficult to obtain at high strain rates [6]. For cylindrical specimens, experiments have shown that at an axial strain of up to 30%, the specimen remains cylindrical in shape, but at larger strains, buckling occurs and the transverse cross section will often assume an elliptical shape, which indicates inhomogeneous stress distribution in the specimen [7]. Strain measurement using strain gauges requires mechanical attachment to the tested material and hence a fairly large volume of specimen is needed [8]. In high strain test using SHB, the strain gauge is not attached directly to the specimen and may not fully capture the evolution of strain occurring during high strain-rate testing. Non-contact measuring technique in which strain is measured directly on the test specimens can provide a more accurate strain measurement during dynamic impact loading. Non-contact measurement techniques do not only provide a global strain response, but also a point-by-point full field strain measurement of the tested specimen.
Non-contact testing techniques have been used in the measurement of strain and 3D displacement of an object in stress and static analysis [9]. One of such technique is the optical measurement system that includes holography, speckle interferometry, speckle photography, white light speckle, and digital image correlation (DIC). Optical techniques for measuring parameters such as strain and displacement in experimental mechanics have evolved over the years and have gained recognition as reliable for tools strain measurement. This recent breakthrough in measuring macroscopic parameters can be attributed majorly to development of ultra-high speed imaging systems. In this study, DIC system is used. The digital image correlation photogrammetry system is a 3-dimensional noncontact technique that applies the principle of pattern matching between a reference image and a deformed image of a specimen in the measurement of strain. The advantages of this technique include: 1) non-altering of the behavior of the specimen during testing [10]; 2) no recourse to an analytical model; 3) measurement of strain at local region of interest and measurement of large strain by correlation of series of images recorded during mechanical testing; 4) good strain accuracy [11].
In the current study, the deformation that occurs during high strain rate deformation of AA6061-T6 aluminum alloy both in compression and in torsion is measured using the DIC and the elastic wave techniques. Split Hopkinson Pressure Bar and Torsion Split Hopkinson (Kolsky) were used generate the high strain-rate loading. Dynamic stress-strain results obtained via 3D technique are compared with those obtained from the elastic waves in the incident and transmitter bars. A post deformation analysis of the specimen is also performed in order to evaluate the mechanisms of dynamic failure of the AA- 6061-T6 alloy under dynamic shock loading.
2. Material and Experimental Procedure
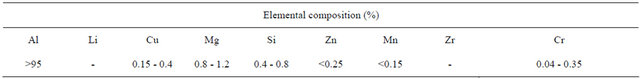
The material investigated in this study is AA6061-T6 aluminum alloy. This alloy is a multipurpose Al-Mg-Si-Cu alloy and is the most widely used in the AA6000 series of aluminum alloys. Due to its medium to high strength, good fracture toughness and excellent corrosion resistance, it finds useful applications in automotive parts such as wheels, and panels [12-16]. The elemental composition of the alloy from ALCOA product data sheet is given in Table 1.
Two tests were carried out in this work: compression tests using Split Hopkinson Pressure Bar and torsion tests using the Torsion split Hopkinson Bar. Cylindrical specimens 5 mm in diameter and 5 mm long (shown in Figure 1) were used for the compression tests.
The compression loading was generated by firing a striker bar using pressurized gas supplied by a nitrogen tank. All impact tests were conducted at room temperature. Tests were performed at striking velocities ranging between 9.5 m/s and 19.69 m/s in order to determine the influence of strain rate on the deformation behaviour of the AA6061-T6 aluminum alloy. A sketch of the Split Hopkinson Pressure Bar used in this test is shown in Figure 2. It consists of incident and transmitter bars made of Ti-6Al-4V alloy, with each measuring 12.7 mm in diameter and 1892 mm long and. Strain gauges were mounted on each of the bars at a distance of about 947 mm from the test specimen in order to prevent wave interference. At both locations, the strain gauge consisted of four 1000 Ω gauges connected in a full Wheatstone bridge circuit configured to measure axial load. The excitation voltage during the compression test was fixed at 15 V.
The surface of the compression bars and specimen were cleaned with acetone and M-prep neutralizers to reduce the influence of impurities on the deformation of the samples. After the surface preparation, the surfaces between the bars and the specimens were lubricated with molybdenum disulphide in order to reduce the effect of friction during test and also to prevent any shear traction on the end surfaces of the specimen during deformation [7]. In order to eliminate splashing of the lubricant on
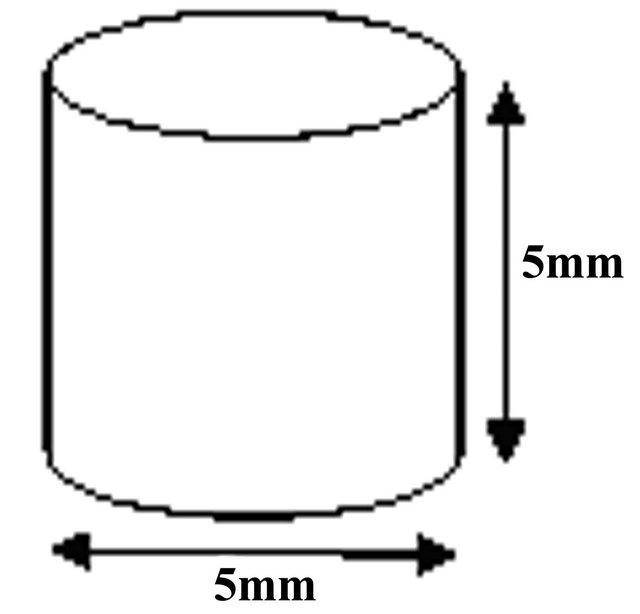
Figure 1. Cylindrical specimen for compression test.
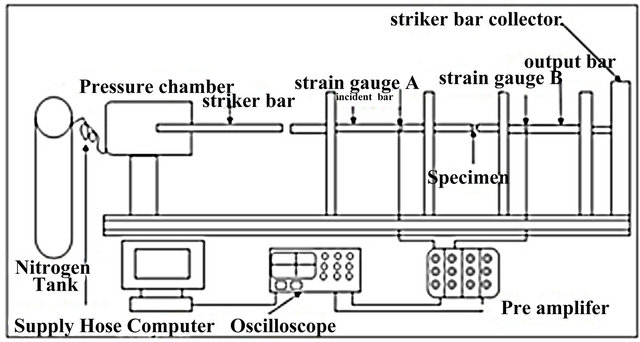
Figure 2. Sketch of the split Hopkinson pressure bar system.
Table 1. Elemental composition of the investigated AA6061-T6 alloy.
the surface of the test specimens which can block camera’s view during impact, care was taken to only use enough lubricant to make a small film on the diametrical surfaces of the specimens. When the striker bar strikes the incident bar, elastic wave is generated which travels through the incident bar to the specimen. The incident wave is captured by the gauges on the incident bar. Once the incident wave reaches the bar-specimen interface, some of it is reflected back to the incident bar and captured by the gauges on the incident bar as reflected wave and the remainder travels through the transmitter bar and are captured by the strain gauges attached to the transmitter bar. The strain signals are conditioned, amplified, and captured by the data acquisition system connected to the bars. The data acquisition system consists of 2 preamplifiers and a 4-channel digital oscilloscope with 350 MHz bandwidth and a sampling rate of up to 5 Gs/s. The captured elastic wave data in volt was converted to load value using a conversion factor obtained from the initial calibration of the equipment. Typical voltage-time graph generated in the impact test is shown in Figure 3. The force with its associated stress as well as the strain rate and strain in the tested specimen were determined from the elastic waves obtained from the incident and transmitter bars. The equations for calculating the stress, strain, and strain rates from the incidence, reflected and transmitted waves are described in detail elsewhere [4].
3D digital image correlation (DIC) technique was simultaneously used for data acquisition during the high strain-rate tests. Large strain measurement range and a good precision for the displacement measurement make the DIC technique a preferred measurement technique. It
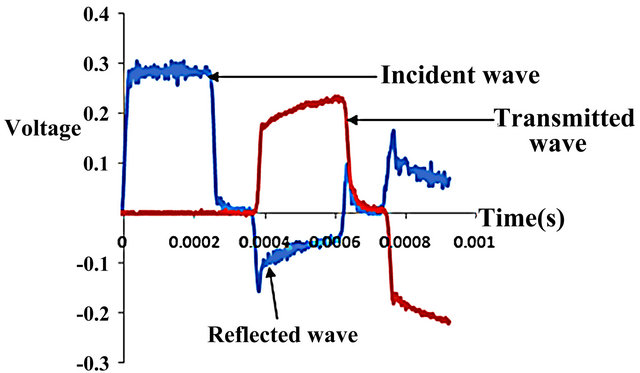
Figure 3. Typical voltage-time graph during compression test.
also has the advantage of a fast data acquisition procedure, and it measures full scale evolution of strain in the test specimens. The 3D DIC technique uses two high resolution photon cameras that provide synchronized images of the deformation process in time steps. The high resolution cameras are capable of capturing 1 million frames per second (FPS). However, a compromise was reached between resolution and number of frame rates in order to ensure high image quality. An array of 192 × 216 and 124,000 FPS was used for the compression test. The DIC technique utilized in this test uses a random dot pattern applied to the surface of the AA 6061-T6 specimen (see Figure 4) with black and white spray paints to provide a grayscale distribution. This ensures sufficient contrast between the un-deformed and the deformed images. The specimens were lit using two standard 150 watt illuminators, commonly used for microscopes, together with flexible 1/4" diameter light guides on Magic Arm positioners. The “Magic Arm” positioners were found to be appropriate for precisely aiming the light guides and holding them close to the specimen, just outside where they will not block the cameras field of view. Figure 5 shows the lightning system and the digital camera utilized in the research work.
To use the high speed cameras for the compression tests, after loading the pressure vessel to the desired pressure level which corresponds to a specific impact velocity, the cameras are set on endless record allowing them
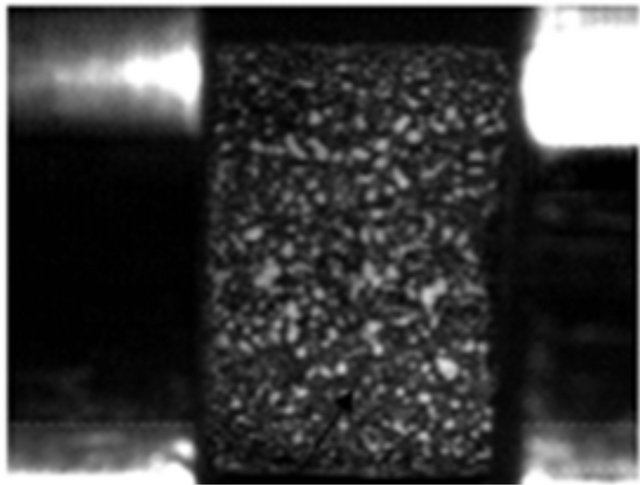
Figure 4. Random dot pattern paint.
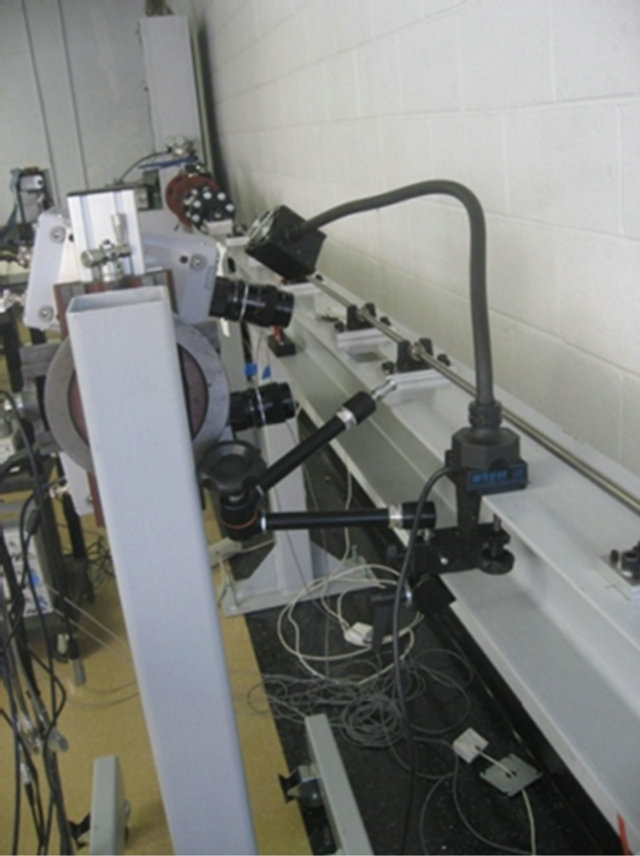
Figure 5. Digital image correlation set-up and lightning.
to constantly record images at the desired frame rate and fill up a circular memory buffer. While the camera images are being recorded onto the laptop, the wave signals obtained using the strain gauges on the bars are recorded by the 4 channel digital oscilloscope as discussed earlier. Once the test was over, captured images were saved in tiff format and are uploaded into a DIC software package (ARAMIS) for post processing to obtain full field strain versus time data. 3 × 3 minimum facet point was used in the calculation of strain. The correlation technique used keeps track of the movement of the grayscale random pattern distribution within each facet relative to its centre point from image to image in order to obtain a displacement from which the strain is obtained. The mathematical principle for the correlation method for the DIC technique used in this test is well reported in literature [17].
For the torsion test, the torsion split Hopkinson bar shown in Figure 6 was used. The equipment consists of two collinear bars; incident and transmitter bars. Proper alignment and free rotation are ensured along these bars by the use of bearings along the length. Each of the incident and transmitter bars has a diameter of 22.22 mm and is made from 7075-T6 aluminum. Elastic wave data are measured at two locations on the incident bar (denoted gauges A and B) and at one location on the transmitter bar (gauge C) shown in Figure 6. At each location, four 1000 Ω strain gauges are configured in Wheatstone bridge circuit for torque measurement. The excitation voltage during the torsion test was fixed at 20 V. The torsion split Hopkinson bar equipment used in this test has the advantage that radial inertial effect such as necking and barreling in specimen do not affect experimental data. The torsion split Hopkinson bar equipment is also designed such that shear waves are not susceptible to dispersion.
The dimensions of the thin-walled hollow torsion specimen (Figure 7) were designed based on impedance equality of the bar and the specimen.
The impedance of material is given by:
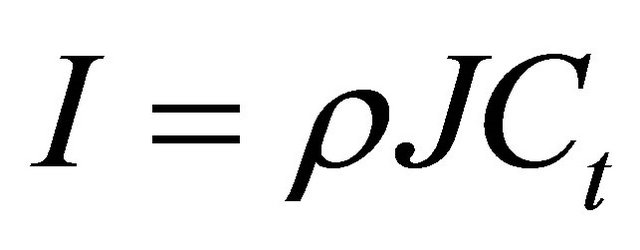 (1)
(1)
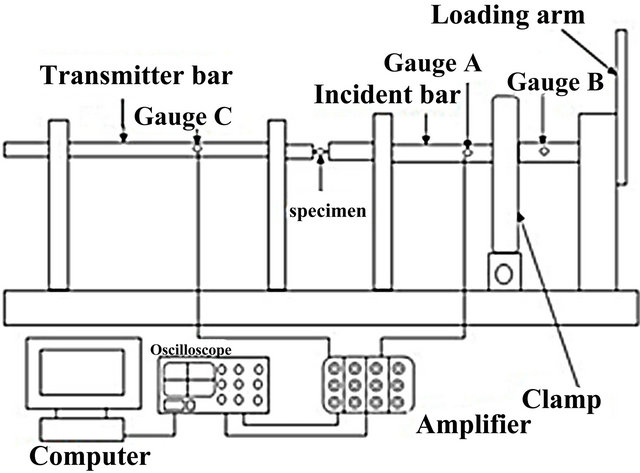
Figure 6. Schematic of torsion split Hopkinson pressure bar.
where ρ is the density of the material (for the titanium bar, the density is 2823.35 kg/m3) and J is the polar moment of inertia (J = 24.1 mm4 for the geometry of the Hopkinson bar used here). Ct is the torsional wave speed given by:
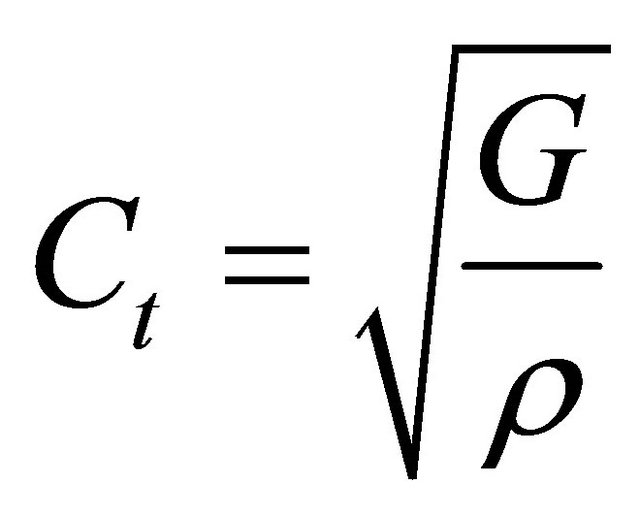 (2)
(2)
where G is the shear modulus (G = 26.89 GPa for the titanium alloy bar). Equation (1) is used to determine the impedances of both the bar and the specimen. The specimen dimensions can be determined using the equality of the impedance of the bar and the specimen. For the aluminum alloy specimen, ρs = 2698.79 kg/m3 and its Ct is determined from Equation (2) using the density and the shear modulus of the specimen (the shear modulus for the tested specimen is 26 GPa).The moment of inertia J of the hollow torsion specimen is given by:
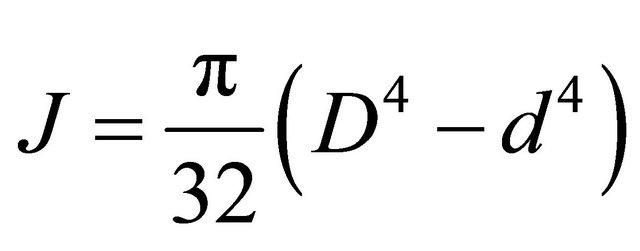 (3)
(3)
where D and d are the outer and inner diameters respectively of the hollow specimen shown in Figure 7. The inner diameter of the torsion specimen is determined by fixing the value of the outer diameter in Equation (3). Based on the equality of impedances of the bar and the specimen, the dimensions of the hollow torsion specimen obtained are shown in Table 2.
In the torsion bar system, the release of the torque stored initially between the loading wheel and the clamp generates torsion loading waves. The clamp (Figure 8) of the torsion bar system has arms that can slide at the bottom and can be tightened by a hydraulic C-clamp.
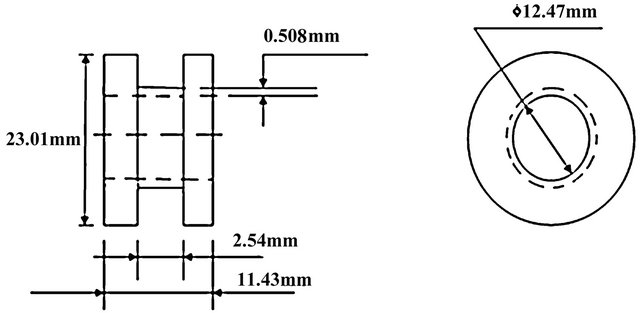
Figure 7. Hollow thin-walled torsion specimen for high strain test.
Table 2. Hollow torsion specimen dimension.

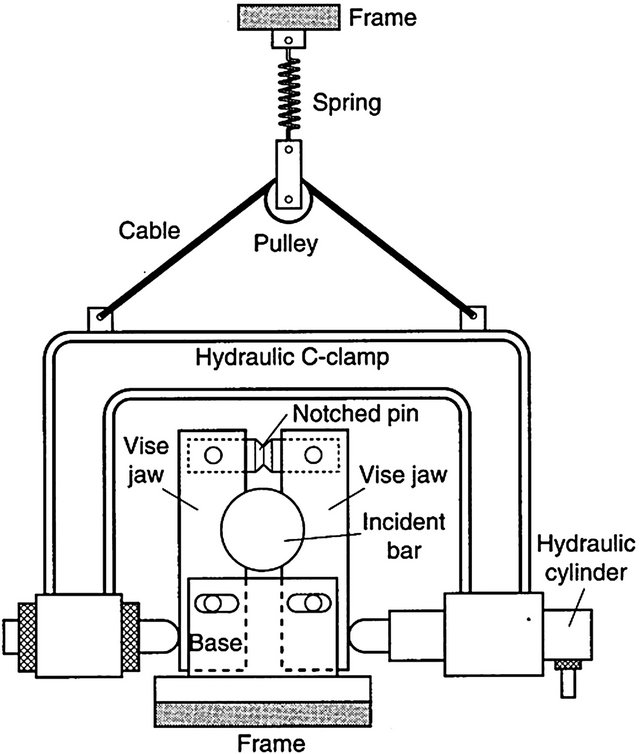
Figure 8. Clamp for torsion bar as designed by Gilat [5].
These arms are designed such that their shape matches the circumference of the loading bar. The hydraulic C-clamp adjusts itself to the location of the bar by means of a pulley, cable and a soft spring. Good grip is ensured during test by cleaning the surface of the bar and the arms with acetone prior to test. Notched pin made of 6061-T6 or 7075-T6 aluminum alloy are used to achieve a specific amount of torque. The amount of torque in turn determines the desired strain rate at which the test occurs. The notched pin material must exhibit sufficiently minimal durability and also must not be too brittle to fracture prior to tightening of the clamp. The desired fracture point and clamping force are achieved by varying the depth of the notch in the pin material. The hydraulic C-clamp ensures that small unloading pulses are not generated due to misalignment prior to test.
Upon applying a torque that will produce the desired strain rate in the specimen, load is applied at the base of clamp using the hydraulic cylinder connected to the clamp until the notched release-pin breaks. The store torque between the clamp and the loading arm then generate elastic torsional waves which travels through the incident bar and rapidly deform the thin walled specimens sandwiched between the incidence and the transmitter bars. The wave propagating through the incident wave is captured by strain gage A. A portion of the wave is reflected back to the incident bar and captured as reflected wave by strain gage B mounted on the incident bar. The remaining portion of the waves pass through the specimens as transmitted waves which is captured by strain gage C mounted on the transmitter bar. The elastic wave pulses are captured in voltage as a function of time by the attached digital oscilloscope. Based on the impedance matching technique utilized in the design of the torsion specimen, the amplitude of the incident wave is ensured to be larger than required torque for the deforming specimen. This results into the end of the incident bar towards the specimen to rotate with an angular velocity greater than that of the other end of specimen closest to the transmitter bar. This difference in angular velocity forms the basis for the deformation of the hollow torsion specimen at high strain rate. A typical voltage vs. time graph obtained from the torsion test is given in Figure 9. DIC system was also used for strain measurement on the surface within the gage length of the thin-walled specimens during the torsion test. Upon hearing the sound of the breaking of the pin, the trigger for the high speed cameras is also activated by the push button and the images recorded on the cameras are downloaded to a laptop for post-processing in a way similar to that discussed for the compression test. The torsion test was performed at 320 × 128 pixels for the cameras to record 140,000 FPS.
3. Results and Discussion
Figure 10 shows results obtained using the 3D DIC system and the elastic waves in the bars for the compression tests on the AA6061-T6 aluminum alloy specimen at an impact velocity of 9.5 m/s. The strain vs. time determined using the elastic waves from the bars and the average of values of these parameters around the middle of the test specimen using the DIC system at impact velocity of 9.5 m/s is shown in Figure 11. It can be seen from Figures 10 and 11 that the stress and strain histories obtained using the two techniques are very close to each other with the strains obtained via the elastic wave method having slightly larger values. Figure 12 show the time history of strain across the length of the tested specimen for impact velocities of 9.5 m/s. As stated earlier, before the impact test, the digital cameras were set to take several frames using the endless mode. The endless mode was stopped just immediately after the test. The time history plot of strain across the length of the
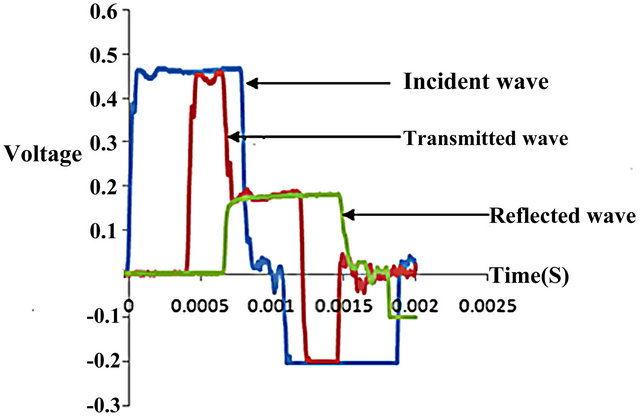
Figure 9. Typical voltage-time graph generated in a torsion test.
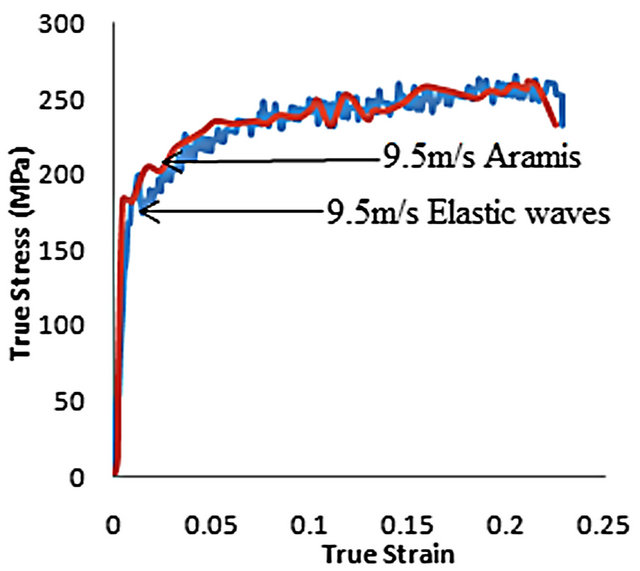
Figure 10. Dynamic stress-strain curves of AA6061-T6 aluminum alloy as a function of the impact velocity.
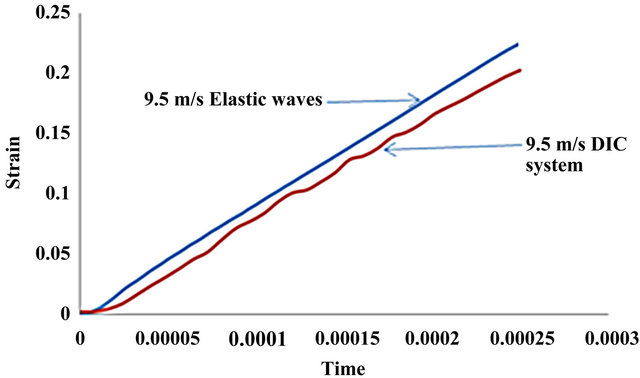
Figure 11. Strain-time history obtained using 3D DIC system and elastic wave as a function of the impact velocity.
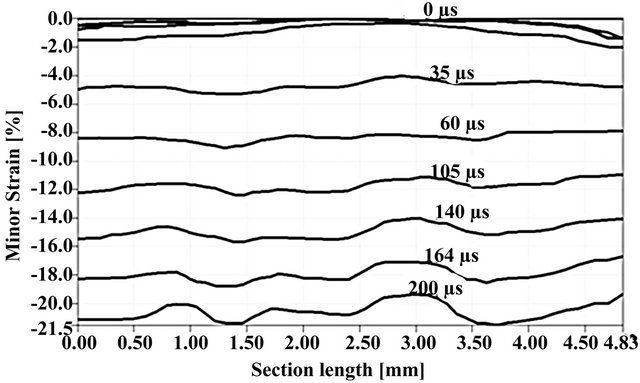
Figure 12. Progression of strain distribution along the specimen in compression test at 9.5 m/s.
specimen when impacted at 19.65 m/s is shown in Figure 13. From Figures 12 and 13, it is observed that the strain was uniformly distributed at the earlier stages of the test while it became non-uniform towards the latter stages. The non-uniformity of strain seemed to be higher towards the end of the test for the higher impact velocity shown in Figure 13 than that experienced in Figure 12 for a lower velocity. One unique feature of the DIC is that the location for the onset of strain localization can be observed from the plot of minor strain against section length. Two possible location of strain localization leading to the occurrence of adiabatic shear bands can be seen on the plots shown in Figures 12 and 13.
In the compression test, peak flow stress and critical strain increased with increasing impact velocity as shown in Figure 14. A peak flow stress of 200 MPa was recorded for the test performed at 9.5 m/s; this increased to about 620 MPa for impact test performed at 19.69 m/s. No drop in the peak flow stress was observed for compression tests performed at velocities in the range 9.5 - 19.69 m/s. During impact, about 90% of the projectile’s kinetic energy is converted into heat which causes thermal softening of the impacted specimen. Thus, both thermal softening and strain hardening occur simultaneously in a specimen as it deforms under the impact load. Eventually, a condition of adiabatic heating occurs and the flow stress collapses as a result of excessive thermal softening in the adiabatically heated region. The stress collapse is an effect of the resulting thermo-mechanical instability inside the shear band.
Table 3 shows the applied stored torque required to generate predetermined strain rates in the torsion specimen. The torque was released suddenly to enable rapid deformation of the thin-walled specimen. As shown in Figure 15, at strain rate of 750/s, peak flow stress value
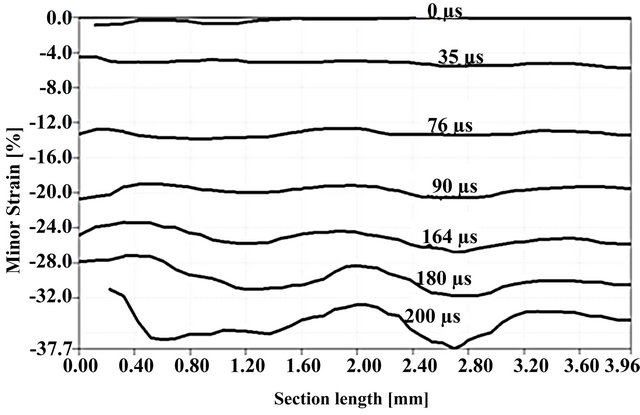
Figure 13. Progression of strain distribution along the specimen in compression test at 19.69 m/s.
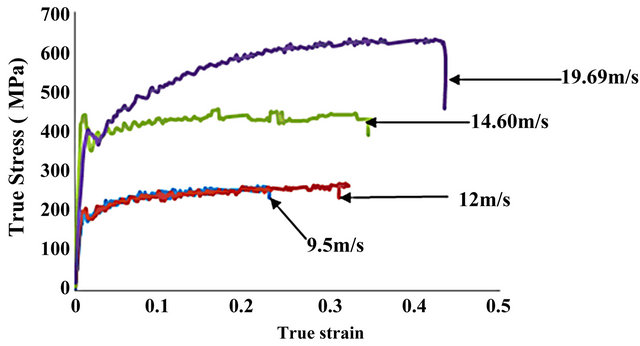
Figure 14. Dynamic stress-strain curves of AA6061-T6 aluminum alloy under compression loads at various velocities obtained via elastic waves.
of 120 MPa was recorded. As impact strain rate increased to 2000/s, peak flow stress also increased to 160 MPa. No drop in peak flow stress was observed with increasing impact strain rate.
Figure 16 shows the comparison of the time history of strain obtained for the torsion tests performed at applied torque of 133.08 N·m and 179.08 N·m and obtained via elastic waves method. From Figure 16, a linear relationship is observed between the time over which plastic deformation process occurs during the torsion loading and the localization of strain. This signifies that the strain in the aluminum material increases linearly with time as the time of deformation increases, reaching a peak at the end
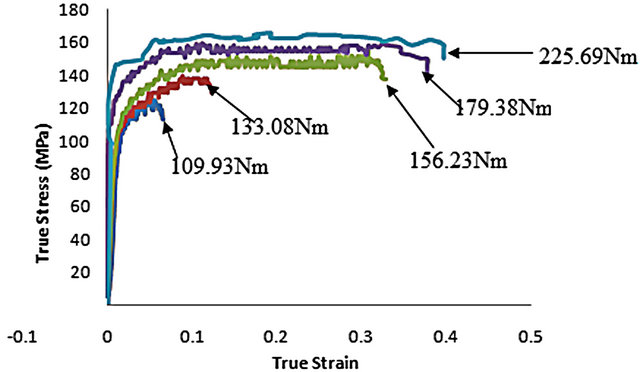
Figure 15. Dynamic stress-strain curves of AA6061-T6 aluminum alloy under applied torque (elastic wave method).
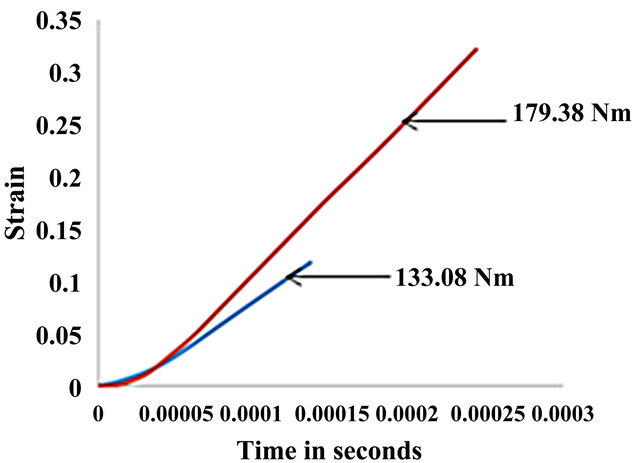
Figure 16. Strain-time history of AA 6061-T6 aluminum alloy as a function of applied torque.
Table 3. Impact strain rate and corresponding torque.

of the deformation process. Figure 16 shows that the rate at which strain localization occurs increases as the applied torque and hence strain rate increases. This is due to the fact that an increase in strain rate results into a higher possibility for occurrence of thermal softening and hence adiabatic heating. Therefore, at higher applied torque, localized strain results from a quicker thermal softening process followed by adiabatic heating.
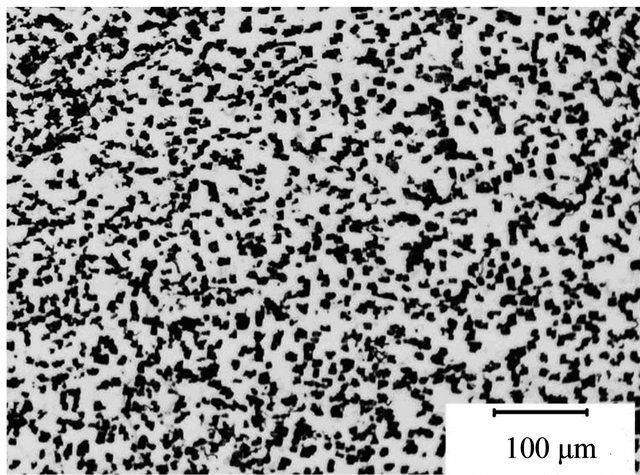
Detailed microscopic examination of the AA6061-T6 aluminum alloy samples before and after impact was carried out. The samples were first mounted in acrylic and cured. After mounting, the samples were ground using 120 grit SiC paper and subsequently polished to a mirror surface finish. The polishing clothes used were 9 micron MD Allegro cloth, 3 micron MD Mol cloth, 1 micron MD Nap cloth and 0.5 micron Ops cloth. Polishing solutions used with the corresponding polishing clothes were 9 micron MD Allegro solution, 3 micron MD Mol solution, 1 micron MD Nap solution and 0.5 micron Ops solution. The obtained mirror surface was etched using a solution containing 25 ml Methanol, 25 ml HNO3, 25 ml HCl and 1drop of HF. The duration of etching for the AA6061 aluminum alloy specimens was 40 seconds. Figure 17 shows typical optical and scanning electron micrographs of the investigated AA 6061-T6 aluminum alloy before impact. Secondary electron imaging and accelerated voltage of 15 or 20 V was used in the scan
 (a)
(a)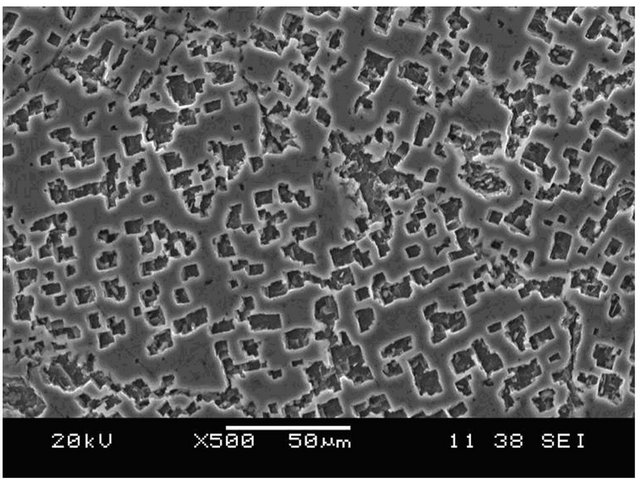 (b)
(b)
Figure 17. Typical (a) Optical and (b) Scanning electron micrographs of the AA6061 alloy before impact.
ning electron microscopic studies. The microstructure of the alloy consists of uniformly distributed second phase particles in a continuous aluminum rich phase. The second phase particles are rectangular in shape and their sizes vary.
Optical micrographs showing the deformed and transformed bands observed in the specimen impacted at 19.69 m/s are presented in Figure 18. The deformed band consists of the second phase particles that are aligned shear flow direction. This indicates viscous flow in the metal along the path of the deformed band. The deformed band in Figure 18(a) is located ahead of the propagation path of the fully transformed band. This confirms the proposition that deformed band form first at high strain rates and change to transformed bands as the magnitude of localized strain increases. A fully developed transformed band is shown in Figure 18(b). The microstructural features of the transformed bands could not be resolved under the optical microscope. The scanning electron microscopic study of the transformed band shows that it consists of very fine equiaxed grains. The average size of these grains is estimated to be 0.6 µm (Figure 19). It is suggested that these fine grains form by dynamic recrystallization. The deformation time is too short to allow diffusion-controlled static recrystallization that involves grain boundary movement. The formation of fine grains inside the transformed bands observed in several different impacted alloys have been attributed to dynamic recrystallization [18]. The dynamic recrystallization has been proposed to occur by grain boundary rotation rather than grain boundary migration. The combined action of increased temperature and severe strain generated inside the transformed bands promoted the dynamic recrystallization of the observed fine grains.
4. Conclusion
The deformation of aluminum AA 6061-T6 alloy under high impact condition was determined by performing full field measurement of strain on the surface of the specimen. The digital image correlation technique which is a non-contact measurement system gives the full field scale distribution of strain throughout specimen under high
 (a) (b)
Figure 18. Optical micrographs showing (a) Deformed and (b) Transformed shear bands in alloy impacted at 19.69 m/s.
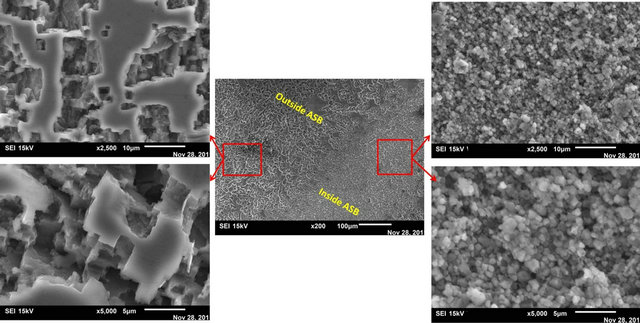
Figure 19. Scanning electron micrograph showing microstructure inside and outside a transformed bands in AA6061-T6 aluminum alloy impacted at 19.69 m/s.
strain rate tests. Results indicate that specimen deformation under compressive loads are usually uniform initially but may become non-uniform as deformation progresses depending on impact velocity. The result obtainned shows that the digital image correlation technique gives a minor strain which agrees with that determined via elastic wave method. A post-deformation analysis of the specimen also shows strain localization along narrow adiabatic shear bands in the AA6061-T6 alloy. During dynamic loading of the AA6061-T6 aluminum in compression and torsion, intense shear localization along narrow adiabatic shear bands initiates failure in the aluminum sample. The type of shear band that initiates in the aluminum sample depends on the impact velocity or strain rate at which the impact is performed.
5. Acknowledgements
The authors are grateful for the support provided by the Department of Defense (DoD) through the research and educational program for HBCU/MSI (contract # W911- NF-12-1-061) monitored by Dr. Larry Russell (Program Manager, ARO).
REFERENCES
- F. Yarzdani, M. N. Bassim and A. G. Odeshi, “The Formation of Adiabatic Shear Bands in Copper during Torsion at High Strain Rates,” Procedia Engineering, Vol. 1, No. 1, 2009, pp. 225-228. doi:10.1016/j.proeng.2009.06.053
- T. Özel and E. Zeren, “Finite Element Analysis of the Influence of Edge Roundness on the Stress and Temperature Fields Induced by High Speed Machining,” International Journal of Advanced Manufacturing Technology, Vol. 35, No. 3-4, 2007, pp. 255-267. doi:10.1007/s00170-006-0720-2
- H. Feng and M. N. Bassim, “Finite Element Modeling of the Formation of Adiabatic Shear Bands in AISI 4340 Steel,” Journal of Materials Science and Engineering: A, Vol. 266, No. 1-2, 1999, pp. 255-260. doi:10.1016/S0921-5093(99)00026-X
- G. T. Gray, “Classic Split Hopkinson Pressure Bar Testing,” ASM Handbook, Vol. 8, 2000, pp. 462-476.
- A. Gilat, “Torsional Kolsky Bar Testing,” ASM Handbook, Vol. 8, 2000, pp. 505-515.
- R. Moulart, F. Pierron, S. Hallet and M. Wisnom, “FullField Strain Measurements at High Strain Rate on Notched Composites Tested with a Tensile Hopkinson Bar,” Annual SEM (Society for Experimental Mechanics) Conference, Albuquerque, 1-4 June 2009, pp. 1-6.
- A. Gilat, T. E. Schmidt and A. L. Walker, “Full Field Strain Measurement in Compression and Tensile Split Hopkinson Bar Experiments,” Experimental Mechanics, Vol. 49, No. 2, 2009, pp. 291-302. doi:10.1007/s11340-008-9157-x
- J. Kajberg, K. G. Sundin, L. G. Melin and P. Stahle, “High Strain-Rate Tensile Testing and Viscoplastic Parameter Identification Using Microscopic High-Speed Photography,” International Journal of Plasticity, Vol. 20, No. 4-5, 2004, pp. 561-575. doi:10.1016/S0749-6419(03)00041-X
- A. S. Kobayash, “SEM Handbook of Experimental Mechanics,” Prentice-Hall, Inc., New Jersey, 1987, pp. 388- 429.
- D. Lecompte, H. Sol, J. Vantomme and A. Habraken, “Analysis of Speckle Patterns for Deformation Measurements by Digital Image Correlation,” SPIE Digital Library, Vol. 6341, 2006, Article ID: 63410E. doi:10.1117/12.695276
- C. Cofaru, W. Phillips and W. Van Paepegem, “Evaluation of Digital Image Correlation Techniques Using Ground Truth Speckle Images,” Journal of Measurements Science and Technology, Vol. 21, No. 5, 2010, Article ID: 055102. doi:10.1088/0957-0233/21/5/055102
- G. B. Burger, A K. Gupta, P. W. Jeffrey and D. J. Lloyd, “Microstructural Control of Aluminum Sheet Used in Automotive Applications,” Materials Characterization, Vol. 35, No. 1, 1995, pp. 23-39. doi:10.1016/1044-5803(95)00065-8
- G. S. Cole and A. S. Sherman, “Lightweight Materials for Automotive Applications,” Materials Characterization, Vol. 35, No. 1, 1995, pp. 3-9. doi:10.1016/1044-5803(95)00063-1
- G. Lucas, “Aluminum Structural Applications,” Advance Materials and Processes, Vol. 149, No. 5, 1996, pp. 29- 30.
- B. Irving, “Interest in Welded Aluminum Automobiles Gathers Momentum Worldwide,” Welding Journal, Vol. 77, No. 6, 1998, pp. 31-35.
- H. Demir and S. Gündüz, “The Effects of Aging on Machinability of 6061 Aluminum Alloy,” Materials and Design, Vol. 30, No. 5, 2009, pp. 1480-1483. doi:10.1016/j.matdes.2008.08.007
- S. M. Touchal, F. Morestin and M. Brunet, “Various Experimental Applications of Digital Image Correlation Method,” CMEM ’97, Rhodes Island, 21-23 May 1997, pp. 45-58.
- Y. Xu and M. A. Meyers, “Nanostructural and Microstructural Aspects of Shear Localization at High Strain Rates,” In: B. Dodd and Y. Bai (Eds.), Adiabtic Shear Localization—Frontiers and Advances, 2nd Edition, Elsevier Insights, Elsevier Publishers, Amsterdam, 2012, pp. 111-164.
NOTES
*Corresponding author.