World Journal of Condensed Matter Physics
Vol.06 No.03(2016), Article ID:69591,34 pages
10.4236/wjcmp.2016.63020
Magnetic Theory and Applications in the Naples Bay (Southern Tyrrhenian Sea, Italy): Magnetic Anomaly Fields and Relationships with Morpho-Structural Lineaments
Gemma Aiello, Ennio Marsella
Istituto per l’Ambiente Marino Costiero, Consiglio Nazionale delle Ricerche, Naples, Italy

Copyright © 2016 by authors and Scientific Research Publishing Inc.
This work is licensed under the Creative Commons Attribution International License (CC BY).
http://creativecommons.org/licenses/by/4.0/


Received 21 January 2016; accepted 6 August 2016; published 9 August 2016
ABSTRACT
Magnetic theory and application to a complex volcanic area located in Southern Italy are here discussed showing the example of the Gulf of Naples, located at Southern Italy Tyrrhenian margin. A magnetic anomaly map of the Gulf of Naples has been constructed aimed at highlighting new knowledge on geophysics and volcanology of this area of the Eastern Tyrrhenian margin, characterized by a complex geophysical setting, strongly depending on sea bottom topography. The theoretical aspects of marine magnetometry and multibeam bathymetry have been discussed. Magnetic data processing included the correction of the data for the diurnal variation, the correction of the data for the offset and the leveling of the data as a function of the correction at the cross-points of the navigation lines. Multibeam and single-beam bathymetric data processing has been considered. Magnetic anomaly fields in the Naples Bay have been discussed through a detailed geological interpretation and correlated with main morpho-structural features recognized through morpho- bathymetric interpretation. Details of magnetic anomalies have been selected, represented and correlated with significant seismic profiles, recorded on the same navigation lines of magnetometry. They include the continental shelf offshore the Somma-Vesuvius volcanic complex, the outer shelf of the Gulf of Pozzuoli offshore the Phlegrean Fields volcanic complex, the relict volcanic banks of Pentapalummo, Nisida and Miseno, the Gaia volcanic bank on the Naples slope, the western slope of the Dohrn canyon, the Magnaghi canyon’s head and the magnetic anomalies among the Ischia and Procida islands.
Keywords:
Magnetic Anomaly, Naples Bay, Southern Tyrrhenian Sea

1. Introduction
1.1. Generality
One aim of the present paper is to show the magnetic anomaly map of the Naples Bay [1] , which has furnished a new contribution to the knowledge of the geophysics and the volcanology of this active volcanic area, located at the Eastern Tyrrhenian margin, characterized by a complex geological setting, depending on the interference between volcanic and sedimentary processes during the Late Quaternary [2] - [6] .
The magnetic survey of the Naples Bay acquired by the Institute of Marine and Coastal Environment of the National Research Council of Naples (Italy) onboard of the R/V Urania (CNR) during the oceanographic cruise GMS98-01 (May-June 1998) and GMS00-05 (October-November 2000) shows a densely spaced coverage, distinguishing from the aeromagnetic surveys, previously recorded in the area and characterized by a large coverage [7] . This has allowed for the construction of a high resolution magnetic anomaly map of the Naples Bay, which has evidenced the occurrence of complex magnetic anomaly fields, previously unknown, related to geological structures having a volcanic nature and/or to volcanic morpho-structural highs, evident from the Multibeam bathymetry of the Gulf of Naples [8] [9] .
It is worth mentioning the previous lack of magnetic data in the marine sector of the Gulf of Naples, both on the aeromagnetic survey [7] and the magnetic anomaly map of Italy constructed by the National Institute of Geophysics and Volcanology (INGV, Rome, Italy) [10] . The Italian magnetic anomaly map is based on magnetic measurements collected onshore in the frame of the Project Finalized Geodynamics (National Research Council of Italy) from the 1977 to the 1981, while the marine magnetic data have been recorded by the Experimental Geophysical Observatory (OGS, Trieste, Italy) from the 1965 to the 1972.
The most important result shown by the Italian magnetic anomaly map [10] with respect to the aeromagnetic map of Italy [7] consists of a new view of the magnetic signature related to main regional tectonic structures in the frame of their geological setting. Moreover, the magnetic anomaly map of Italy has evidenced a good correlation among the structural geology (onshore) and the magnetic anomalies, allowing for a detailed interpretation of deep geological structures. The magnetic anomaly map of the Gulf of Naples, herein presented, integrates these elaborations, considering that the magnetic grid is densely spaced and that an accurate pre-processing and post-processing of the magnetic data have been performed [3] .
Advanced magnetic data processing has been applied through geophysical inversion of magnetic data, allowing the reconstruction of the shape of the magnetic anomalies [4] and their consequent geologic interpretation through an integrated analysis of magnetic, seismic and bathymetric data [5] [11] . This interpretation allows to bind the shape of the magnetic anomaly fields shown by the Naples magnetic anomaly map and to put them in relationship with the volcanic bodies occurring in the subsurface of the Gulf of Naples, identified through the analysis of multichannel seismic reflection profiles recorded on the same navigation lines of magnetic data [2] [12] . At the same time, the magnetic anomalies individuated in different magnetic fields will be correlated with the bathymetry of the Naples Bay, reconstructed through the analysis of single-beam bathymetric profiles, recorded on the same navigation lines of magnetometric and seismic data. A first example of this integrated analysis of magnetic, seismic and bathymetric data, applied to a wide dipolar anomaly, located in the offshore of the Somma-Vesuvius volcanic complex and probably correlated with a lateral vent of the volcano developed on the continental shelf surrounding the Torre del Greco town has been reported by [12] .
The boundary analysis is a numerical methodology allowing for the localization of the lateral margins bounding the body which is the source of the anomaly. The applied techniques are based on the signal enhancement. The most used methods are represented by the analytic signal and the horizontal derivative of the magnetic field. Both the methods are based on the assumption that the contrasts between the source body and the enclosing rocks are abrupt and almost vertical. The analytic signal is a complex function composed of the horizontal and vertical components of the potential field. The width of the analytic signal is a bell-shaped function localized over the margin of the structure. A margin of the source body generally corresponds to a maximum of amplitude of the signal. This technique is not depending on the direction of the vector of magnetization and of the vector of the earth’s magnetic field, more than on the variation in shape of the anomaly with the latitude [13] .
In order to solve the reverse problem of the interpretation of the fields of potential, which does not allow the determination of the distribution of the sources which have produced the field, a new methodology called the wavelet analysis has been introduced [14] . This technique may be used for the separation of the regional field from the residual one, in order to discriminate the effects of different sources which are superimposed in one single anomaly, but also to eliminate the effects of the noise remaining after the magnetic data leveling.
The Continuous Wavelet Transform (CWT) [14] [15] allows for the fractionation of the signal in a space- scale domain and is particularly indicated in order to visualize the singularity of the signal. The graph furnishes a representation of the characteristics of the field derivatives, which are prolonged at different heights. In particular, the lines of the Wavelet coefficient of a maximum amplitude, in the case of isolated sources, are straight lines joining up the source depth. In the case of wide sources represented by homogeneous bodies having a regular vertical section the field potential depends on the coordinates of the source vertexes. Correct information may be obtained through a proper selection of the scale range, whose vertexes act as isolated singularities. The Wavelet transform is then a feasible technique to study not stationary signals, in which there is the superimposition of high and low frequency signals [14] [15] .
1.2. Survey Area
The area involved by the present study includes the Gulf of Naples, a sedimentary basin located on the Eastern Tyrrhenian margin and characterized by high rates of subsidence during the Late Quaternary, as a result of volcano-tectonic downthrowing of the area. Main volcanic events have involved this area during this time interval, controlling the emplacement of volcanic bodies widespread in the subsurface of the gulf (see for instance the seismic unit related with the pyroclastic flux deposits of the Campanian Ignimbrite, erupted by the Phlegrean volcanic complex at 37 ky B.P. [16] ).
The basin fill of the Gulf of Naples has recorded the interactions between tectonic, volcanic and depositional/erosional processes, together with the tectonic uplift and the deformation of the surrounding emerged areas during the Pleistocene. Particular aspects of the Gulf of Naples with respect to adjacent peri-tyrrhenian basins (i.e. the Terracina and Gaeta basins to the north and the Policastro basin to the south) is due both to the occurrence of a structural high of the Mesozoic carbonate basement (Sorrento Peninsula-Capri island structural high), playing a fundamental role in the individuation and recent tectonic evolution of the basin itself, and on the strong volcanic activity during the Late Pleistocene (volcanic complexes of Phlegrean Fields, Somma-Vesuvius and Ischia and Procida islands), controlling a notable complexity in the distribution of the sedimentary and volcanic seismic units. The western sector of the Naples Bay is characterized by the occurrence of volcanic seismic units, often associated with positive magnetic anomalies, while the eastern one is characterized by the occurrence of sedimentary units [17] .
The survey area, in which the coverage of magnetic data used to construct the magnetic map is located, is bounded towards the Vesuvian coast by the 50 m isobaths; towards the Sorrento Peninsula-Capri island prolongation the lower bathymetric boundary ranges between the 100 m isobaths (towards Capri-Punta Campanella) and the 70 m isobaths (towards the inner sector of the Sorrento Peninsula). Towards the shoreline of the Naples town, where the continental shelf strongly widens, the bathymetric boundary coincides with the 30 m isobath; towards the Gulf of Pozzuoli it coincides with the 70 m isobath. Offshore the Ischia and Procida islands the boundary of the survey area coincides with the 100 m isobaths. Proceeding towards the centre of the gulf, in correspondence with the continental slope of the Naples Gulf, the magnetic data have been recorded with a dense line spacing of 250 m since the 300 m isobaths, in correspondence to the Dohrn canyon’s head. The remaining part of the continental slope of the gulf has been covered by a larger grid (line spacing of 2.5 km). At the same time, the area surrounding the Ischia and Procida islands is covered by a densely spaced grid among the 100 and 400 m isobaths.
1.3. Work Activities
The survey operations at sea have been carried out during two oceanographic cruises, both developed onboard of the R/V Urania of the National Research Council.
During the first cruise (GMS98-01; May-June 1998) the magnetic surveys have been performed during the night contemporaneously with the recording of single-channel seismic profiles (Sparker 1 kJ and 4 kJ). The oceanographic cruise, performed in the frame of the CARG research project of realization and informatization of thematic geologic maps at the 1:50.000 scale of Naples and Salerno Gulfs, had as a main scientific objective the realization of sea bottom sampling and of geophysical prospecting in the Naples and Salerno Gulfs [18] . The line spacing of the magnetic grid recorded during the GMS98-01 cruise corresponds to 2.5 kilometers (Figure 1).

Figure 1. Magnetic grids recorded during the cruise GMS98-01 in the Gulf of Naples.
During the second oceanographic cruise (GMS00-05; October-November 2000) 950 kilometers of magnetic profiles have been recorded, coupled with a grid of seismoacoustic profiles (Figure 2).
Single-beam bathymetric profiles have also been collected along the same navigation lines of seismic profiles. This grid has allowed for the construction of the magnetic anomaly map of the Naples Bay, due to the fact that it is densely spaced and to the accuracy of the used positioning (GPS differential positioning in dotation to the R/V Urania).
The calendar of the work activities carried out during the second cruise is reported in Table 1. The coordinates of the seismic and magnetic lines recorded in the cruise GMS00-05 (see Figure 2 for location) are shown in Table 2.
2. Acquisition and Processing of Magnetic Data
2.1. Acquisition of Magnetic Data
2.1.1. Generality
The acquisition of magnetic data has been performed using the proton magnetometer G-811 in dotation to the R/V Urania, which produces magnetic data having a high accuracy. The positioning of the magnetic data was extremely accurate and has been realized using both the navigation system Navigation Professional, in dotation to the R/V Urania and the navigation system Hydro in dotation to the National Research Council. The system of navigation Hydro has allowed to manage also the acquisition of multichannel seismic profiles through a Watergun seismic source contemporaneous with the magnetometry, using the multichannel acquisition system Stratavisor (Geometrics Inc.) in dotation to the National Research Council of Italy.
During the acquisition of the magnetometry the sensor was placed in a towed fish, generally located at a distance of 200 m from the ship and 15 m below the sea level. The depth of the magnetometer has been regularly controlled and recorded during the acquisition. The magnetic measurements next to the coast have been carried

Figure 2. Magnetic grid recorded during the cruise GMS00-05 in the Gulf of Naples.

Table 1. Calendar of the work activities during the cruise GMS00-05.
out using a short cable. The cruise velocities do not exceed 6 knots during the acquisition. The data have been recorded at 3 seconds, corresponding to an average space interval of 6.25 meters.
In the case of marine surveys as those carried out during the cruise GMS00-05 the magnetic data acquisition is frequently realized contemporaneously with the acquisition of other types of geophysical data, although the used instruments are compatible. In fact, the marine magnetometry is compatible with the acquisition of seismic reflection profiles, both single-channel and multichannel. In fact, the grid of magnetic profiles recorded during the cruise GMS98-01 corresponds to a seismic grid of analogic data (Sparker 1 kJ and 4 kJ). At the same time, the grid of magnetic profiles recorded during the cruise GMS00-05 corresponds to a grid of multichannel seismic profiles (Watergun) and Subbottom Chirp (Figure 2), finalized at reconstructing the seismic stratigraphy and the lithological nature of the subsurface below the sea bottom at a very high resolution (Subbottom Chirp), at a high resolution (Watergun) and at an intermediate resolution (Sparker 1 kJ and 4 kJ). The geometric configuration for the multichannel seismic acquisition used in the cruise GMS00-05 has been realized in such a way that the seismic cable and the gun did not disturb the magnetometer. The measured magnetic data have been recorded with respect to the GPS navigation system located onboard. The magnetic data have been pre-pro- cessed in order to eliminate the GPS jumps caused by the navigation system. Technical details of the magnetic acquisition include the interval of measurement (6.25 m), the sensitivity of the magnetometer (0.5 γ) and the distance between the ship and the magnetometer (200 m).
2.1.2. Interaction between the Navigation Systems and the Data Acquisition
The two softwares used in the navigation during the cruise GMS00-05 have been the Navpro v. 5 in dotation to the R/V Urania and the Hydronav v. 6, property of the Institute of Marine and Coastal Environment of the National Research Council of Italy. The two systems allow to perform the same operations; therefore, both the systems have stored the data coming from the linked instruments; a GPS positioning system, a gyrocompass for the
Table 2. Coordinates of seismic and magnetic lines.
reading of the ship tracks to be followed, an echosounder for the depth measurement and the magnetometer.
The choice to use the Hydronav has been controlled by the need to evaluate not only the magnetometric survey, but also the seismic one; in fact, this system allows to manage the recording (sampling) of the seismic signal with space intervals rather than time ones to follow the spacing among the hydrophones of the seismic cable.
The output files of the navigation system have been organized in such a way to furnish the synchronized data, recorded by several instruments and sensors. In this way, it is possible, having time and space references, to compare the magnetic traces with the seismic ones.
2.1.3. Technical Characteristics of the Magnetometer
The geomagnetic survey has been carried out using the magnetometer model G821 (EG&G Geometrics): It is a proton magnetometer composed of the sensor, transported by the ship and by the recorder located onboard.
The sensor consists of a box which is filled by a liquid rich in protons, such as for instance the kerosene. It is wrapped by a coil of iron and is transported back to the ship from an armed coaxial cable.
An electrical current passes through the conductive cable, generating an axial magnetic field of almost two orders larger with respect to the Earth’s magnetic field; in such a way, one proton on 10 millions of protons will align in the direction of the winding.
After being passed for some seconds, in order to allow the reaching of the thermal equilibrium, the electrical current is removed, leaving that the protons are reported in the direction of the earth’s field through a precessional movement. The rotating protons generate a decaying sinusoidal current, initially of a few microamperes, whose tension is proportional to the intensity of the field F. The current is pre-amplified before crossing the coaxial cable, with the aim to eliminate the low frequency noise occurring onboard.
The frequency of the signal is then measured during their first 0.5 seconds, when the signal-noise ratio is high in order to avoid falls of tension due to the loss of precessional coherence consequent to the thermal agitation. The fast fall of tension happens in presence of wide gradients of the field, when the precession contribution varies in the fluid. The initial tension, derived from the precession, has a maximum amplitude when the angle between the axis of the coil and the direction of the Earth’s magnetic field is 90˚. The total field is calculated from the following equation:
 (1)
(1)
when γp is the gyromagnetic ratio of the proton, not corrected for the diamagnetic effect.
From laboratory measurements it derives that:
 . (2)
. (2)
It can be suggested that the sensor is towed at a ship’s distance of more than two times the ship’s length at a water depth of 5 - 10 meters. During the cruise GMS00-05 the sensor was taken at water depths of 17 - 18 meters usually with 200 meters of cable. In the case of the passage on zones with deeper sea bottoms, such as for example the volcanic banks of the Naples Bay (Pentapalummo and Nisida banks) the length of the cable is decreased based on the surrounding environment.
Among the technical characteristics of the G821 recorder it is worth mentioning the high sensitivity, mainly due to the positioning of the pre-amplifier. The last one is put next to the sensor, isolating the noise signals occurring onboard. The high sensitivity allows to identify less extended bodies at high water depths and to avoid the use of particular cables. Instead, the resolution of the instrument is of 0.5 nT, but it seems that the capability to rapidly obtain a high sensitivity should allow to the average values to reach a resolution of 0.2 - 0.25 nT.
The G821-recorder hosts several displays for the control of the data acquisition. The following parameters may be visualized:
1) the temperature, due to a multi-parametric cast;
2) the depth of the sensor, due to a transducer which is sensitive to the pressure;
3) the value of the total field derived from the frequency of precession, already converted in nT;
4) the field’s variation depending on the occurrence of bodies magnetically sensitive occurring in the surroundings.
A multi-functioning alarm hosts if, during the initial set-up of parameters, one of them, such as the amplitude of the signal or the internal tension, exceeds the comprised values. In this case, in one of the displays will appear the codex which shows the mistake to be corrected.
2.2. Processing of the Magnetic Data
2.2.1. Correction of the Magnetic Data for the Diurnal Variation
The variations having an external origin may be distinguished based on the period of the phenomenon:
- variations with periods in the order of seconds (pulsations);
- variations in the order of hours;
- semi-diurnal variations;
- diurnal (or solar) variations, which are due to electric currents flowing in the low ionosphere;
- variations controlled from the moon’s cycles, having a period of 27 days;
- variations having a duration similar to the sunspots’ cycle, which is of about 11 years.
The quiet days are those ones in which the only variations are the diurnal ones, while the others are quite irregular but, if they have a strong intensity, they may deform the most regular ones.
Therefore, the diurnal variation is due to electric charges circulating in the low ionosphere and, more precisely, to the occurrence of two vortexes of electric current in the hemisphere lighted by the sun, one for each hemisphere having opposed versus (counterclockwise for the northern hemisphere, clockwise for the southern hemisphere).
The centers of these vortexes occur at the latitudes of 40˚ and are not the only ones, since in the night hemisphere two vortexes occur, with an opposed rotation with respect to the previously mentioned ones, having a lower intensity. The value of the diurnal variation may reach 200 nT at the height of the equator.
In order to obtain a magnetic map having detailed values of the earth’s magnetic field, it is necessary to correct the magnetic data and refer them to the same time and to the same height. For the first correction, the following equation must be considered to reduce the elements at our disposal to the year 2000:
 . (3)
. (3)
Es00 = values of the earth’s magnetic field at the station s reported to the year 2000,
Eos00 = values of the earth’s magnetic field at the Observatory reported to the year 2000,
Est = values of the earth’s magnetic field at the station s in the time t,
Eost = values of the earth’s magnetic field at the Observatory in the time t.
The data here reported have been obtained in the following way:
Eos00 by taking an arithmetic mean of all values of the total magnetic field recorded at the Observatory in the same periods of development of the field, being the magnetic data recorded in the 2000 not available;
Est are the data recorded during the field survey;
Eost by digitizing, at intervals of 10 minutes, the graphs downloaded from the website of the National Institute of Geophysics and Volcanology (http://www.ingv.it).
It is not necessary to apply the variation of height, since the measurements have been all carried out at sea with the magnetometer at a constant water depth of 17 - 18 meters. In order to obtain the magnetic anomaly map and to apply the correction for the secular variation, it is necessary to consider the geomagnetic reference field. A model of reference field, valid for the Italian and Mediterranean zones, which has allowed to perform the magnetic corrections based on the secular variation observed by L’Aquila magnetic observatory has been suggested [19] . This model is called ItGRF (Italian Geomagnetic Reference Field). Its analytic expression is the following equation:
 . (4)
. (4)
The variations of f and λ refer to the central point (42˚N; 12˚E) and are expressed in degrees. The coefficients have been calculated by [19] with the OLS (Ordinary Least Squares) method from the experimental data and are reported in Table 3.
In order to apply the formula of correction to our dataset, the program in language fortran “aquila for” has been used [20] . This program reads the files including the magnetic data recorded on the ship and the digitized data relative to the Geomagnetic Observatory of L’Aquila. As next step the program completes the operation through a constant value (aqm = 46,168.84) calculated from the arithmetical mean of the values of the geomagnetic observatory relative to the study period (27/10-6/11/2000). In the program a section occurs which carries out a transformation of the columns relative to the hour, restituting a column which visualizes the time as a sum of minutes. This operation was given necessary since the data of L’Aquila geomagnetic observatory, relative to the period of the sea survey, were not yet digitally available.
The graph downloaded from the website of the National Institute of Geophysics and Volcanology (http://www.ingv.it) has been used. The data have been visualized through the software Surfer and then sampled at intervals of ten minutes.
An interpreted seismic line showing the stratigraphic architecture of the Gulf of Naples is shown in Figure 3 [8] [9] . Moreover, a geomorphological map of the Naples canyons is also reported (Figure 4).
2.2.2. Correction of the Magnetic Data for the Offset
After the correction of the magnetic data, it is necessary to correct the data relative to the position of the magnetometer. The positioning data, recorded by the programs Hydronav and Navpro refer to the point in which the antenna for the location of the GPS signal is located; from the metric coordinates to our disposal it is necessary to subtract the meters of cable more than the meters which divide the winch from the GPS antenna. The distance which separates the antenna from the winch is constant and corresponding to 30 meters. To this distance it must be added the superficial distance, very similar to the cable length. In fact, the depth of the magnetometer is of about 17 - 18 meters; as a consequence, since the most lines have been recorded with 200 m of cable, the difference between the superficial distance and the length of the cable is very short (about 1 meter). Carrying out this operation the magnetic datum is reported in correspondence to the precise point in which it has been recorded.
Table 3. Table of the coefficients used to calculate the ItGRF field [19] .

Figure 3. Interpreted seismic line in the Gulf of Naples [8] [9] .

Figure 4. Geomorphologic map of the Naples canyons [21] .
The program, in language Fortran, has been used to correct the mistakes due to the cable offset with which the sensor is connected.
Being assigned the number of lines occurring in the file and the numbers of meters to be subtracted, the program takes in consideration the points at couples (first and second, second and third, etc.) and shifts the point back to the straight line joining the aforementioned points. It is worth operating in such a way, since the ship does not follow a straight navigation track, but its trending is corrected to follow the right navigation track. To this aim the correction is carried out within some boundaries of mistake in such a way that the new trajectory is coherent with the recorded one.
The mistake has been calculated on the angular coefficients of the straight lines. According to this method, if one of them is greater of 10% with respect to the previous one, the new segment is not taken into consideration and the meters are subtracted from the previous straight line.
It is also worth mentioning the occurrence of a loop to recognize the start of line. The passage from one line to each other is calculated from an “if” structure, calculating the standard deviation among the values of latitude and longitude (metric coordinates) of two successive points. If the standard deviation is higher than 100 meters, then the change of profile is considered.
2.2.3. Leveling of the Data as a Function of the Corrections at the Cross-Points
The days to which the measurements are referred are called quiet and are those ones in which the only considered variations are the diurnal ones, such as the variations controlled by the ionosphere, in absence of other variations, more irregular, as those induced from the magnetic storms, deforming more regular signals.
The operator must remove the diurnal variation by subtracting from the data the curve of the diurnal component. Nonetheless this, it is not enough to protect us from these temporal noises, in particular way if the base station, from which the data are desumed is far from the place of measurement, if the latter one is particularly wide.
To solve this problem the leveling of the magnetic data is carried out, consisting in the removal of the short period magnetic variations from the data [22] . Considering a dataset with orthogonal navigation lines, we choose a direction which we consider as the main one. The lines relative to this track are called the survey lines, while the perpendicular ones are called the tie lines. The values of field measured at the cross points will be different and called “miss-ties”. These differences are linked to the fact that the measurements have been carried out in different days, then they depend on the diurnal variation more than on the leeway of the magnetometer and from the casual noise, for example. First, in order to level the magnetic lines we must shift them upwards and downwards in such a way to minimize the miss-ties. After, several techniques are used, both manual and automatic, in order to find a function approaching in the best way the miss-ties. This function will be subtracted from the values of the tie lines to level the main lines with respect to the corrected orthogonal ones.
A significant improvement in the distribution of the miss-ties has been observed (Figure 5). In particular,

Figure 5. Mis-ties histogram [1] .
their absolute value has been reduced from 19.4 nT to 12.8 nT. Many factors contribute to level the shifting of the magnetic field among adjacent acquisition lines. They include differences of height among the navigation lines or an inadequate removal of the diurnal variation. A zero-order network adjustment has been carried out with the aim to take the lines approximately to the same level. The procedure has further reduced the miss-ties, without shifting the original data and their absolute value has been reduced to 7.2 nT.
3. Geologic Setting of the Naples Bay
3.1. Onshore Sector
The continental shelf between the Gaeta Gulf and the Cilento Promontory represents the seaward extension of the alluvial coastal plains bounding the Tyrrhenian sector of the Apenninic chain, which have individuated after strong rates of tectonic subsidence in a tectonic regime of continental stretching and extension. These alluvial plains (Campania plain, Sarno plain and Sele plain) are bounded towards north-east by the inner reliefs of the Apenninic chain, whose continuity is interrupted by NE-SW trending structural highs and by volcanic complexes (Phlegrean Fields and Somma-Vesuvius). The sedimentary filling consists of marine clastic and continental sediments, alternating, both in the Campania Plain and in the Sarno Plain, with abundant volcanic products. The age of this filling is mainly Pleistocene, although a precise dating of the first sequences overlying the acoustic basement is lacking [23] . The acoustic basement is represented by Meso-Cenozoic carbonates (Campania-Lucania carbonate platform) [24] and by deformed Cenozoic sequences and related flysch deposits (“Cilento Flysch”, “Sicilide Units” and “Liguride Units”) [25] . The southern boundary of the Campania Plain is repre- sented by the volcanic district of the Phlegrean Fields, which has been active during the last 50 ky [26] .
The reliefs bounding the Campania Plain are composed of carbonate rocks (limestones and dolomites ranging in age from the Late Triassic and the Late Cretaceous), organized as tectonic units emplaced during the Late Miocene. Remnants of Miocene siliciclastic units often occur at the top of the upper carbonate units. Under the tectonic depression of the Campania Plain the aforementioned units have been deeply buried under the Quaternary deposits, reaching a maximum depth of 3.5 kilometres. Next to the Volturno river mouth, marine sediments not older than the Emilian (1.45 - 1.15 My) have been drilled up to a depth of 3 kilometers [27] . Based on these data a qualitative estimation of the subsidence rates in the Campania plain during the Quaternary has given average values ranging between 1.2 and 3 m/ky [28] .
During the Late Pliocene-Early Pleistocene important phases of uplift and block-faulting have characterized the carbonate reliefs bounding the Campania plain. After these phases, some sectors have ended their uplift and the bottom valley has been filled by thick alluvial and lacustrine deposits (i.e. Volturno valley and Solofrana valley). Some sectors, instead, continued to uplift, also if with minor rates, during the Middle Pleistocene (Caserta, Nola and Sarno Mounts; Sorrento Peninsula). Starting from the last interglacial, a tectonic stability has characterized the structural highs bounding the Campania Plain. The latter one continued to downthrow, due to the high rates of subsidence, also during the Late Quaternary, such that the whole Campania plain has been flooded by the sea during the late interglacial highstand. In fact, beach deposits, having a Tyrrhenian age, have been drilled also at the base of the mountains bounding the plain towards north-east [28] . The first regressive peak of the last interglacial has produced an advance of the shoreline towards north-east of about 30 kilometers, about in the present-day location of the continental platform margin. The effect of this emersion has been reinforced by the growth of the first volcanic edifices in the Neapolitan area and by the consequent pyroclastic aggradation of the surrounding plain.
3.2. Offshore Sector
The origin of the sedimentary basins and their subsidence along the Campania sector of the Eastern Tyrrhenian margin have been the object of several studies based on geological observation in the field and on seismic and well data in the subsurface, both onshore and offshore [24] [27] [29] - [35] .
Nonetheless this, the relative scarcity of recent seismic data and the lack of lithostratigraphic data of deep wells in the Naples Bay has make difficult the reconstruction of the basin age formation and the calibration, also if qualitative, of the seismic sequences.
The Naples Bay has been surveyed through several surveys of seismic reflection data, mainly single-channel seismic recorded with a Sparker seismic source by the Institute of Oceanology of the Naval University Institute of Naples, Italy [17] [36] - [39] . Seven seismic sedimentary units, ranging in age from the Mesozoic and the Holocene have been recognized [17] . The oldest ones have been identified as Mesozoic carbonates and Miocene flysch, separated from the Plio-Quaternary units by an erosional truncation. Some volcanic units have also been described, aligned along a tectonic lineament having a N10˚ trending, following the Dohrn canyon trend and dividing the Naples Bay in a sedimentary domain to the east and a volcanic domain to the west.
3.3. Geomorphology of the Continental Shelf and Slope of the Naples Bay
The continental shelf of the Naples Bay has a variable width, ranging between 2.5 kilometers (offshore the western sector of the Capri island) and 10 - 15 kilometers (offshore the Sorrento coastline). Such a physiography has been controlled by the interactions among subaerial and submarine volcanism, strongly involving the Gulf of Naples during the Late Pleistocene and the linear erosion controlled by Dohrn and Magnaghi canyons and by their tributary channels. The most part of the continental shelf of the Naples Bay is draped by Holocene sediments relative to the last highstand of the sea level.
The western sector of the Gulf of Naples is characterized by the occurrence of several volcanic banks, related to positive magnetic anomalies [40] [41] . Some of them are located in the continental shelf (Pentapalummo, Nisida and Miseno banks; Carenella bank); other ones are located at the beginning of the slope sector (Gaia bank and three minor banks located westwards of the latter one). Some relicts of submarine volcanic complexes occur among the Ischia and Procida islands (Formiche di Vivara, La Catena and Ischia banks). These banks represent relicts volcanic morphologies. Some of them are almost completely eroded and characterized by the outcropping, at the sea bottom, under a thin drape of Holocene sediments, of polycyclic erosional surfaces eroded in the volcanic deposits (Pentapalummo and Ischia banks) or by a thicker Holocene sedimentation (Nisida and Miseno banks).
At the center of the Gulf of Naples, between the Ischia and Procida islands a structural high having a sedimentary nature occurs, prolonged in a NE-SW direction (Banco di Fuori or Banco di Bocca Grande), not related to significant magnetic anomalies [5] . The Banco di Fuori reaches at its top the minimum depth of 130 m and is covered by more than 100 msec of Holocene sediments. It is represented by an asymmetrical ridge, with the south-eastern flank higher than the north-western one. It is represented by a main morpho-structural high, presumably formed by a tilted block of Mesozoic carbonates, resulting from the uplift and the rotation, at a regional scale, of the carbonate acoustic basement. This is located on the structural prolongation Capri-Sorrento Peninsula and its southern flank seems to be involved by a normal fault having a N10˚ trending [42] .
Among the continental slope and the morpho-structural high of Banco di Fuori a basinal area having a low gradient occurs, at water depths ranging between 300 and 500 meters, constituting a slope basin located at the mouth of the Ammontatura channel.
The erosion and the transport of sediments in the Gulf of Naples have acted along the main axes of the Dohrn and Magnaghi canyons, located on the continental shelf and slope and exposing along their walls some hundred of meters of a prograding wedge of the Middle-Late Pleistocene, formed by clastic and volcaniclastic sediments. The canyon’s width ranges between a few hundred of meters and more than one kilometer. Their depth ranges between 250 meters at the shelf break to 1300 meters joining up the bathyal plain. The gradients of their walls reach more than 35˚ in the steepest sectors.
The Dohrn canyon, draining the whole Gulf of Naples, is characterized by two main branches having a curved planimetry. The northern branch joins up the continental shelf through a wide channel (about 2.5 kilometers) and deep from 20 to 40 meters (Ammontatura channel), characterized by a flat bottom and asymmetrical levees. In its terminal part the Ammontatura channel, distinguished by a curved shape in planimetry, deviates towards NW and sharply ends in correspondence to the Nisida bank. The southern branch, having a E-W trending, is fed by a dense network of tributary channels, ending some kilometers to the west of the shelf break, located at water depths of 135 - 140 meters.
The erosion and the transport of volcaniclastic sediments in the offshore of Ischia and Procida islands have acted along the Magnaghi canyon’s axis, which does not seem linked to an onshore drainage system, old or recent. The Magnaghi canyon’s heads is typically trilobate and is typically imposed on a retreating platform margin, having three tributary channels joining into the basin with a main axis. In the zones surrounding the canyon several areas having submarine instabilities occur, as shown by the occurrence of active erosional phases on the continental slope towards the south-east of the Procida island. The origin of the Magnaghi canyon is presumably linked with the great volcaniclastic supplies during several phases of volcanic activity in the Ischia and Procida islands [43] [44] .
Northwards to the area of the volcanic banks the depression of the Gulf of Pozzuoli occurs [45] , characterized by a coastal platform whose rim, located at water depths of 50 m, passes through a low angle slope to a central basin developed to about 100 meters of water depth and surrounded seawards by the Phlegrean volcanic banks. Several authors are concord to retain that the Gulf of Pozzuoli, characterized by high rates of subsidence during the Holocene and volcano-tectonic uplifts dated back to about 5 - 6 ky B.P. (marine terrace of La Starza) represents a submerged sector of the Phlegrean caldera [38] [46] - [48] , also in the light of studies on bradyseismic movements [49] - [51] .
3.4. Seismic Stratigraphy of Volcanic and Sedimentary Units
Main seismic facies identified in the Naples basin based on the interpretation of seismic profiles and their characteristics are resumed in Table 4. Five main unconformities have been distinguished, separating the seismic units and delineating the tectono-sedimentary evolution of the basin.
The acoustic basement is represented by Meso-Cenozoic platform carbonates (seismic unit 1 in Table 4), widely cropping out in the Sorrento Peninsula and in the Capri island, organized as a monoclinalic structure dipping towards NW. The measured inclination of the seismic reflectors in the carbonate sequence is of about 6˚ - 7˚; these values are similar to those ones shown in outcrop from Mesozoic carbonates of the Sorrento Peninsula [42] [52] [53] .
The Naples basin filling mainly consists of two main sedimentary wedges, each characterized by particular patterns of the reflections and acoustic facies. The dating of the seismic sequences in the Naples basin is tentative, since deep offshore wells have not been drilled. An indirect calibration may be attempted based on the data of the geothermal well “Trecase 1” [54] , only for the Vesuvius offshore.
The geothermal well “Trecase 1” has been drilled between the 1980 and the 1981 at a height of 220 m on the southern slopes of the volcanic vents of Somma-Vesuvius [54] [55] for an overall depth of 2068 meters. The Trecase 1 well has drilled the subaerial lavas and the pyroclastic products having an age younger than 35 ky B.P. at the Somma-Vesuvius (0 - 252 m), overlying alternating pumiceus products, cineritic products, breccias and volcanic sands (252 - 510 m), genetically related with the volcanic activity of the Phlegrean Fields (Campanian Ignimbrite; 37 ky B.P.) [56] . A Pleistocene volcano-sedimentary succession composed of submarine volcanites of the old Somma volcano with marine sediments has been crossed since 1490 meters of depth. The top of the carbonate acoustic basement has been detected at a depth of 1885 m, testifying a strong downthrowing of Mesozoic platform carbonates in the Somma-Vesuvius area. The lithostratigraphic data of the Trecase 1 well fully confirmed the structure of the basement of the Somma-Vesuvius deduced from geophysical surveys [57] , indicating strong rates of subsidence of the Campania plain starting from one million of years ago. The alternance of basic lavas and pyroclastic products in drilled eruptive sequence suggests the occurrence of several eruptive cycles in the Somma-Vesuvius history [58] .
4. The Magnetic Anomaly Map of the Naples Bay: Interpretation and Correlation with Morpho-Structural Lineaments
The map of magnetic anomalies of the Naples Bay has been generated using a grid cell size of 200 m. In particular, it is represented by an image map plotted by using the software Surfer v.7 that is a raster map generated starting from grid files. A colorimetric scale expressed in nT has been reported on the right in the map with the aim to quantify the intensity relative to measured magnetic anomalies (Figure 6) [1] .
Figure 7 shows the main fields of magnetic anomalies recognized in the Gulf of Naples based on the geological interpretation and on the correlation with the main topographic structures recognized in the area from the multibeam bathymetry [3] [8] .
Figure 8 shows the main morpho-structures of the gulf, i.e. the Dohrn and Magnaghi canyons, the morpho- structural high of the Banco di Fuori and the Phlegrean Fields banks.
The main magnetic anomaly fields of the Naples Bay have been distinguished and are herein discussed:
1) Magnetic anomaly field produced by offshore vents genetically related to the Somma-Vesuvius volcanic complex (Figure 9);
2) Magnetic anomaly field related to the Gulf of Pozzuoli outer continental shelf (Figure 10);
Table 4. Seismic units in the Naples Bay.
3) Magnetic anomaly field related to the submarine volcanic banks “Pentapalummo”, “Nisida” and “Miseno” (Figure 11);
4) Magnetic anomaly field related to the Procida island continental shelf (Figure 12);
5) Magnetic anomaly field related to the submarine volcanic bank “Gaia” (Naples continental slope; Figure 13);
6) Magnetic anomaly field related to the Magnaghi canyon’s head (Figure 14);
7) Magnetic anomaly field related to a previously unknown volcanic edifice located on the continental slope between the Dohrn and Magnaghi canyons (Figure 15);
8) Magnetic anomaly field related to three previously unknown small volcanic banks located near the shelf break of the Phlegrean Fields (Figure 16);

Figure 6. Total magnetic anomaly field map of the Naples Bay [1] .
9: Magnetic anomaly field related to the Ischia submarine volcanic bank (offshore the Ischia island; Figure 17);
10) Magnetic anomaly field related to the Magnaghi canyon’s axis (Figure 18).
The geologic interpretation of the magnetic anomaly map of the Gulf of Naples shows two main belts characterized by significant magnetic anomalies, the first one located offshore the Somma-Vesuvius volcanic complex and the second one located offshore the Phlegrean Fields volcanic complex, in correspondence with the submarine volcanic banks of Pentapalummo, Nisida and Miseno [2] [3] [12] .
Strong magnetic anomalies, well delineated, have been recognized in the eastern sector of the Naples Bay, offshore the Somma-Vesuvius volcanic complex, where a wide continental shelf, having a low gradient, occurs. The interpretation of Watergun seismic profiles located on the same navigation lines of magnetometry [2] [3] [12] has allowed to identify, in correspondence to the magnetic anomaly field 1, some lateral parasitic and/or submerged volcanic vents, located offshore the Torre del Greco town and genetically related with the eruptive activity of the volcano during recent times. These structures have been previously detected by [59] based on single-channel reflection profiles on the continental shelf of the Naples Bay and by [8] based on Chirp seismic interpretation.
In the western part of the Gulf of Naples significant magnetic anomalies have been identified in correspondence to the submarine volcanic bank of Ischia, a wide terraced bank located to the south-east of the Ischia island, genetically related to the phases of activity of the volcanic complex of the Ischia island, showing an age ranging between 147 ky since to historical times [44] [60] [62] . Another magnetic anomaly field has been recognized to the south-east of the Procida island, characterized by several volcanic complexes erupted during the Late Quaternary, ranging in age between 55 and 18 ky B.P. (Figure 17) [62] .
Moreover, complex magnetic anomalies have been identified in correspondence with the Magnaghi canyon’s head, representing a main drainage system, deeply eroding the volcanic deposits of the continental slope of the Procida island (Figure 14). The Magnaghi canyon axis, to the north-west of the structural high of the Banco di Fuori, is characterized by a composite magnetic anomaly field (Figure 18). The occurrence of previously mentioned magnetic anomaly fields confirms the hypothesis that the Magnaghi canyon is completely incised in

Figure 7. Total magnetic anomaly field map of the Naples Bay reporting main magnetic anomaly fields singled with numbers [1] .

Figure 8. Total magnetic anomaly field map of the Naples Bay reporting main magnetic anomaly fields and sketched morpho-structural lineaments [1] .

Figure 9. Detailed magnetic anomaly field map offshore the Somma-Vesuvius volcanic complex (on the bottom) and location on the magnetic anomaly field map (on the top).
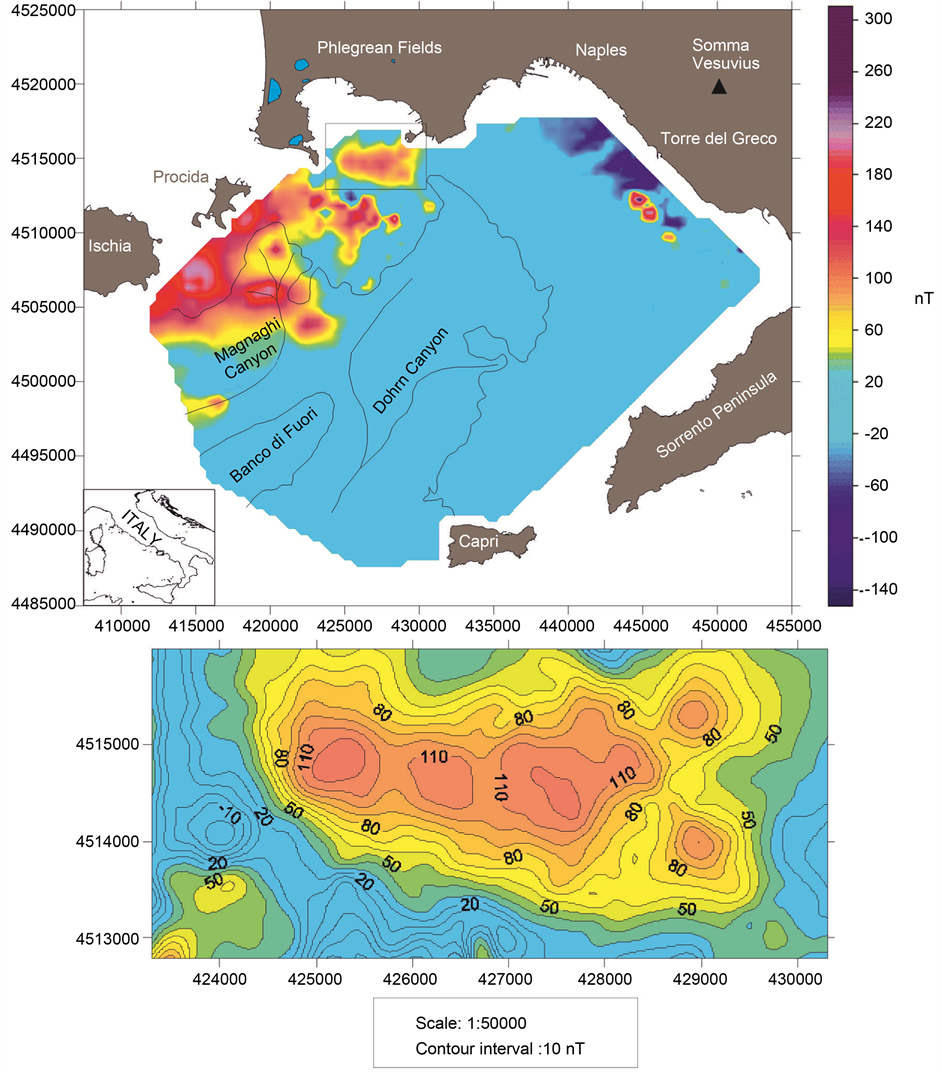
Figure 10. Detailed magnetic anomaly field map of the outer continental shelf of the Gulf of Pozzuoli (on the bottom) and location on the magnetic anomaly field map (on the top).
volcanic deposits. On the contrary, the Naples slope, in correspondence to the Dohrn canyon, does not show significant magnetic anomalies, confirming that this canyon deeply erodes sedimentary units supplied by the paleo-Sarno river mouth. Significant magnetic anomalies are also related to three small volcanic banks, previously unknown, located in correspondence to the continental shelf of the Phlegrean Fields (Figure 13) and a main volcanic bank namely Gaia [39] located in the same area, to few kilometers of distance from the small volcanic banks. An important magnetic anomaly, sub-circular in shape, has been identified on the continental slope in correspondence to the sector located among the two main canyons.

Figure 11. Detailed magnetic anomaly field map of the Miseno and Pentapalummo volcanic banks (on the bottom) and location on the magnetic anomaly field map (on the top).
No magnetic anomaly has been identified in correspondence to the “Banco di Fuori”, a main morpho- structural high separating the Dohrn and Magnaghi canyons and bounding southwards the Naples Bay. Perhaps, this

Figure 12. Detailed magnetic anomaly field map of the Gaia volcanic bank (on the bottom) and location on the magnetic anomaly field map (on the top).
evidence confirms that the latter one represents a block of Meso-Cenozoic carbonate acoustic basement, located along the structural high Capri-Sorrento Peninsula, resulting from the uplift and the rotation, to a regional scale, of the acoustic basement.
4.1. The Continental Shelf Offshore the Somma-Vesuvius Volcanic Complex and the Magnetic Anomaly Field of Torre del Greco
In the Torre del Greco offshore a large and delineated anomaly occurs (Figure 9), genetically related with the

Figure 13. Detailed magnetic anomaly field map of the Magnaghi canyon head (on the bottom) and location on the magnetic anomaly field map (on the top).

Figure 14. Detailed magnetic anomaly field map of the volcanic edifice on the Dohrn canyon slope (on the bottom) and location on the magnetic anomaly field map (on the top).

Figure 15. Detailed magnetic anomaly field map of the Magnaghi canyon axis (on the bottom) and location on the magneticanomaly field map (on the top).

Figure 16. Detail of the magnetic anomaly field genetically related with three small volcanic banks located next to the Naples shelf break.

Figure 17. Detail of the magnetic anomaly field genetically related with the Ischia submarine volcanic bank, located in the south-eastern offshore of the Ischia island.

Figure 18. Detail of the magnetic anomaly field in the Magnaghi canyon’s axis (Naples Bay canyons).
eruptive activity, during recent times, of the Somma-Vesuvius volcanic complex. The correlation of seismic and magnetic profiles has been carried out by [5] . The profile GR09 runs parallel to the shoreline from Torre del Greco to the Sorrento Peninsula crossing the Sarno plain. It is located in the inner continental shelf, where the water depths are less than 100 meters (Figure 9); the negative consequence for the seismic acquisition is a not excellent penetration of the source signal and a restitution of the profile showing some multiples. By analyzing the track of the line it is possible to see that the first seismic unit is characterized by parallel and continuous seismic reflectors, interpreted as coastal and marine sediments, deposited by the Sarno river, ranging in age between the Late Pleistocene and the Holocene. The sediments overlie an acoustically-transparent volcanic unit, characterized by a flat lower boundary, while the upper boundary is strongly irregular and describes the upper parts of dome-shaped volcanic structures. The latter unit which has been recognized, occurring only in the part to the south-east of this seismic profile, has been interpreted as the pyroclastic flux deposits of the Campanian Ignimbrite [43] . The Campanian Ignimbrite is a stratigraphic unit widely cropping out in the Sorrento Peninsula and recognized in seismic profiles as sub-outcropping in the eastern sector of the Gulf of Naples. The dome- shaped structures deforming the Ignimbrite are interpreted as submerged and/or buried lateral vents, correlated with the Somma-Vesuvius volcanic complex [63] .
The widest one extends for about 7.5 kilometers offshore the Torre del Greco town. Its upper part shows three main peaks (shot points 600 - 1300), aligned along a system of normal faults, having a NNW-SSE trending, correlated with the maximum values of anomalies singled out by the magnetic profile. The detailed magnetic anomaly field may be observed in Figure 9, characterized by three main peaks. Two of them have a dipolar shape, while for the central peak it has been recognized only a maximum value about +350 nT. The values found for the anomaly located northwards are a maximum of +350 nT related to a minimum of −160 nT. The magnetic dipole located southwards shows minor absolute values, with a maximum of about +160 nT related to a minimum of −120 nT. The thickness of the unit recognized as the Campanian Ignimbrite is of about one hundred meters based on previously described seismic profiles [5] [11] is comparable with the thickness encountered by the Trecase 1 well [54] . During the deposition the unit has probably overlain an inclined palaeomorphology, as evidenced by the landwards immersion of the erosional unit located to its base or alternatively, the unit has been involved by a tectonic deformation of the continental shelf. In proximity to the present-day shelf break, in the central sector of the gulf, some relicts morphological highs occur. The correlation between the seismic and magnetic profiles confirms the volcanic nature of the dome-shaped structure, deforming the Campanian Ignimbrite unit [5] [11] . The maximum variation of the magnetic anomaly is of about 120 nT. The trending of the anomalies and related seismic structures, about NNW-SSE, suggests that such a structural trend in the Vesuvius offshore occurs, differently to that suggested by previous authors, suggesting systems of normal faults, having a NE-SW trending [37] [46] [57] [64] [65] .
4.2. The Outer Continental Shelf of the Gulf of Pozzuoli and the Related Magnetic Anomaly Field
Previously interpreted seismic profiles [5] [11] have allowed for the investigation of the magnetic anomaly field named as 2, whose detail is shown in Figure 10. It is composed of a set of minor anomalies, aligned according to a E-W direction. These anomalies do not occur in a dipolar shape and form a succession of magnetic maxima having values in the order of hundreds of nanotesla. They are genetically related with buried edifices in the zone of the Nisida bank and related tuff cones. The interpretation of the magnetic anomaly map suggests a possible localization of the submerged margin of the Phlegrean caldera in this area.
4.3. The Miseno and Pentapalummo Volcanic Banks and Related Magnetic Anomalies
Several dipoles have been noted in the detailed magnetic anomaly map offshore the Phlegrean Fields volcanic complex (Figure 11). Two of them are the most important ones. The first one is located in the upper part of the survey area and is characterized by a minimum of −200 nT, related to a maximum of +185 nT, having a E-W trending. The second one, oriented in a NW-SE direction, occurs in the eastern part of the involved area and shows magnetization values having the same order of the previously mentioned ones. Interpreted seismic sections have shown the stratigraphic architecture of this area, characterized by the occurrence of volcanic and sedimentary seismic units. Detailed magnetic anomaly map of the Ischia bank is also reported in Figure 12, shown here for its similarity with aforementioned volcanic banks.
4.4. The Gaia Volcanic Bank on the Naples Continental Slope
The magnetic anomaly field singled out as 5 (Figure 12) is related with the submarine volcanic bank, namely Gaia, located next to the shelf break on the isobath of 140 m. It shows a maximum of +170 nT, which puts in evidence a high magnetic susceptibility of the structure. There is a discrete correlation among the shape of the magnetic anomaly and the sea bottom morphology.
4.5. The Continental Slope of the Magnaghi Canyon and the Magnetic Anomaly Field on the Western Branch
In correspondence to the Magnaghi canyon’s head, shown as the magnetic anomaly field (Figure 13) a magnetic anomaly, not dipolar and characterized by a maximum of +170 nT, occurs, significantly eroding the volcanic deposits of the Procida slope. This confirms that the Magnaghi canyon is completely incised in volcanic deposits, as evidenced both by the occurrence of magnetic anomalies both at the branch and in the canyon’s axis. On the contrary, the Dohrn canyon, characterized by two branches merging into an axis arriving up to 1000 m of depth, does not show significant magnetic anomalies, confirming that it erodes sedimentary units supplied by the paleo-Sarno river mouth. Stratigraphic data on the Naples Bay canyons have been deeply analyzed in previous papers [9] [21] [61] .
4.6. The Continental Slope of the Dohrn Canyon and the Magnetic Anomaly Field at Its Head
Another important anomaly, circular in shape, has been identified on the continental slope of the gulf (Figure 14) in the sector among the two canyons. It occurs as a single maximum around the +145 nT, indicated as the magnetic anomaly field n. 7. It may suggest the occurrence of a previously unknown volcanic edifice on the flank of the Dohrn canyon.
4.7. The “Banco di Fuori” and the Magnetic Anomaly in the Magnaghi Canyon’s Axis
A main morpho-structural high has been crossed by the profile (Banco di Fuori or Banco di Bocca Grande), which separates the Dohrn canyon from the Magnaghi canyon and is presumably composed of blocks of Mesozoic carbonates resulting from the uplift and the regional inclination of the carbonate acoustic basement [8] . The bank is overlain by Late Pleistocene-Holocene sediments and its southern flank is steeper than the northern one, suggesting the occurrence of a normal fault. The Magnaghi canyon’s axis is characterized by the occurrence of a magnetic magnetic anomaly field indicated as 10 (Figure 15). The anomaly shows a dipolar shape, with a maximum value around the +110 nT related to a minimum of −50 nT, with a trending of the minimum-maxi- mum trending from SSW to NNE.
5. Concluding Remarks
Detailed anomaly field maps in Naples Bay have been shown and discussed based on high resolution magnetometric data. These details have been never shown in previous papers and some of them represent previously unknown field anomalies. This assumption is particularly true in the case of the magnetic anomalies detected on the Naples Bay continental slope. The relationships of the magnetic anomaly fields with the sea bottom topography in the Gulf of Naples have also been discussed. This paper has represented a contribution to the knowledge of applications of magnetic theory and selected examples in active volcanic areas, where the development of magnetic anomalies is very common due to the occurrence of interlayered volcanic edifices and seismic units. To this aim the Naples Bay has represented an important site to develop and discuss these research themes pertaining to physics and geology.
Cite this paper
Gemma Aiello,Ennio Marsella, (2016) Magnetic Theory and Applications in the Naples Bay (Southern Tyrrhenian Sea, Italy): Magnetic Anomaly Fields and Relationships with Morpho-Structural Lineaments. World Journal of Condensed Matter Physics,06,183-216. doi: 10.4236/wjcmp.2016.63020
References
- 1. Aiello, G., Angelino, A., Marsella, E., Ruggieri, S. and Siniscalchi, A. (2004) Carta Magnetica di alta risoluzione del Golfo di Napoli. Bollettino della Società Geologica Italiana, 123, 333-342.
- 2. Marsella, E., Aiello, G., Angelino, A., Bruno, P.P.G., Di Fiore, V., Giordano, F., Pelosi, N., Siniscalchi, A., D’Isanto, C. and Ruggieri, S. (2002) Shallow Geological Structures and Magnetic Anomalies in the Gulf of Naples (Southern Tyrrhenian Sea, Italy). An Integrated Analysis of Seismic and Magnetometric Profiles. Bollettino di Geofisica Teorica Applicata, 42, 292-297.
- 3. Siniscalchi, A., Angelino, A., Ruggieri, S., Aiello, G., Marsella, E. and Sacchi, M. (2002) High Resolution Magnetic Anomaly Map of the Bay of Naples (South-Eastern Tyrrhenian Sea, Italy). Bollettino di Geofisica Teorica Applicata, 42, 99-104.
- 4. Secomandi, M., Paoletti, V., Aiello, G., Fedi, M., Marsella, E., Ruggieri ,S., D’Argenio, B. and Rapolla, A. (2003) Analysis of the Magnetic Anomaly Field of the Volcanic District of the Bay of Naples, Italy. Marine Geophysical Researches, 24, 207-211.
http://dx.doi.org/10.1007/s11001-004-4220-1 - 5. Aiello, G., Angelino, A., D’Argenio, B., Marsella, E., Pelosi, N., Ruggieri, S. and Siniscalchi, A. (2005) Buried Volcanic Structures in the Gulf of Naples (Southern Tyrrhenian Sea, Italy) Resulting from High Resolution Magnetic Survey and Seismic Profiling. Annals of Geophysics, 48, 1-15.
- 6. Ruggieri, S., Aiello, G. and Marsella, E. (2007) The Naples Bay Continental Slope (Southern Tyrrhenian Sea, Italy) Investigated by Means of High Resolution Seismic and Magnetic Data Constrained by Bathymetry. Bollettino di Geofisica Teorica Applicata, 48, 1-24.
- 7. Agip (1981) Carta magnetica—Anomalie del Campo Magnetico Residuo—scala 1:500.000. S. Donato Milanese, Italy.
- 8. Di Fiore, V., Aiello, G. and D’Argenio, B. (2011) Gravity Instabilities in the Dohrn canyon (Bay of Naples, Southern Tyrrhenian Sea): Potential Wave and Run-Up (Tsunami) Reconstruction from a Fossil Submarine Landslide. Geologica Carpathica, 62, 55-63.
- 9. Coticchia, A., De Santis, A., Di Ponzio, A., Dominici, G., Meloni, A., Pierozzi, M. and Sperti, M. (2001) La Rete Magnetica Italiana e la Carta Magnetica d’Italia al 2000. Boll. Geodetico e Scientifico Affini, Rivista dell’ Istituto Geografico Militare, 4.
- 10. Brancaccio, L., Cinque, A., Romano, P., Rosskopf, C., Russo, F. and Santangelo, N. (1995) L’evoluzione delle pianure costiere in Campania: geomorfologia e neotettonica. Memorie della Società Geografica Italiana, 53, 313-336.
- 11. D’Argenio, B., Pescatore, T. and Scandone, P. (1973) Schema geologico dell’Appennino meridionale (Campania e Lucania). Atti Accademia Nazionale dei Lincei, 183, 220-248.
- 12. Bonardi, G., Amore, F.O., Ciampo, G., de Capoa, P., Miconnet, P. and Perrone, V. (1988) Il Complesso Liguride Auct.: stato delle conoscenze e problemi aperti sulla sua evoluzione appenninica ed i suoi rapporti con l’Arco Calabro. Memorie della Società Geologica Italiana, 41, 17-35.
- 13. Capaldi, G., Civetta, L. and Gillot, P.Y. (1987) Geochronology of Plio-Pleistocene Volcanic Rocks of Southern Italy. Rendiconti Società Mineralogia Petrologia, 40, 25-44.
- 14. Ippolito, F., Ortolani, F. and Russo, M. (1973) Struttura marginale tirrenica dell’Appennino campano: Reinterpretazione di dati di antiche ricerche di idrocarburi. Memorie della Società Geologica Italiana, 12, 227-250.
- 15. Cinque, A., Aucelli, P.P.C., Brancaccio, L., Mele, R., Milia, A., Robustelli, G., Romano, P., Russo, F., Santangelo, N. and Sgambati, D. (1997) Volcanism, Tectonics and Recent Geomorphological Change in the Bay of Napoli. International Association Geomorphologists IV International Conference on Geomorphology, Geografia Fisica Dinamica Quaternaria, Bologna, 1-3 October 1997, 123-141.
- 16. Ortolani, F. and Aprile, F. (1978) Nuovi dati sulla struttura profonda della Piana Campana ad est del fiume Volturno. Bolletino della Società Geologica Italiana, 97, 591-608.
- 17. Fabbri, A., Gallignani, P. and Zitellini, N. (1981) Geological Evolution of Perityrrhenian Sedimentary Basins. In: Wezel, F.C., Ed., Sedimentary Basins of the Mediterranean Margins, Tecnoprint, Bologna, Italy.
- 18. Bartole, R. (1984) Tectonic Structure of the Latian-Campanian Shelf (Tyrrhenian Sea). Bollettino di Oceanologia Teorica Applicata, 2, 197-230.
- 19. Bartole, R., Savelli, D., Tramontana, M. and Wezel, F.C. (1983) Structural and Sedimentary Features in the Tyrrhenian Margin off Campania, Southern Italy. Marine Geology, 55, 163-180.
http://dx.doi.org/10.1016/0025-3227(84)90067-7 - 20. Finetti, I. and Del Ben, A. (1986) Geophysical Study of the Tyrrhenian Opening. Bollettino di Geofisica Teorica Applicata, 28, 75-155.
- 21. Trincardi, F. and Zitellini, N. (1987) The Rifting of the Tyrrhenian Basin. Geomarine Letters, 7, 1-6.
http://dx.doi.org/10.1007/BF02310459 - 22. Mariani, M. and Prato, R. (1988) I bacini neogenici costieri del margine tirrenico: Approccio sismico-stratigrafico. Memorie della Società Geologica Italiana, 41, 519-531.
- 23. Latmiral, G., Segre, A., Bernabini, M. and Mirabile, L. (1971) Prospezioni sismiche per riflessione nei Golfi di Napoli e Pozzuoli ed alcuni risultati geologici. Bollettino della Società Geologica Italiana, 90, 163-172.
- 24. Bernabini, M., Latmiral, G., Mirabile, L. and Segre, A. (1973) Alcune prospezioni sismiche per riflessione nei Golfi di Napoli e Pozzuoli. Bollettinodella Società Geologica Italiana, 90, 163-172.
- 25. Pescatore, T., Diplomatico, G., Senatore, M.R.,Tramutoli, M. and Mirabile, L. (1984) Contributi allo studio del Golfo di Pozzuoli: Aspetti stratigrafici e strutturali. Memorie della Società Geologica Italiana, 27, 133-149.
- 26. Milia, A. (1996) Evoluzione tettono-stratigrafica di un bacino peri-tirrenico: Il Golfo di Napoli. Tesi di Dottorato di Ricerca in Geologia del Sedimentario, Università degli Studi di Napoli Federico II, Napoli, Italy.
- 27. Calligaris, D., Morelli, C. and Pisani, M. (1972) Rilievo gravimetrico e magnetico. CNR, Quaderni De La Ricerca Scientifica, Roma, Italia.
- 28. Napoleone, G., Ripepe, M. and Ruggiero, E.(1984) Contributi allo studio del Golfo di Pozzuoli: Strutture episuperficiali dedotte dal rilievo magnetico. Memorie della Società Geologica Italiana, 27, 205-211.
- 29. Fusi, N. (1996) Structural Setting of the Carbonatic Basement and Its Relationships with Magma Uprising in the Gulf of Naples, Italy. Annals of Geophysics, 39, 493-509.
- 30. Rosi, M. and Sbrana, A. (1987) Phlegrean Fields. CNR, Quaderni De La Ricerca Scientifica, Rome, Italy.
- 31. Vezzoli, L. (1988) Island of Ischia. CNR, Quaderni De La Ricerca Scientifica, Rome, Italy.
- 32. Segre, A.G. (1970) La carta batimetrica n. 1256 del Golfo di Pozzuoli. Istituto Idrografico della Marina, Genova, 12.
- 33. Finetti, I. and Morelli, C. (1973) Esplorazione sismica per riflessione dei Golfi di Napoli e Pozzuoli. Bollettino di Geofisica Teorica Applicata, 16, 175-222.
- 34. La Torre, P. and Nannini, R. (1980) Geothermal Well Location in Southern Italy: The Contribution of Geophysical Methods. Bollettino di Geofisica Teorica Applicata, 22, 201-209.
- 35. Rosi, M., Sbrana, A. and Principe, C. (1983) The Phlegrean Fields: Structural Evolution, Volcanic History and Eruptive Mechanisms. Journal of Volcanology and Geothermal Research, 17, 273-288.
http://dx.doi.org/10.1016/0377-0273(83)90072-0 - 36. Parascandola, A. (1947) I fenomeni bradisismici del Serapeo di Pozzuoli. Genovese, Napoli, 1-117.
- 37. Dvorak, J. and Mastrolorenzo, G. (1991) The Mechanisms of Recent Vertical Crustal Movements in Campi Flegrei Caldera, Southern Italy (Special Paper (Geological Society of America)), Geological Society of Amer, 47 p.
- 38. Morhange, C., Bourcier, M., Laborel, J., Gialanella, C., Goiran, J.P., Crimaco, C. and Vecchi, L. (1999) New Data on Historical Sea Level Movements in Pozzuoli, Phlegrean Fields, Southern Italy. Physics and Chemistry of the Earth, 24, 349-354.
http://dx.doi.org/10.1016/S1464-1895(99)00040-X - 39. Perrone, V. (1988) Carta geologica della Penisola Sorrentina. Note illustrative. Atti del 74° Congresso della Società Geologica Italiana, Sorrento, 336-340.
- 40. Ruggieri, S. (2007) Applicazione di metodologie di geofisica marina allo studio di aree vulcaniche attive: Carta magnetica di alta risoluzione dei Golfi di Napoli e Gaeta (Tirreno centro-meridionale) e correlazioni con i principali lineamenti morfo-strutturali. Tesi di Dottorato di Ricerca in Scienze ed Ingegneria del Mare, Università di Napoli Federico II, Napoli, Italy.
- 41. Molina, F. and De Santis, A. (1987) Considerations and Proposal for a Best Utilization of IGRF over Areas Including a Geomagnetic Observatory. Physics of the Earth and Planetary Interiors, 48, 379-385.
- 42. Aiello, G., Angelino, A., Budillon, F., Cappelletti, P., Conforti, A., Cristofalo, G., De Lauro, M., Ferraro, L., Insinga, D., Marsella, E., Molisso, F., Montella, R., Morra, V., Musella, S., Nicotra, G., Pelosi, N., Pinto, C., Rapisarda, S., Ricci, G., Russo, L., Sacchi, M., Santoro, G., Sarnacchiaro, G., Sclafani, P., Tonielli, R. and Toscano, F. (1999) Campionature del fondo mare e prospezioni geofisiche nell’area dei Golfi di Napoli e Salerno. Istituto di Ricerca Geomare Sud, Rapporto Tecnico No. 9, Crociera Oceanografica GMS98-01, Napoli, Dicembre 1999.
- 43. Fusi, N., Mirabile, L., Camerlenghi, A. and Ranieri, G. (1991) Marine Geophysical Survey of the Gulf of Naples. Memorie della Società Geologica Italiana, 47, 95-114.
- 44. Rosi, M. and Sbrana, A.(1987) Phlegrean Fields. CNR, Quaderni De La Ricerca Scientifica, Roma, Italy.
- 45. Fedi, M., Primiceri, R., Quarta, T. and Villani, A.V. (2002) Potere Risolutivo della Trasformata Continua di Wavelet Applicata a Campi di Potenziale Generati da Sorgenti Estese. Proceedings 21st National Congress GNGTS, National Research Council of Italy, Rome, 19-21 November 2002, 429-430.
- 46. Fedi, M. and Quarta, T. (1998) Wavelet Analysis for the Regional-Residual and Local Separation of Potential Field Anomalies. Geophysical Prospecting, 46, 507-525.
http://dx.doi.org/10.1046/j.1365-2478.1998.00105.x - 47. Fedi, M. and Rapolla, A.(1987) I Metodi Gravimetrico e Magnetico nella Geofisica Applicata. Liguori Editore, Napoli.
- 48. Aiello, G., Angelino, A., Bruno, P., Di Fiore, V., Fedi, M., Florio, G., Marsella, E., Paoletti, V., Pelosi, N., Rapolla, A., Ruggieri, S. and Siniscalchi, A. (2002) Newly Detected Magnetic Anomalies Offshore the Somma-VesuviusVolcanic Complex (Italy) and Related Seismic Structures. Proceedings 21st National Congress GNGTS, National Research Council of Italy, Rome, 19-21 November 2002, 413-414.
- 49. Aiello, G., Marsella, E. and Ruggieri, S. (2010) Three-Dimensional Magneto-Seismic Reconstruction of the “Torre del Greco” Submerged Volcanic Structure (Naples Bay, Southern Tyrrhenian Sea, Italy): Implications for Vesuvius’ Marine Geophysics and Volcanology. NearSurface Geophysics, 8, 17-31.
http://dx.doi.org/10.3997/1873-0604.2009037 - 50. Chiappini, M., Meloni, A., Boschi, E., Faggioni, O., Beverini, N., Carmisciano, C. and Marson, I. (2000) Shaded Relief Magnetic Anomaly Map of Italy and Surrounding Marine Areas. Annali di Geofisica, 43, No. 5.
- 51. D’Argenio, B., Aiello, G., de Alteriis, G., Milia, A., Sacchi, M., et al. (2004) Digital Elevation Model of the Naples Bay and Adjacent Areas, Eastern Tyrrhenian Sea. In: Pasquarè, E. and Venturini, G., Eds., Mapping Geology in Italy, Atlante di Cartografia Geologica, Firenze, Italy.
- 52. Aiello, G., Budillon, F., Cristofalo, G., de Alteriis, G., De Lauro, M., Ferraro, L., Marsella, E., Pelosi, N.., Sacchi, M. and Tonielli, R. (2001) Marine Geology and Morpho-Bathymetry in the Bay of Naples. In: Faranda, F.M., Guglielmo, L. and Spezie, G., Eds., Structures and Processes of Mediterranean Ecosystems, Chap. 1, Springer Verlag, Milano, Italy, 1-8.
http://dx.doi.org/10.1007/978-88-470-2105-1_1 - 53. Milia, A. and Torrente, M.M. (1997) Evoluzione tettonica della Penisola Sorrentina (margine peritirrenico campano). Bollettino della Società Geologica Italiana, 116, 487-502.
- 54. Balducci, A., Vaselli, M. and Verdiani, G. (1985) Exploration Well in the Ottaviano Permit, Italy. European Geothermal Update: Proceedings of the 3rd International Seminar on the Results of the EC Geothermal Energy Research, Dordrecht, 7-11 December 1985, 253.
- 55. Principe, C., Rosi, M., Santacroce, R. and Sbrana, A. (1987) Explanatory Notes to the Geological Map. In: Santacroce, R., Ed., Somma-Vesuvius, CNR, Quaderni De La Ricerca Scientifica, Rome, Italy.
- 56. Cassano, E. and La Torre, P. (1987) Geophysics. In: Santacroce, R., Ed., Somma-Vesuvius, CNR, Quaderni De La Ricerca Scientifica, Rome, Italy.
- 57. Delibrias, G., Di Paola, G.M., Rosi, M. and Santacroce, R. (1979) La storia eruttiva del complesso vulcanico Somma- Vesuvio ricostruita dalle successioni piroclastiche del Monte Somma. Rendiconti Società Italiana Mineralogia e Petrologia, 35, 411-438.
- 58. Milia, A., Mirabile, L., Torrente, M.M. and Dvorak, J.J. (1998) Volcanism Offshore of Vesuvius Volcano in Naplesbay. Bulletin of Volcanology, 59, 404-413.
http://dx.doi.org/10.1007/s004450050200 - 59. Aiello, G., Marsella, E. and Passaro, S. (2012) Stratigraphic and Structural Setting of the Ischia Volcanic Complex (Naples Bay, Southern Italy) Revealed by Submarine Seismic Reflection Data. Rendiconti Lincei, 23, No. 4.
http://dx.doi.org/10.1007/s12210-012-0204-2 - 60. Aiello, G. and Marsella, E. (2014) The Southern Ischia Canyon System: Examples of Deep Sea Depositional Systems on the Continental Slope off Campania. Rendiconti Online della Società Geologica Italiana, 32, 28-37.
http://dx.doi.org/10.3301/ROL.2014.145 - 61. Aiello, G. and Marsella, E. (2015) Interactions between Late Quaternary Volcanic and Sedimentary Processes in the Naples Bay, Southern Tyrrhenian Sea. Italian Journal of Geosciences, 134, 367-382.
http://dx.doi.org/10.3301/IJG.2014.56 - 62. Santacroce, R. (1987) Somma-Vesuvius. CNR, Quaderni De La Ricerca Scientifica, Rome, Italy.
- 63. Bruno, P.P.G., Cippitelli, G. and Rapolla, A. (1998) Seismic Study of the Mesozoic Carbonate Basement around Mt. Vesuvius, Italy. Journal of Volcanology and Geothermal Research, 84, 311-322.
http://dx.doi.org/10.1016/S0377-0273(98)00023-7 - 64. Simini, M., La Torre, D. and Zollo, A. (2003) 3D Limestone Top Morphology in NaplesBay. In: Capuano, P., et al., Eds., The Internal Structure of Mount Vesuvius—A Seismic Tomography Investigation, Liguori Editore, Napoli, Italy, 217-235.
- 65. Judenherc, S. and Zollo, A. (2004) The Bay of Naples (Southern Italy): Constraints on the Volcanic Structures Inferred from a Dense Seismic Survey. Journal of Geophysical Research, 109, Article ID: B10312.
http://dx.doi.org/10.1029/2003jb002876