World Journal of Condensed Matter Physics
Vol.4 No.1(2014), Article ID:42844,11 pages DOI:10.4236/wjcmp.2014.41003
Effect of Sintering Time on the Structural, Magnetic and Electrical Transport Properties of Mg0.35Cu0.20Zn0.45Fe1.94O4 Ferrites
![]()
1Institute of Nuclear Science and Technology, Atomic Energy Research Establishment, Savar, Dhaka, Bangladesh; 2Department of Applied Physics, Electronics and Communication Engineering, Islamic university, Kushtia, Bangladesh; 3Materials Science Division, Atomic Energy Centre, Ramna, Dhaka, Bangladesh; 4Department of Glass and Ceramic Engineering, Bangladesh University of Engineering and Technology, Dhaka, Bangladesh.
Email: *manju_iu@yahoo.com
Copyright © 2014 M. Aliuzzaman et al. This is an open access article distributed under the Creative Commons Attribution License, which permits unrestricted use, distribution, and reproduction in any medium, provided the original work is properly cited. In accordance of the Creative Commons Attribution License all Copyrights © 2014 are reserved for SCIRP and the owner of the intellectual property M. Aliuzzaman et al. All Copyright © 2014 are guarded by law and by SCIRP as a guardian.
Received November 11th, 2013; revised January 6th, 2014; accepted January 21st, 2014
KEYWORDS
Mg-Cu-Zn Ferrites; Complex Permeability; Electrical Properties
ABSTRACT
Spinel-type Mg0.35Cu0.20Zn0.45Fe1.94O4 ferrites were synthesized by using the solid-state reaction technique. The XRD patterns of the sintered samples indicated the formation of single-phase cubic spinel structure. The apparent density of the sample is found to increase whereas porosity decreases with the increase in sintering time. The grain growth of the samples is enhanced with the increase in sintering time which is attributed to the liquid phase due to CuO during sintering. The initial permeability of the ferrite is found to increase with the increase in sintering time but the resonance frequency shifts towards the lower frequency. This increase in permeability is correlated to the increase of density and the grain size of the sample. The resistivity of the samples decreases with 103/T ensuring the semiconducting nature of the samples. Room temperature DC resistivity and activation energy of the samples decrease what is attributed to the increased Fe2+ ions content with the increase in sintering time. The dielectric constant ((() of the samples decreases with increasing frequency whereas (( increases as the temperature increases exhibiting normal dielectric behaviour of the magnetic semiconductor ferrite. The observed variation of electrical and dielectric properties is explained on the basis of Fe2+/Fe3+ ionic concentration as well as the electronic hopping frequency between Fe3+ and Fe2+ ions in the present ferrite sample.
1. Introduction
Spinel ferrites are technologically very important magnetic materials having potential applications and have attracted intense interest in both the fundamental and the applied research points of view. The essential property which makes these ferrites irreplaceable is the co-existence of a relatively high magnetic polarization and high electrical resistivity, something that does not occur in metals. The polycrystalline ferrites are a complex system composed of crystallites, grain boundaries and pores. In solid state materials, mixed spinel ferrites have gained a prime importance because of their various potential applications. Among them, the Mg-Cu-Zn ferrites are considered as one of the most important magnetic oxides due to their high electrical resistivity, remarkable flexibility in tailoring the magnetic properties, relatively high Curie temperature, applicability at higher frequency, low cost, high mechanical hardness and higher corrosion resistance [1]. Ajmal et al. [2] found that grain size, density and drift mobility increased whereas porosity, dc resistivity and activation energy decreased with the increase in sintering time of Cu0.6Zn0.4Fe2O4 ferrites. Bera and Roy [3]
investigated that apparent density and grain size increased whereas porosity decreased with the increase in sintering time of nickel-zinc ferrites. Jain et al. [4] have found a reduction in dc resistivity in vanadium doped NiZn ferrites with the increase in sintering temperature. The observed decrease has been attributed to the reduced porosity and has increased grain size at the higher sintering temperature.
The initial permeability is very sensitive magnetic properties of ferrites. The method of ferrite preparation and the sintering conditions greatly influence it. The complex permeability of sintered ferrite was well-described as the summation of the spin rotational contribution and the domain wall motion component [5]. Domain wall motion is sensitive to both the grain size and post-sintering density while spin rotation depends only on the post-sintering density of ferrites. For polycrystalline ferrites, the larger the grain size and sintering density are, the higher the permeability is [6]. The electrical transport properties of ferrites are very sensitive to the chemical compositions, sintering temperature, sintering time, type and amount of substitutions. Conductivity in this material occurs essentially via the hopping of electrons between Fe2+ and Fe3+ ions. In the present work, the effect of sintering time (1 h, 2 h, 3 h, 4 h and 5 h) on the density, microstructure, initial permeability, Curie temperature, resistivity and dielectric constant of Mg0.35Cu0.20Zn0.45Fe1.94O4 ferrites has been investigated.
2. Experimental
The ferrite Mg0.35Cu0.20Zn0.45Fe1.94O4 has been prepared by the standard solid-state reaction technique. The starting materials for the preparation of the studied compositions were in the form of AR grade oxides (Fe2O3, MgO, ZnO, CuO) of E. Merck of Germany. The detailed procedure of sample preparation was described elsewhere [7, 8]. The pressed pellet and toroid shaped samples were sintered at 1150˚C for different holding time in air and then cooled in the furnace. The samples were polished in order to remove any oxide layer formed during the process of sintering. The weight and dimensions of the pellets were measured to determine bulk densities.
Phase analysis was done by X-ray diffraction using Phillips (PW3040) X¢ Pert PRO X-ray diffractometer. The powder specimens were exposed to Cu Ka radiation (l = 1.5418 Å) to characterize the samples with a primary beam power of 40 kV and 30 mA with a sampling pitch of 0.02˚ and time for each step data collection was 1.0 sec. The completion of the solid state reaction was confirmed by X-ray diffraction (XRD) analysis. It was observed that almost all the lines were fully developed and there were no impurity phases for the samples sintered at 1150˚C. The microstructures of the sintered ferrites were taken by using scanning electron microscopy (Hitachi S-3400N, type-II, Japan). The micrographs were taken on smooth surfaces of the pellet shaped samples after polishing by using a universal polisher. Before taking the micrographs, the surfaces of the samples were thermally etched at a temperature of 1000˚C for 10 min.
The complex permeability of the toroid shaped samples at room temperature was measured with the Agilent precision impedance analyzer (Agilent 4294A) in the frequency range 1 kHz to 100 MHz. The permeability m' was calculated by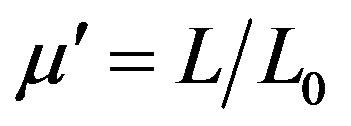 , where L is the measured sample inductance and L0 is the inductance of the coil of same geometric shape of vacuum. The imaginary permeability mʺ was determined by the relation mʺ = m¢D, where D = tand, the loss tangent of the sample. For these measurements an applied voltage of 5 mV was used with a 5 turn low inductive coil. The temperature dependence of initial permeability of the samples was carried out by using Hewlett Packart impedance analyzer (HP 4291A) in conjunction with a laboratory made furnace at Materials Science Division of Atomic Energy Centre, Dhaka. The sample was kept in a tubular furnace which maintains the desired temperature with the help of a temperature controller. The heating rate was maintained as approximately 0.5˚C∙min−1, in order to ensure a homogeneous sample temperature. The Curie temperature was determined from the temperature dependence of permeability measurements. At Curie temperature, the permeability shows an abrupt drop to a very low value. Field dependence of magnetization at room temperature was measured using a vibrating sample magnetometer (VSM 02, Hirstlab, England).
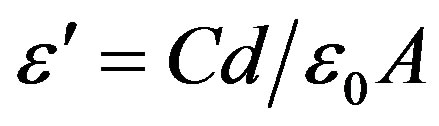
Electrical and dielectric properties were carried out by using Keithley Electrometer and Hewlett Packart impedance analyzer (HP 4291A). For electrical and dielectric measurements, the pellet shaped samples were well polished to remove any roughness and the two surfaces of each pellet were coated with silver paint as contact material. The room temperature DC electrical resistivity and temperature dependence of resitivity were carried out by a two probe method on sintered pellets of about 1 cm diameter and 0.2 cm thickness by using a Keithley Electrometer. Dielectric measurement as a function of frequency in the range 1 kHz - 13 MHz at room temperature and also as a function of temperature in the range 30 - 200˚C at different frequencies were performed. The real part of dielectric constant was calculated using the formula
 (1)
(1)
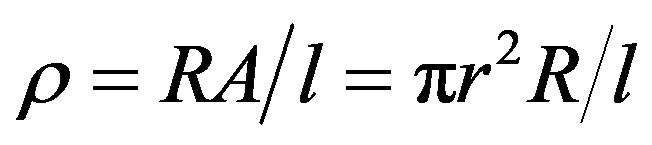
where, C is the capacitance of the pellet in Farad, d the thickness of the pellet in metre, A be the cross-sectional area of the flat surface of the pellet in m2 and e0 the constant of permittivity for free space. The electrical resistivity was calculated according to the relation
 (2)
(2)
where, R is the resistance of the pellet, r is the radius of the pellet and l is the thickness of the pellet.
3. Results and Discussion
3.1. Structural Properties
The identification of crystallographic structure and determination of lattice constant were performed on an X-ray diffraction (XRD). Figure 1 shows the indexing XRD patterns of Mg0.55Cu0.20Zn0.45Fe1.94O4 ferrites of milled powder, pre-sintered sample and sintered ferrites. XRD pattern of milled powder (before pre-sintering) indicates the presence of mostly hematite (Fe2O3) phase, ZnO phase and Fe phase with a small single peak of ferrite. There are a-Fe2O3 phases which often appear at low temperatures or milled samples when the solid state reaction is not complete. Figure 1(b) shows the XRD pattern of Mg0.55Cu0.20Zn0.45Fe1.94O4 ferrite sample pre-sintered at 900˚C for 6 h. In this pattern, the intensity of the ferrite phase is getting stronger while the hematite phase and other phases completely disappear. This XRD pattern indicates only the ferrite phase where almost 100% ferritization has been observed. The XRD patterns of samples sintered at 1150˚C for 1 h and 5 h, respectively show good crystallization, with well-defined diffraction lines. The structure can be indexed as a single-phase cubic spinel structure with no additional lines corresponding to any other phases. All the peaks observed in the XRD pattern match well with those of Mg-Cu-Zn [7-9] and MgCu [10] ferrites reported earlier. The peaks (111), (220), (311), (222), (400), (422), (511) and (440) correspond to spinel phase.
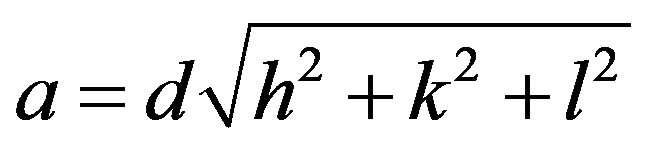
The lattice parameter for each peak of the samples was calculated by using the relation:
 (3)
(3)
where h, k, and l are the Miller indices of the crystal planes. The exact lattice constant was determined by using the Nelson-Rilay extrapolation method. The values of
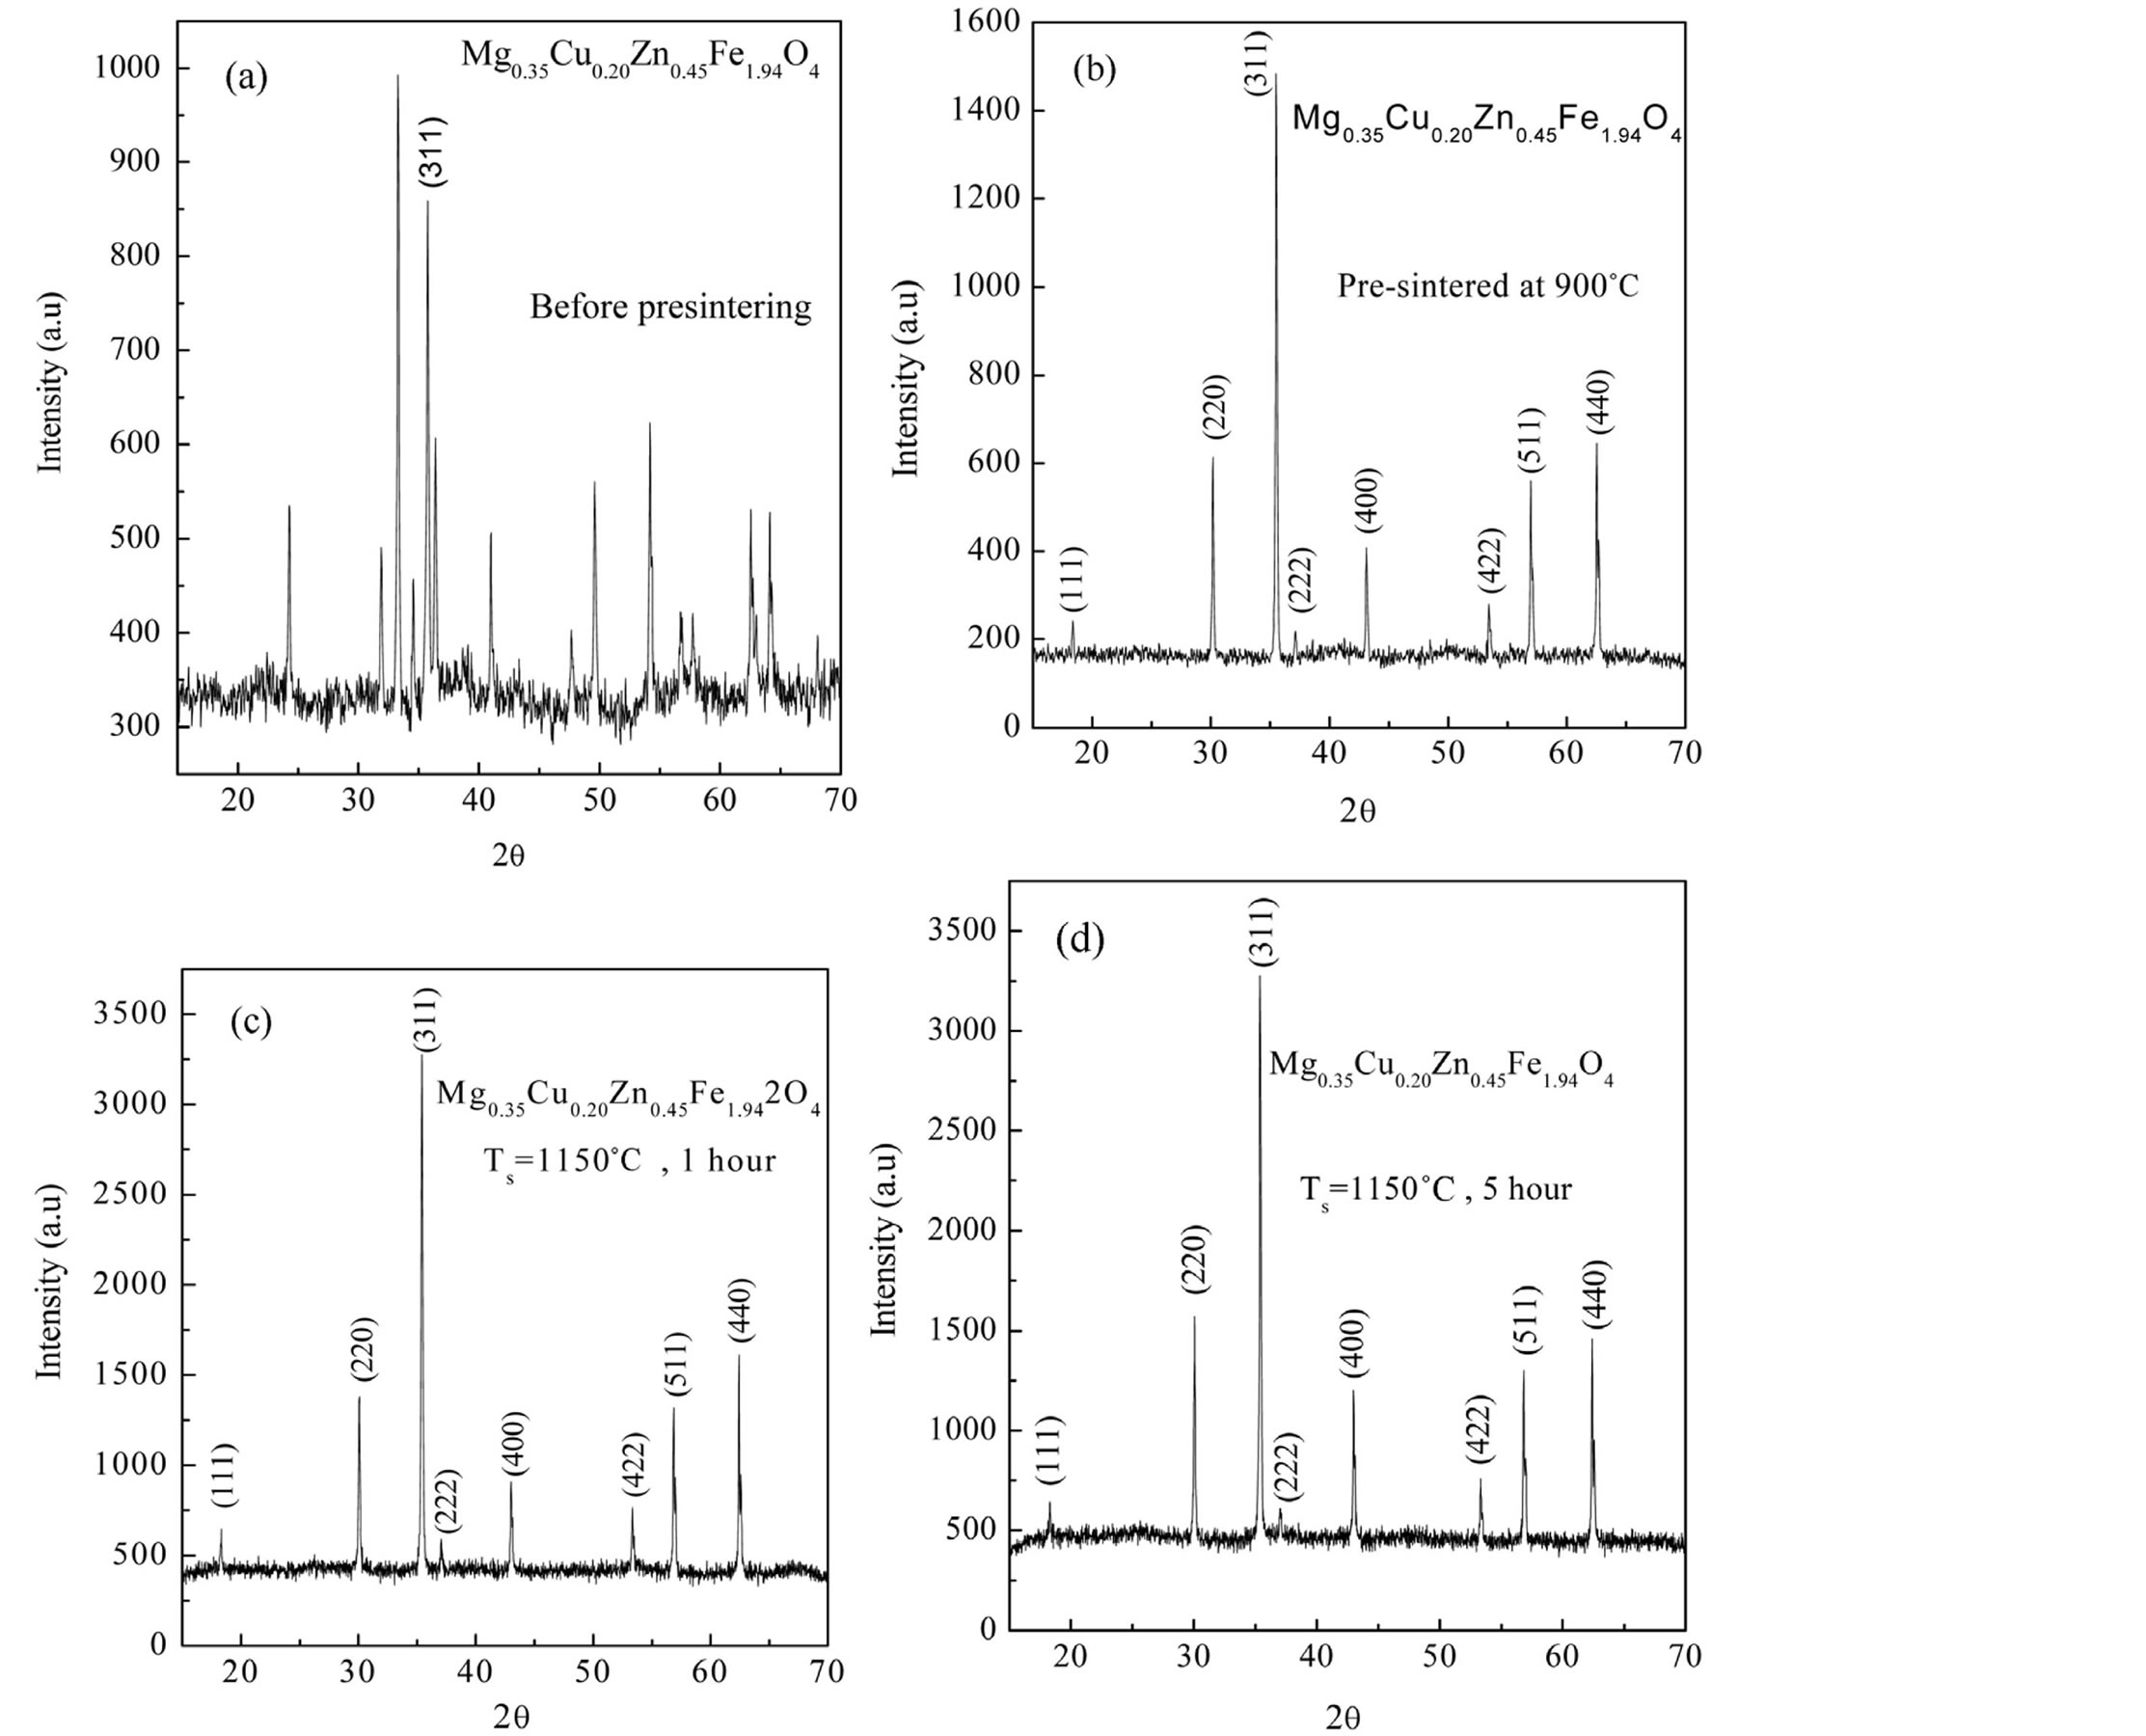
Figure 1. XRD pattern of Mg0.35Cu0.20Zn0.45Fe1.94O4 ferrite (a) ferrite powder (before pre-sintering), (b) pre-sintered at 900˚C for 6 h, (c) sintered at 1150˚C for 1 h and (d) sintered at 1150˚C for 5 h, respectively.
the lattice constant obtained from each reflected plane are plotted against Nelson-Rilay function [11]
 (4)
(4)
where, q is the Bragg’s angle. The values of lattice parameter of all peaks for a sample was plotted against F(q) (not shown). The exact lattice parameter was determined by using a least square fitting method. The lattice constant of the sample is found to be 8.4135 Å which is consisted with the reported value [7].
The apparent density (ra) was calculated by considering the cylindrical shape of the pellets and using the relation
 (5)
(5)
where, m is the mass, r the radius and h the thickness of the pellet. The X-ray density (rx) of the prepared ceramic sample was calculated using the relation
 (6)
(6)
where, M is the molecular weight of the corresponding composition, N is Avogadro’s number, a is the lattice parameter and Z is the number of molecules per unit cell, which is 8 for the spinel cubic structure. Porosity P of the sample indicates the presence of minute pores and channels within the sample. Porosity P of the ferrite samples was then determined by employing the relation
 (7)
(7)
The effect of sintering time ts on the apparent density and the porosity is shown in Table 1 and Figure 2. The apparent density increases from 4.649 g∙cm−3 to 4.724 g∙cm−3 as the sintering time is increased from 1 h to 5 h. The porosity of the samples is less than 6% that indicates the existence of very few pores in the samples. It decreases from 5.98% for ts = 1 h to 4.48% for ts = 5 h. The reduction of P may be attributed to the presence of CuO, which helps the intergranular pores to move to the grain
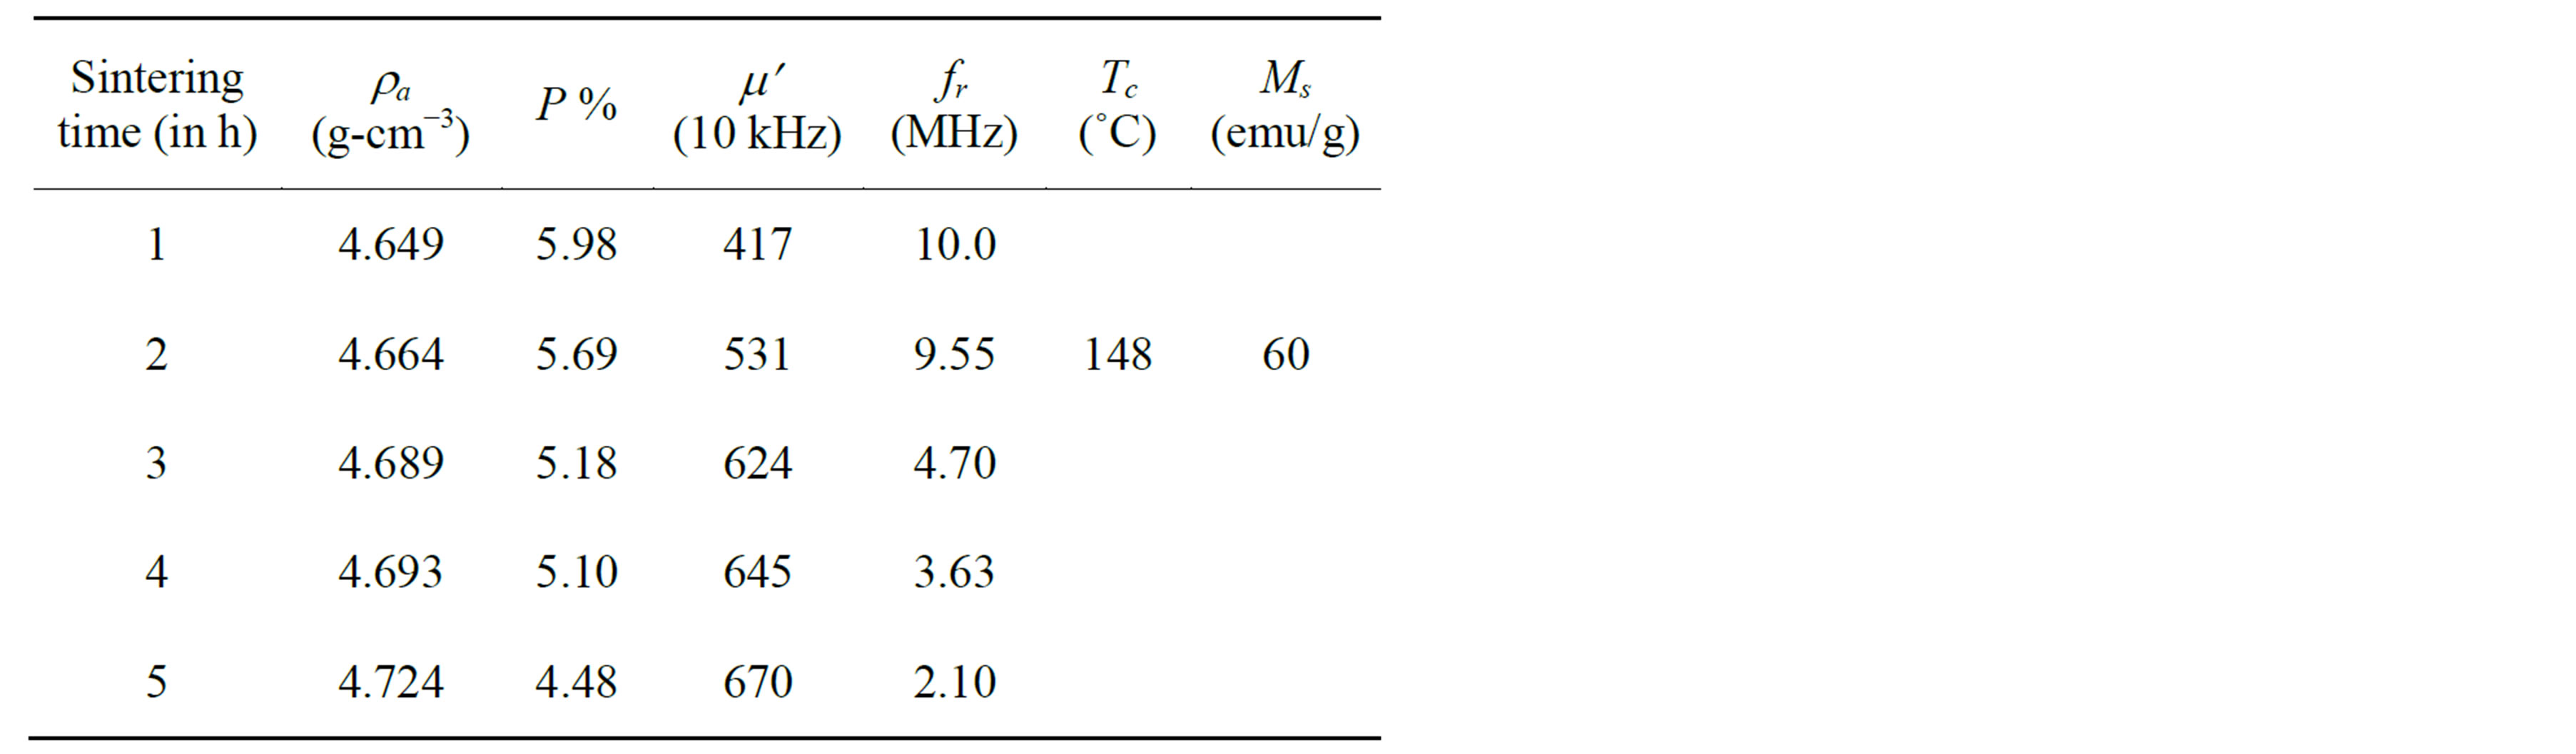
Table 1. Data for the apparent density (ra), porosity (P), initial permeability (m¢), resonance frequency (fr), Curie temperature (Tc) and saturation magnetization (Ms) of Mg0.35Cu0.20Zn0.45Fe1.94O4 ferrites sintered at 1150˚C.
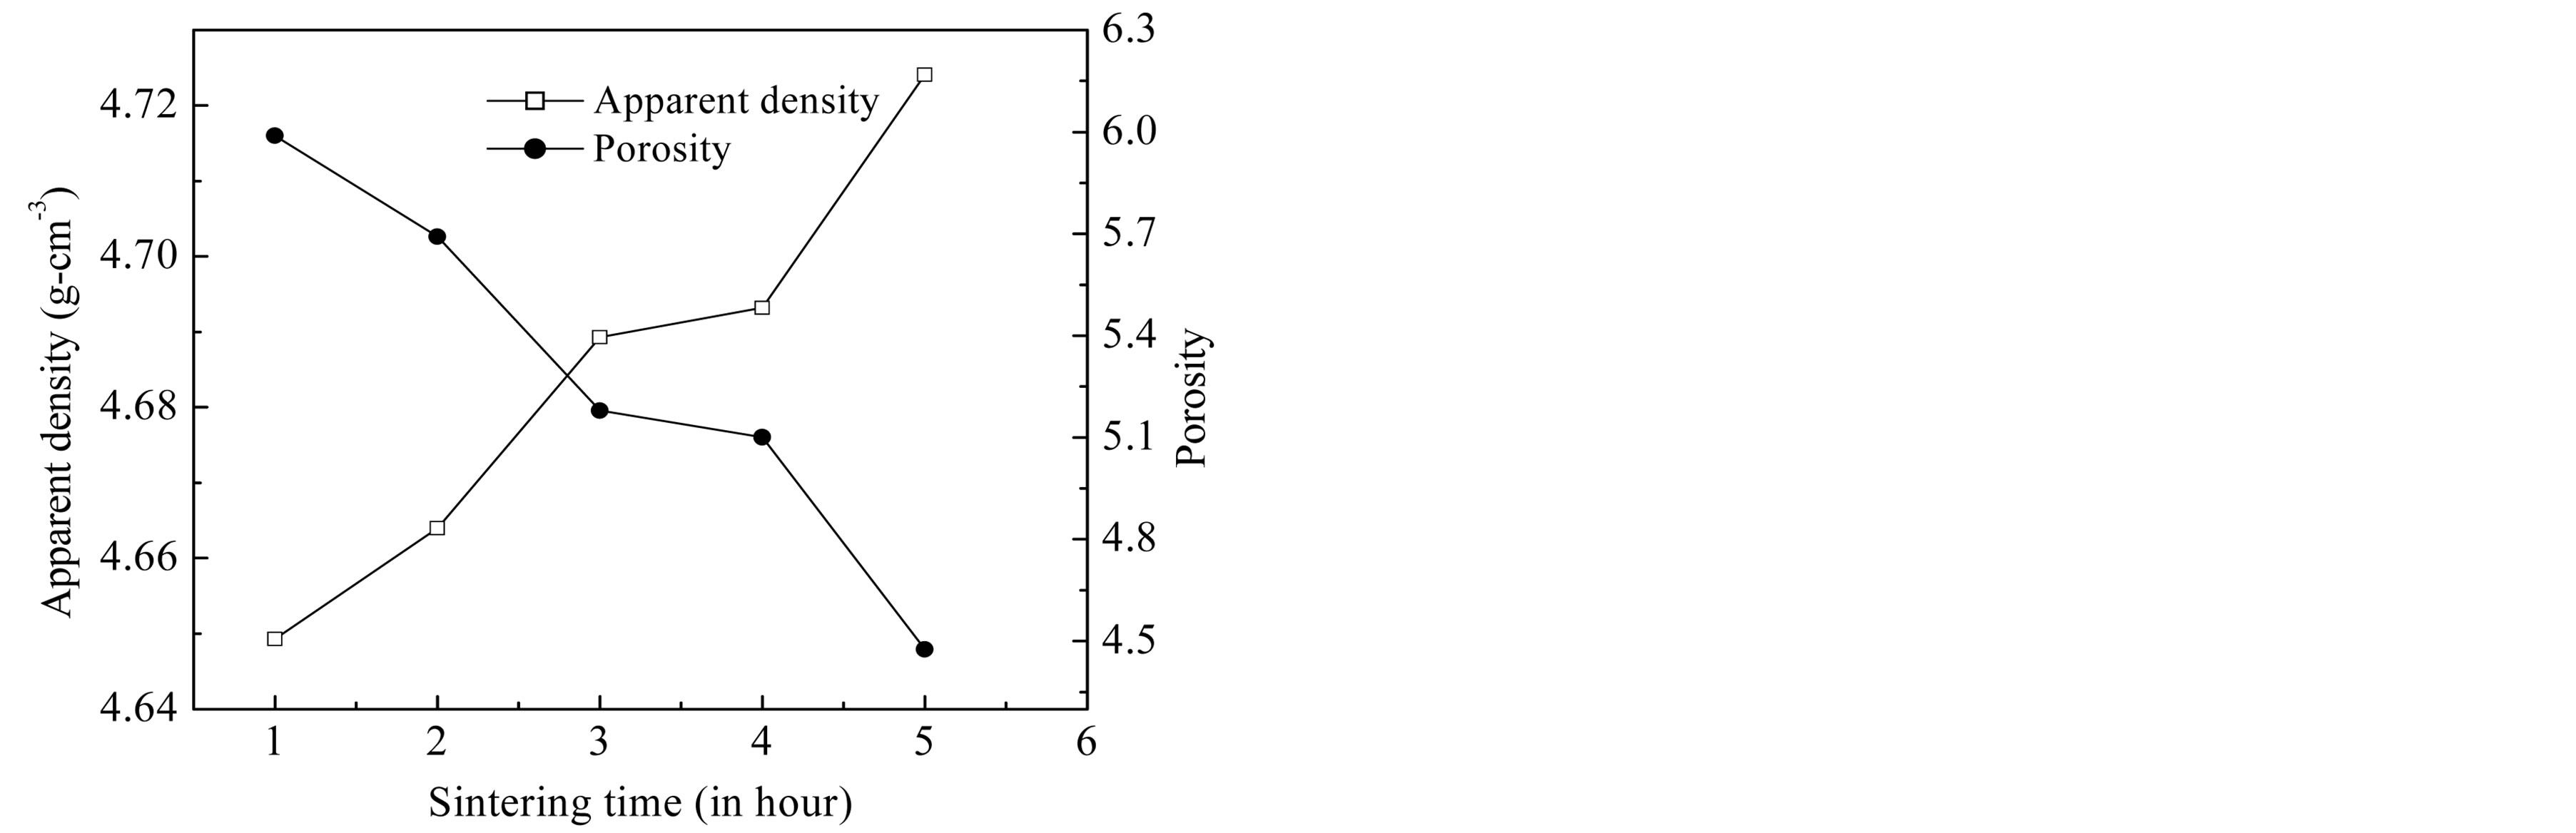
Figure 2. Variation of apparent density and porosity as a function of sintering time.
boundaries and thus results in higher density.
Figure 3 shows the SEM microstructure of Mg0.35Cu0.20Zn0.45Fe1.94O4 ferrites sintered at 1150˚C. The increase in grain size with sintering time is clearly visible. It depends upon the sintering condition; longer the sintering time greater will be the grain size due to the formation of large amount of liquid phase in the system [3]. It is seen that the sample sintered for 1 h, 2 h and 3 h show a uniform microstructure with small grains. The considerable increase in grain size with the samples sintered for t = 4 h and 5 h, giving rise to a microstructure with exaggerated grain growth. The rapid grain growth may be due to the formation of larger amount of liquid phase in the samples.
3.2. Magnetic Properties
The measurements of the initial permeability of Mg0.35Cu0.20Zn0.45Fe1.94O4 ferrite as a function of frequency are performed and the values at 100 kHz are presented in Table 2. The complete permeability spectra of the polycrystalline Mg-Cu-Zn ferrites are shown in Figures 4 and 5. The complex permeability is given by m* = m¢ − imʺ where, m¢ is the real permeability (in phase) and m¢¢ the imaginary permeability (90˚ out of phase). The real part of the permeability m¢ shows flat profile from 1 kHz to 5 MHz indicating good low frequency stability for the samples for ts = 1 h and 2 h and the dispersion occurs slightly above 5 MHz frequency due to relaxation of m¢. For higher sintering time ts ³ 3 h, relaxation takes place at lower frequency within 1 MHz but having higher permeability. The frequency stability of initial permeability of sintered Mg-Cu-Zn ferrite moves gradually from high to low frequency with increasing sintering time. In general, it is observed that the initial permeability remains almost constant up to certain lower range of frequency after which the initial permeability increases to a maximum value and then decreases rapidly to a very low value. This phenomenon, known as dispersion of initial
 (a)
(a)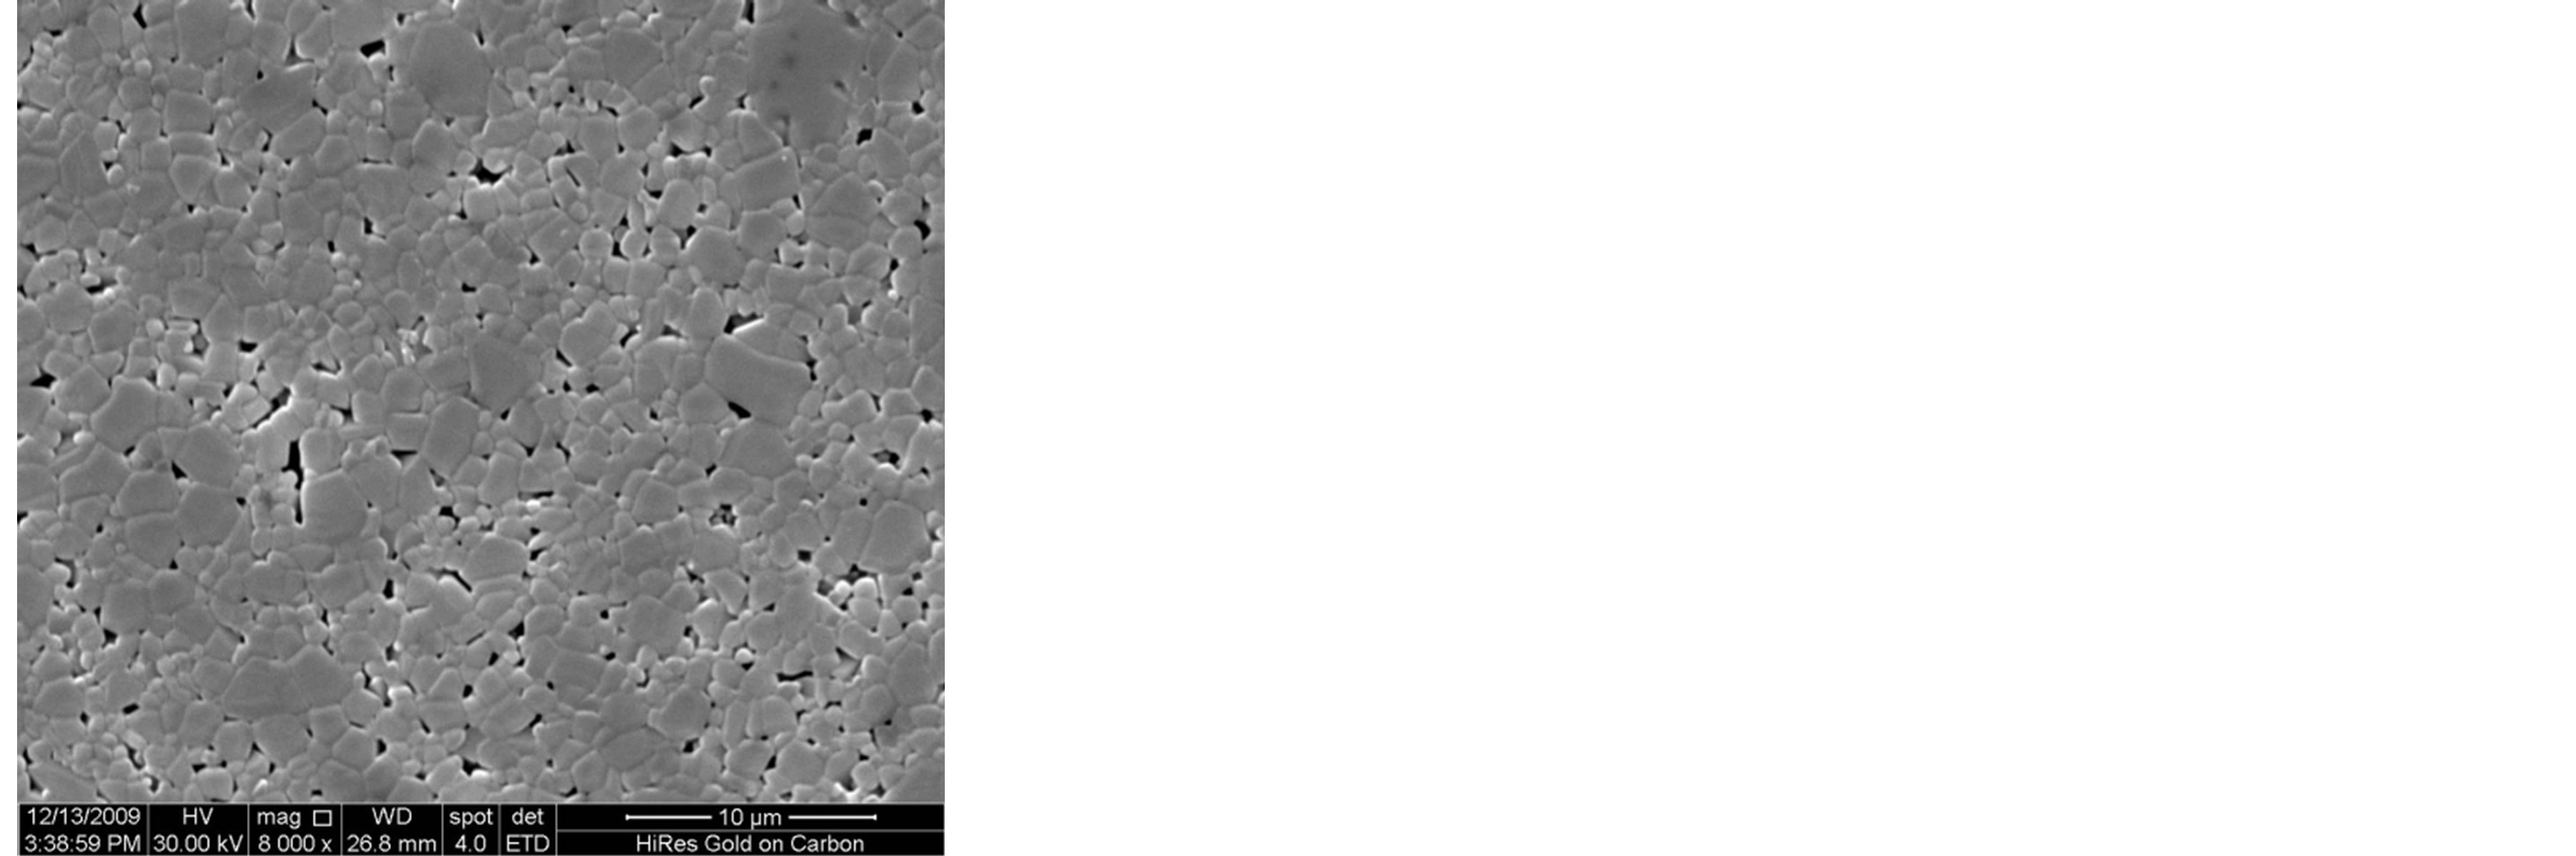 (b)
(b)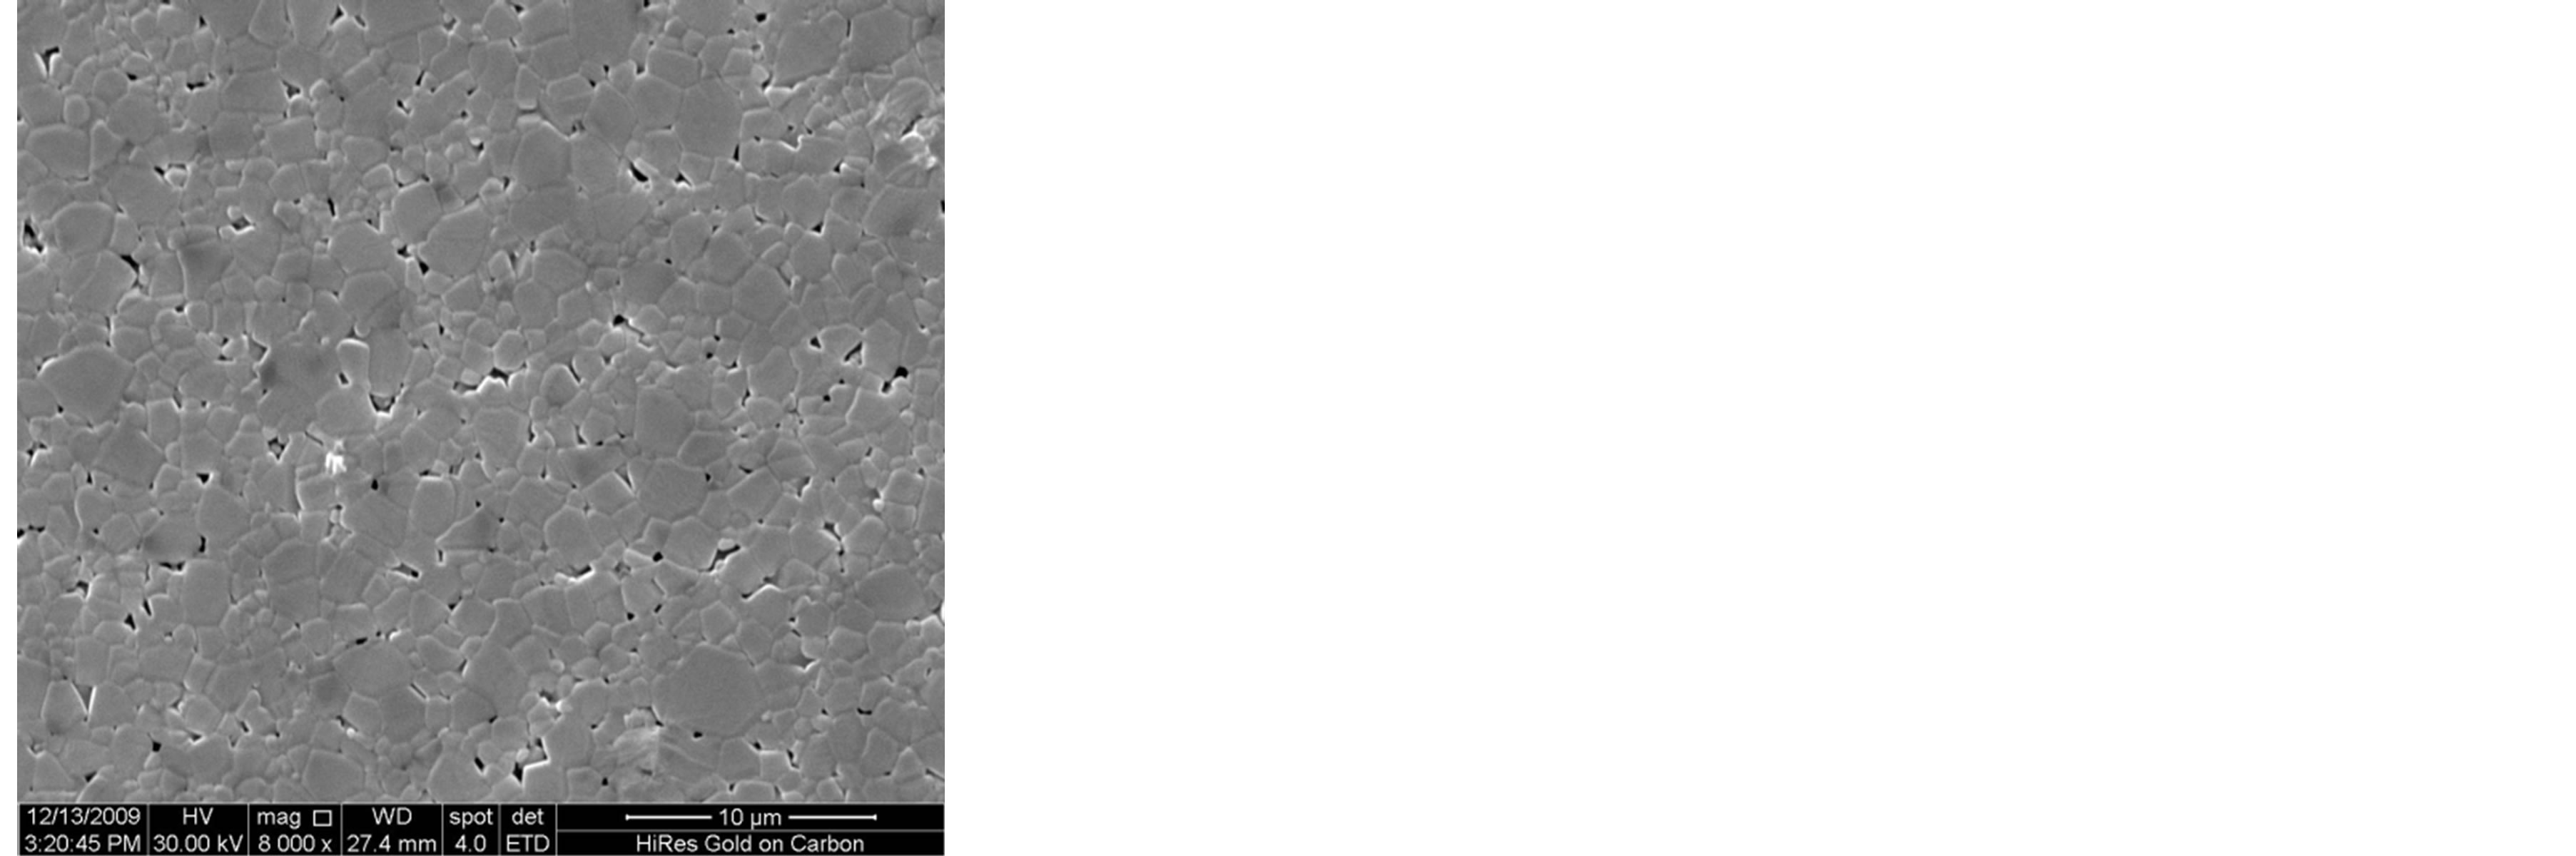 (c)
(c)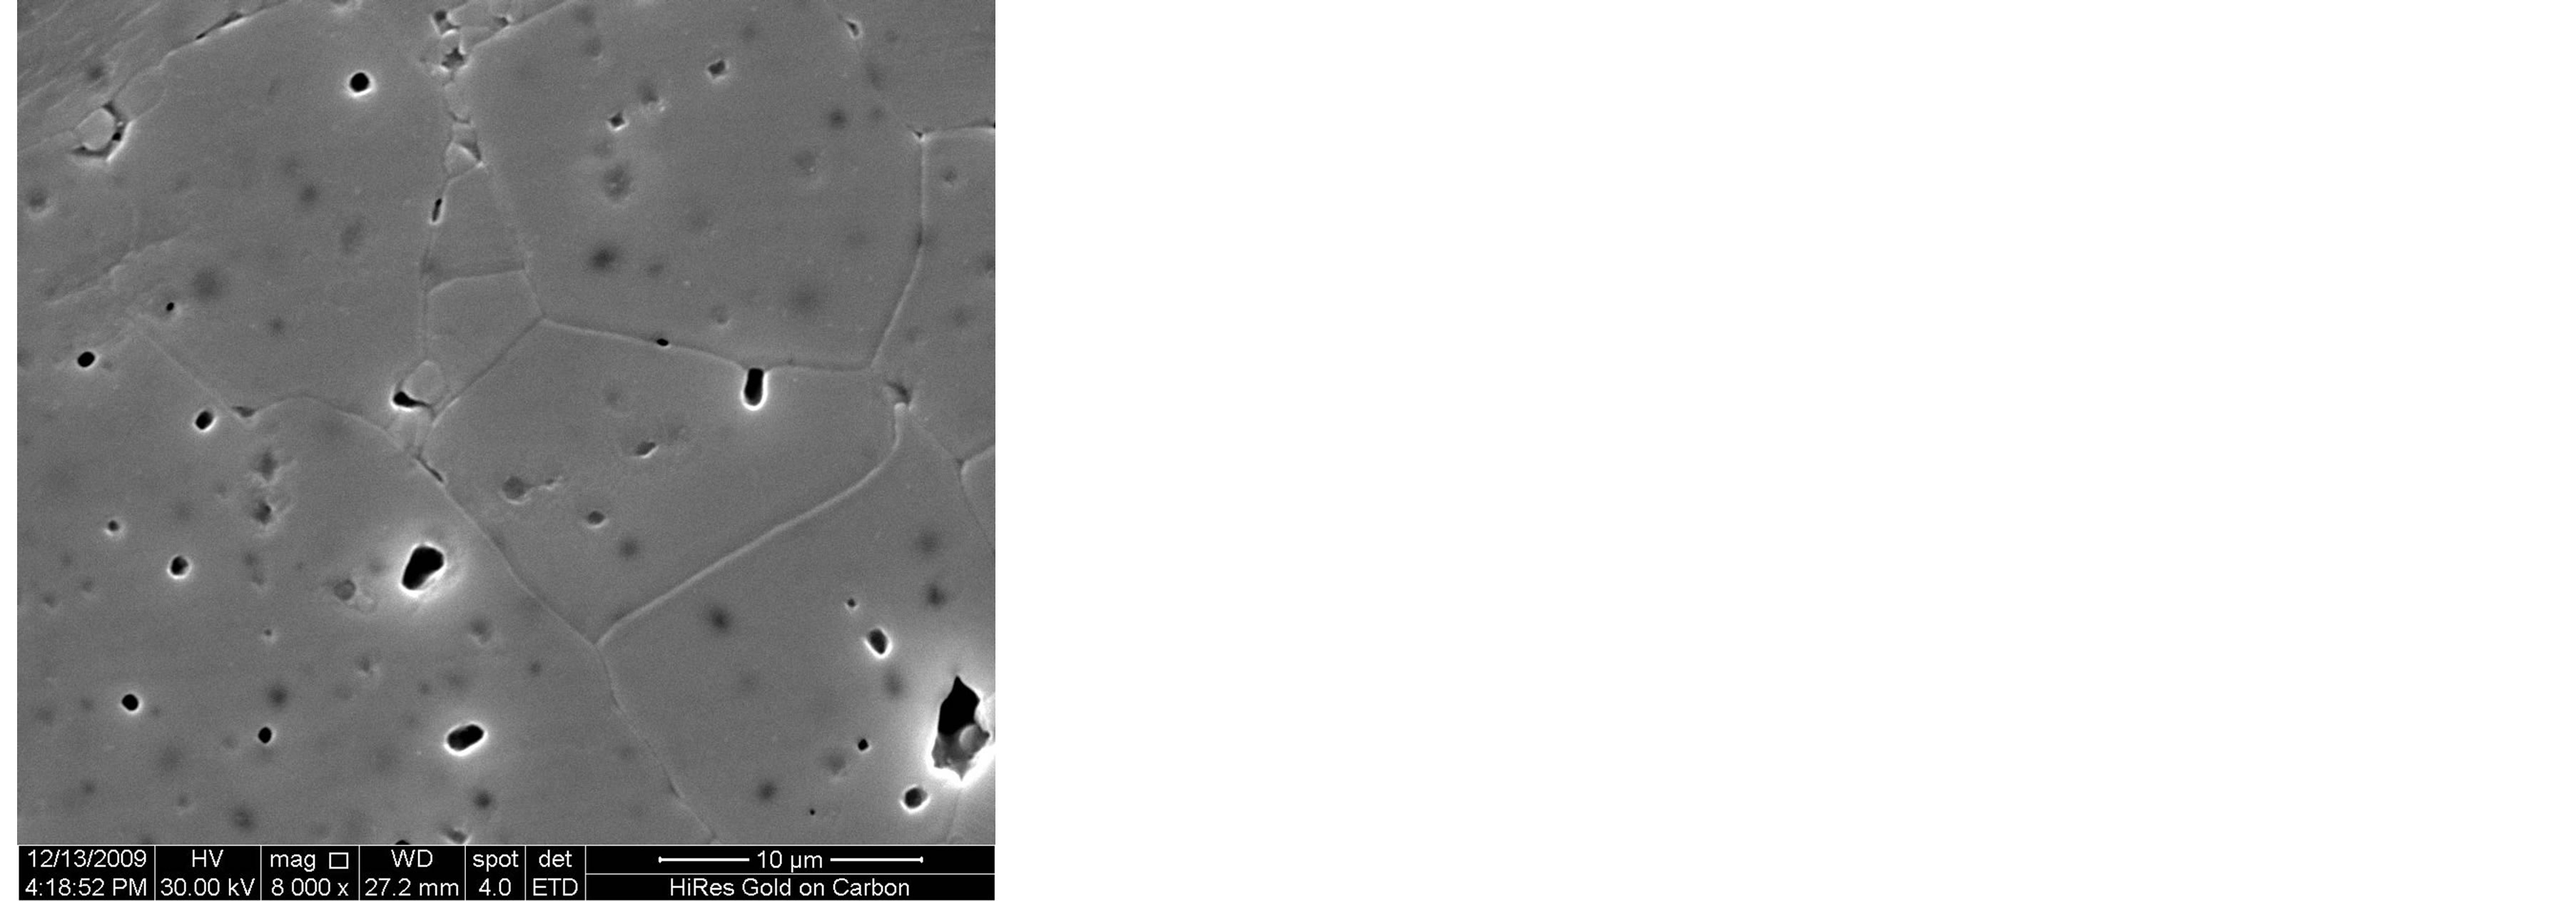 (d)
(d)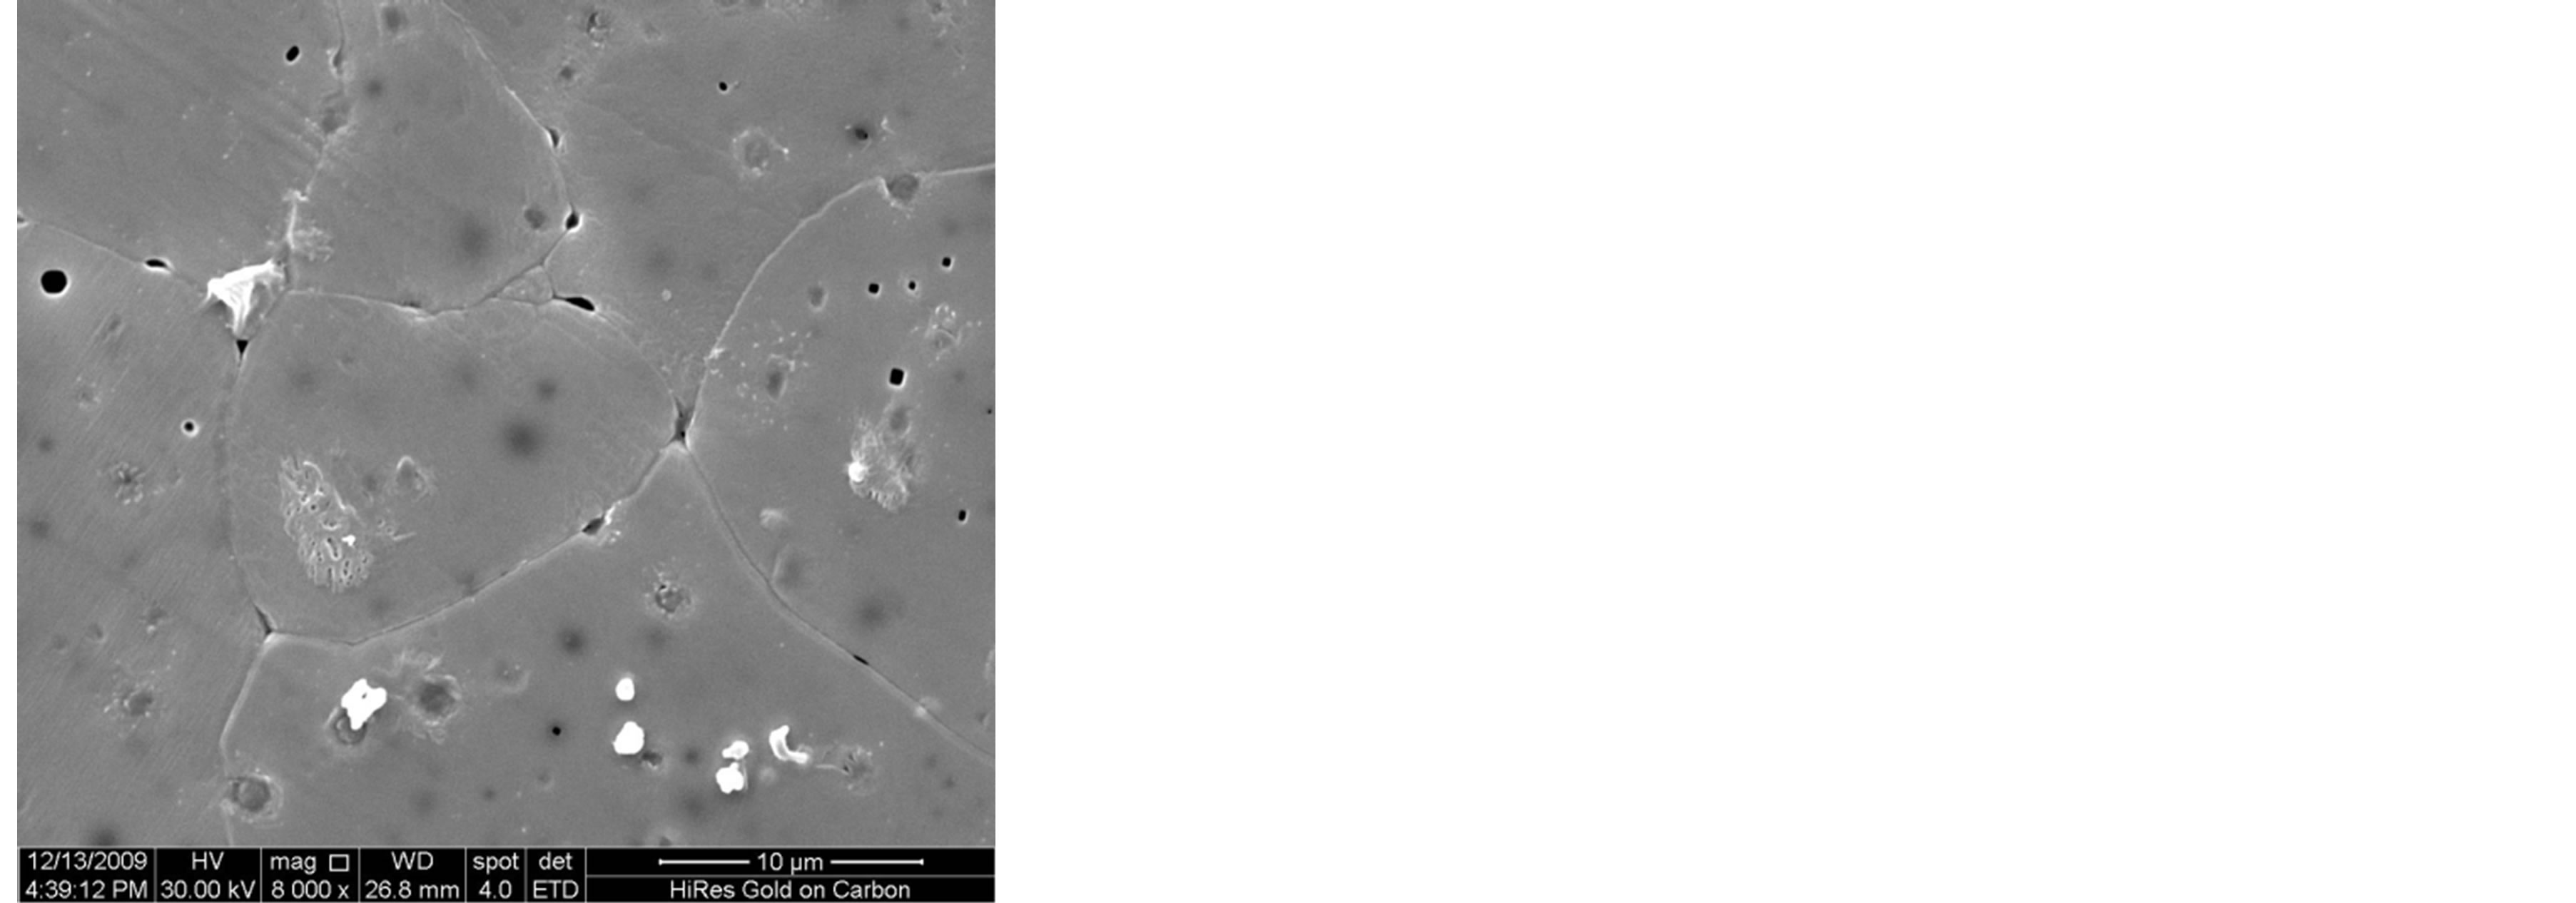 (e)
(e)
Figure 3. SEM microstructure of Mg0.35Zn0.45Cu0.20Fe1.94O4 ferrites sintered at 1150˚C for (a) 1 h (b) 2 h (c) 3 h (d) 4 h and (e) 5 h, respectively.
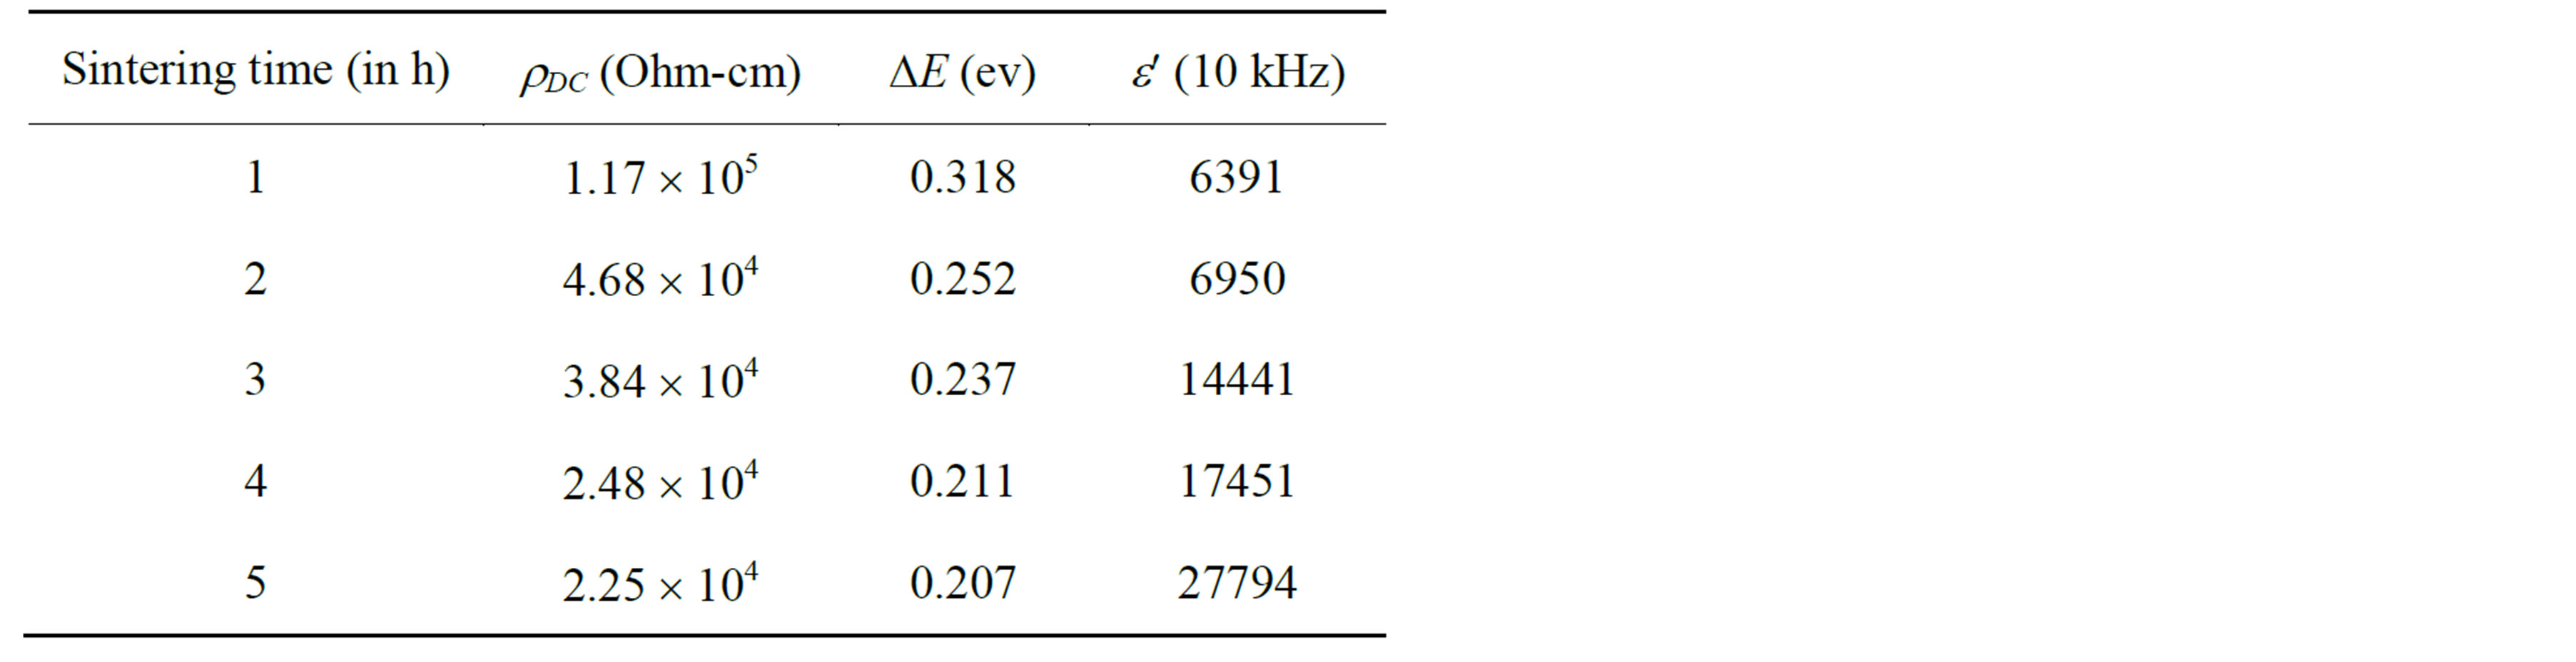
Table 2. Data for room temperature resistivity (rDC), activation energy (DE) and dielectric constant (e¢) of Mg0.35Cu0.20Zn0.45Fe1.94O4 ferrites sintered at 1150˚C.
permeability, is attributed to either domain wall displacements or domain rotation or both of these contributions [12]. It is known that the permeability of polycrystalline ferrite can be described as the superposition of domain wall motion and spin rotation components [5,13]. At the low frequency range, domain wall motion plays a predominant role in the magnetizing process and loss mechanism. The high permeability values at low frequencies show the dominant role played by domain wall motion. Increasing the frequency, the wall motion is damped
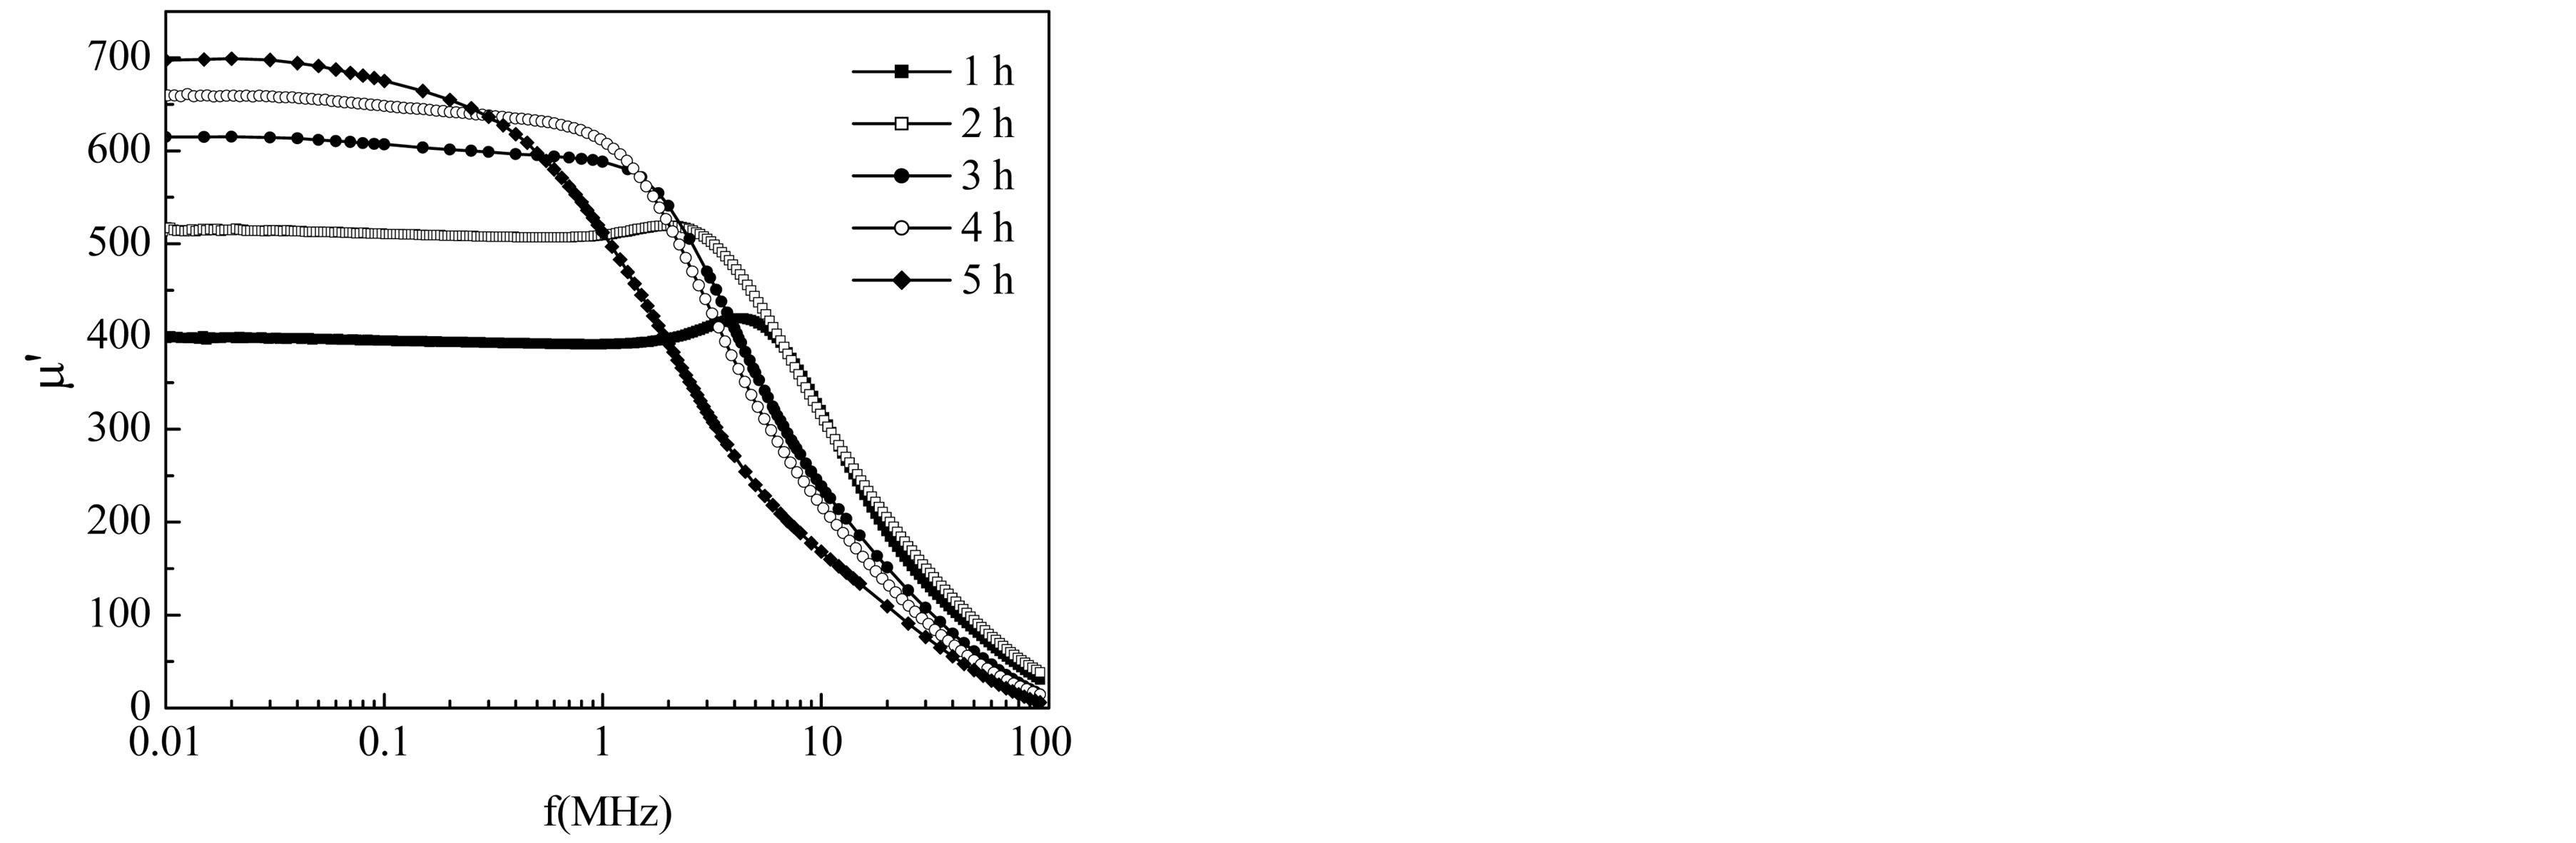
Figure 4. Frequency dependence of real permeability of Mg0.35Cu0.20Zn0.45Fe1.94O4 ferrite sintered at 1150˚C for different sintering time.
and becomes out of phase with the excitation field.
The imaginary component mʺ (as in Figure 5) first rises slowly and then increases quite abruptly making a peak at a certain frequency (called resonance frequency, fr), where the real component m¢ is falling sharply. This phenomenon is known as ferrimagnetic resonance [14]. At low frequencies, a ferrite inductor is a low loss con-
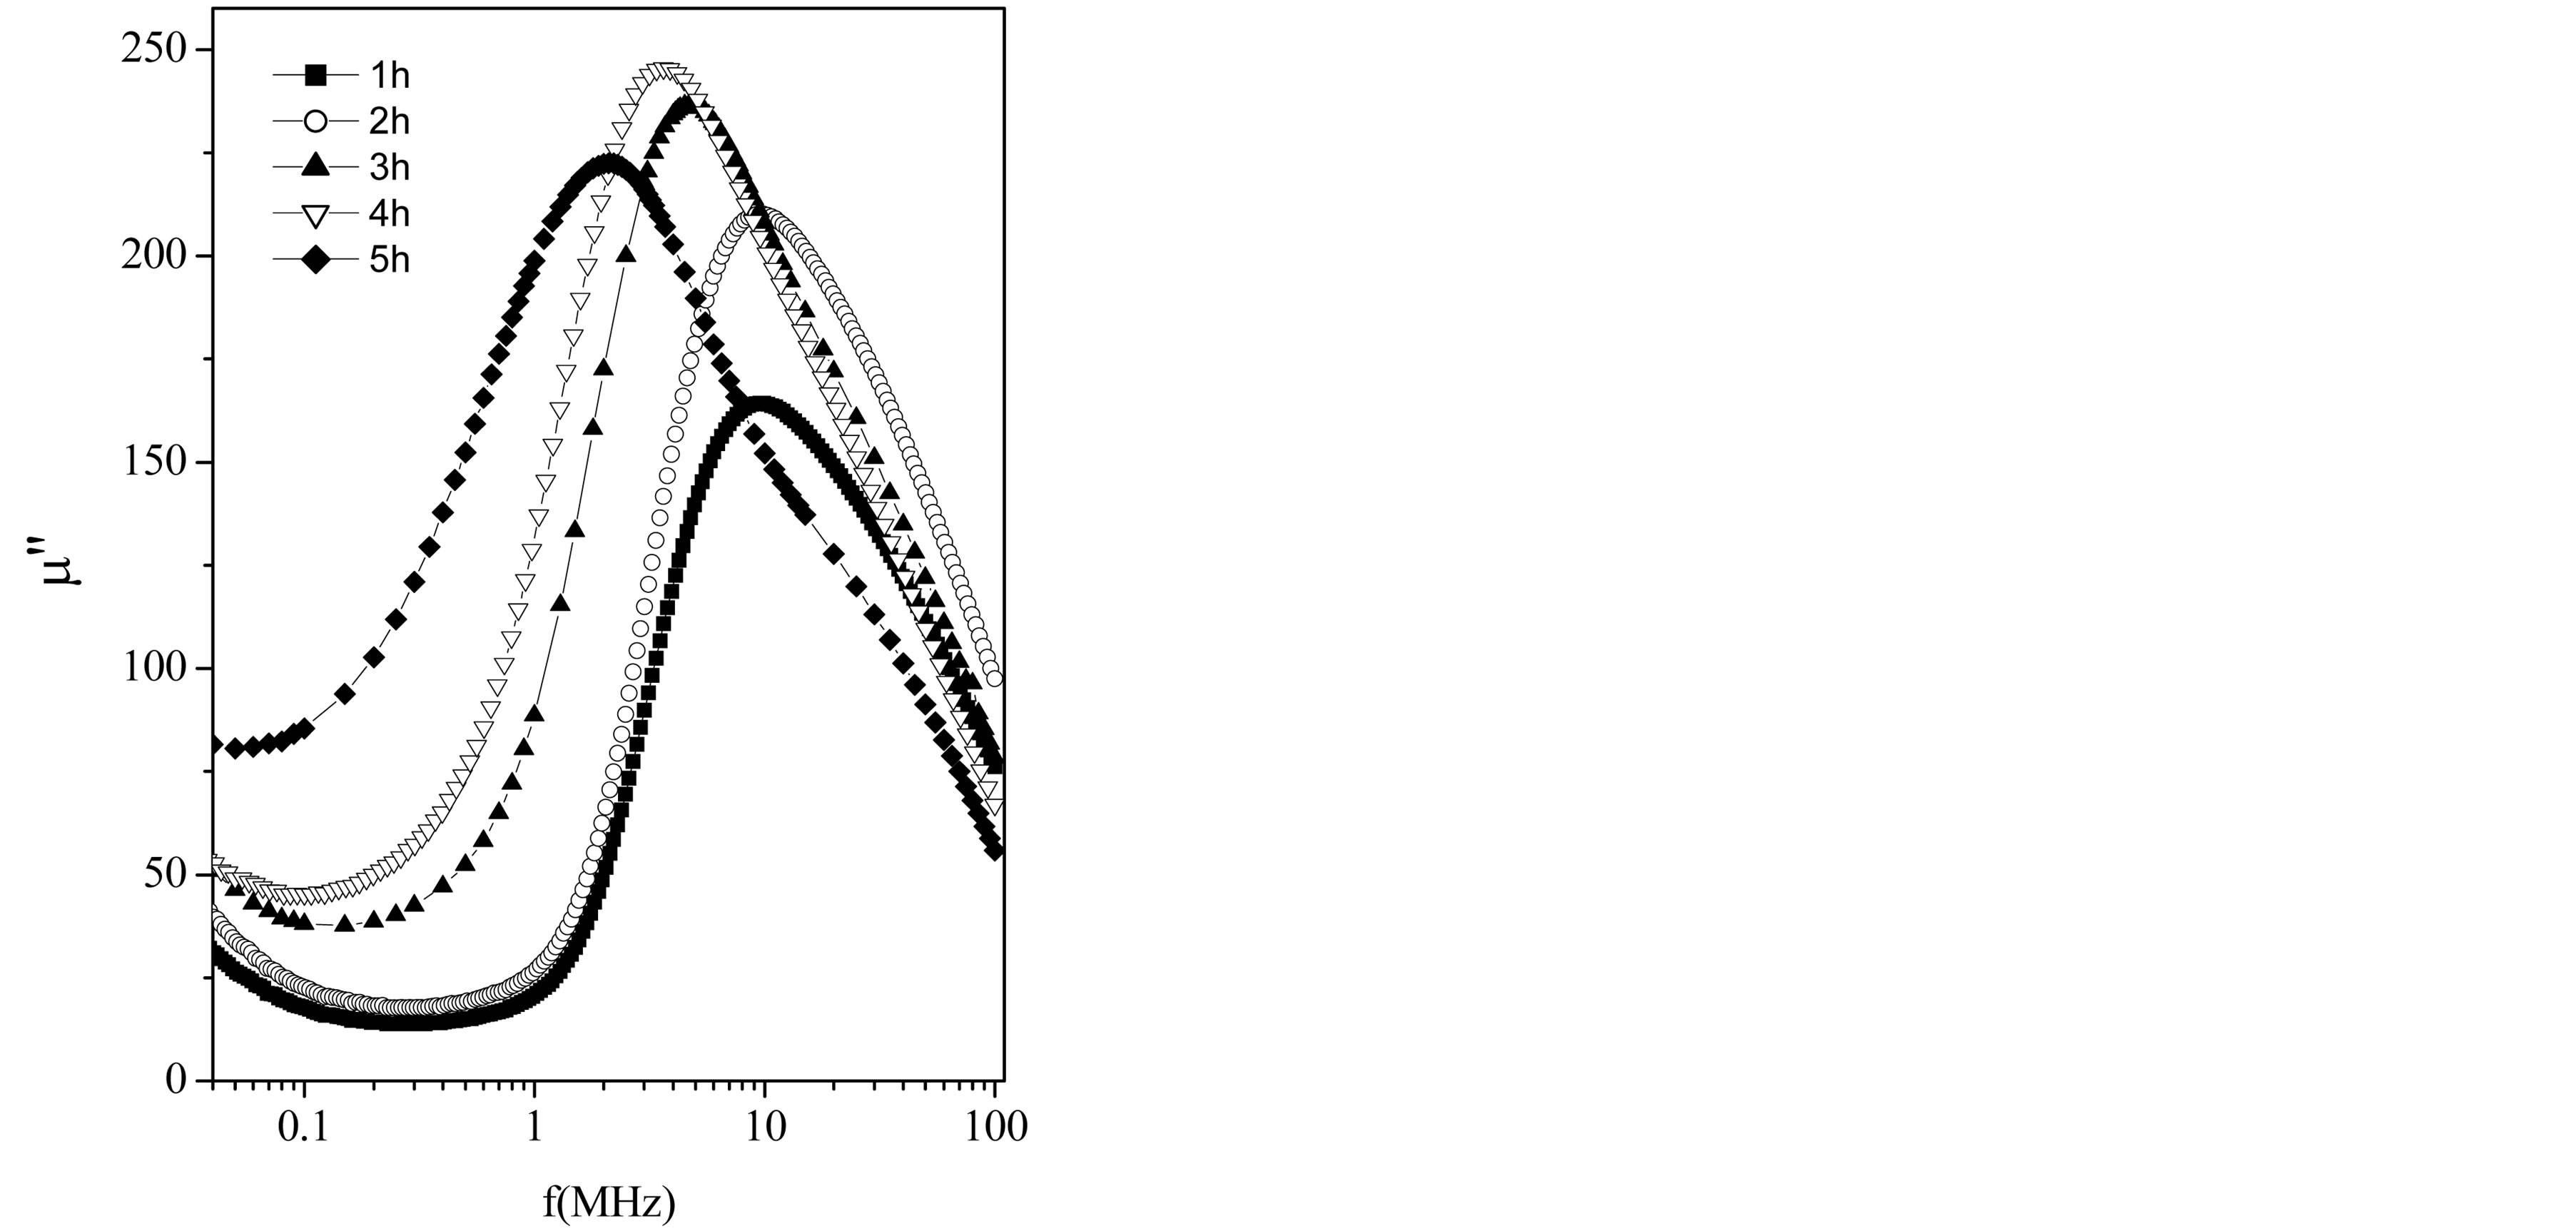
Figure 5. Frequency dependence of imaginary part of the permeability of the samples.
stant self-inductor where m¢ is highest and the core is mostly inductive, rejecting the electromagnetic interference (EMI) signal to the source. At high frequencies where the mʺ parameters becomes more significant, the inductors show high impedance and become resistive and dissipate interfering signals rather than reflecting these to the source. The resonance frequency peaks are the results of the absorption of energy due to matching of the oscillation frequency of the magnetic dipoles and the applied frequency. At the resonance, maximum energy is transferred from the applied field to the lattice resulting in the rapid increase in tand .
.
The resonance frequency along with the permeability of the samples is listed in Table 1. Resonance frequency (fr) was determined from the maximum of imaginary permeability of the ferrites. It is observed from Figure 5 and Table 1 that fr decreases with the increase in sintering time. It is seen that the higher the permeability of the material the lower the frequency of the onset of ferrimagnetic resonance. This is because the sample with large grain size had worse frequency stability due to the low-frequency resonance induced by big grain size. This really confirms with Snoek’s relation [15] which is given as: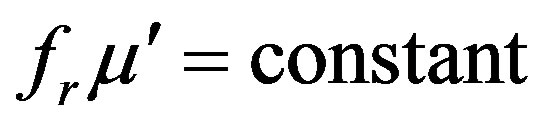 . This means that there is an effective limit to the product of resonance frequency and permeability. So that high frequency and high permeability are mutually incompatible. The onset of the resonance frequency determines the upper limit of the operational frequency of any device. Moreover, the permeability values and hence the resonance frequency depend on the amount and type of dopantions, and the sintering condition of these samples [5,16]. In a typical Mg-ferrite, the resonance frequency was found to be at 50 MHz [17].
It is observed from Figure 6 and Table 1 that m¢ increases with the increase in sintering time. This increase of m¢ with the increase in sintering time is attributed to the contribution of domain wall motion, which becomes more significant as the sintered density and grain size of the ferrite increases. Generally, a higher initial permeability is achieved through the control of both the density and microstructure, which depends on the sintering conditions. According to Globus model [18] the contribution to initial permeability is mainly due to reversible domain wall motion. Brooks et al. [19] suggested that domain wall motion is affected by the grain size and sintering density. Thus, the domain wall motion is greatly affected by the grain size and enhanced with the increase of grain size. This is because bigger grains tend to contain more number of larger domain walls and initial permeability being a result of the easy reversal of domain wall displacement in the direction of the applied magnetic field. An increase in the density of ferrites not only results in the reduction of demagnetizing field, due to the presence of pores, but also increases the spin rotational contribution, which in turn increases the permeability [20]. Increase in grain size results in an increase in the number of domain walls in each grain.
Figure 7 shows the thermal variation of initial permeability (m¢) for the toroid shaped ferrite samples. Since the initial permeability is directly related to the magnetization and to the ionic structure, then the thermal spectra of permeability can be taken as a test of the formation and homogeneity of the ionic structure of the samples. In general, it was found that the initial permeability increases with increase in temperature, while it falls abruptly close to the Curie point. It is seen from Figure 7 that m¢ gradually increases with temperature reaches a maximum and then drops sharply to minimum value near the Curie temperature. The sharpness of the permeability drop at the Curie point can be used as a measure of the degree of compositional homogeneity according to Globus [21]. The present ferrites show good homogeneity as shown in Figure 7, where an abrupt drop in permeability occurs within the temperature range less than 5˚C near Curie point. The variation of m¢ with temperature can be expressed as follows: The anisotropy constant (K1) and saturation magnetization (Ms) usually decreases with increase in temperature, due to thermal agitation, which disturbs the alignment of magnetic moments. But, decrease of K1 with temperature is much faster than the decrease of Ms. When the anisotropy constant reaches to zero, m¢ attains its maximum value and then drops off to minimum value near the Curie point. The permeability of polycrystalline ferrites is given by according to the equation [22]: 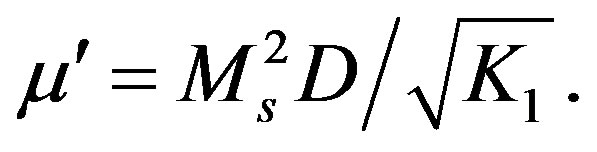 m¢ must show a maximum at temperature at which K1 vanishes, where D is the diameter of the grain.
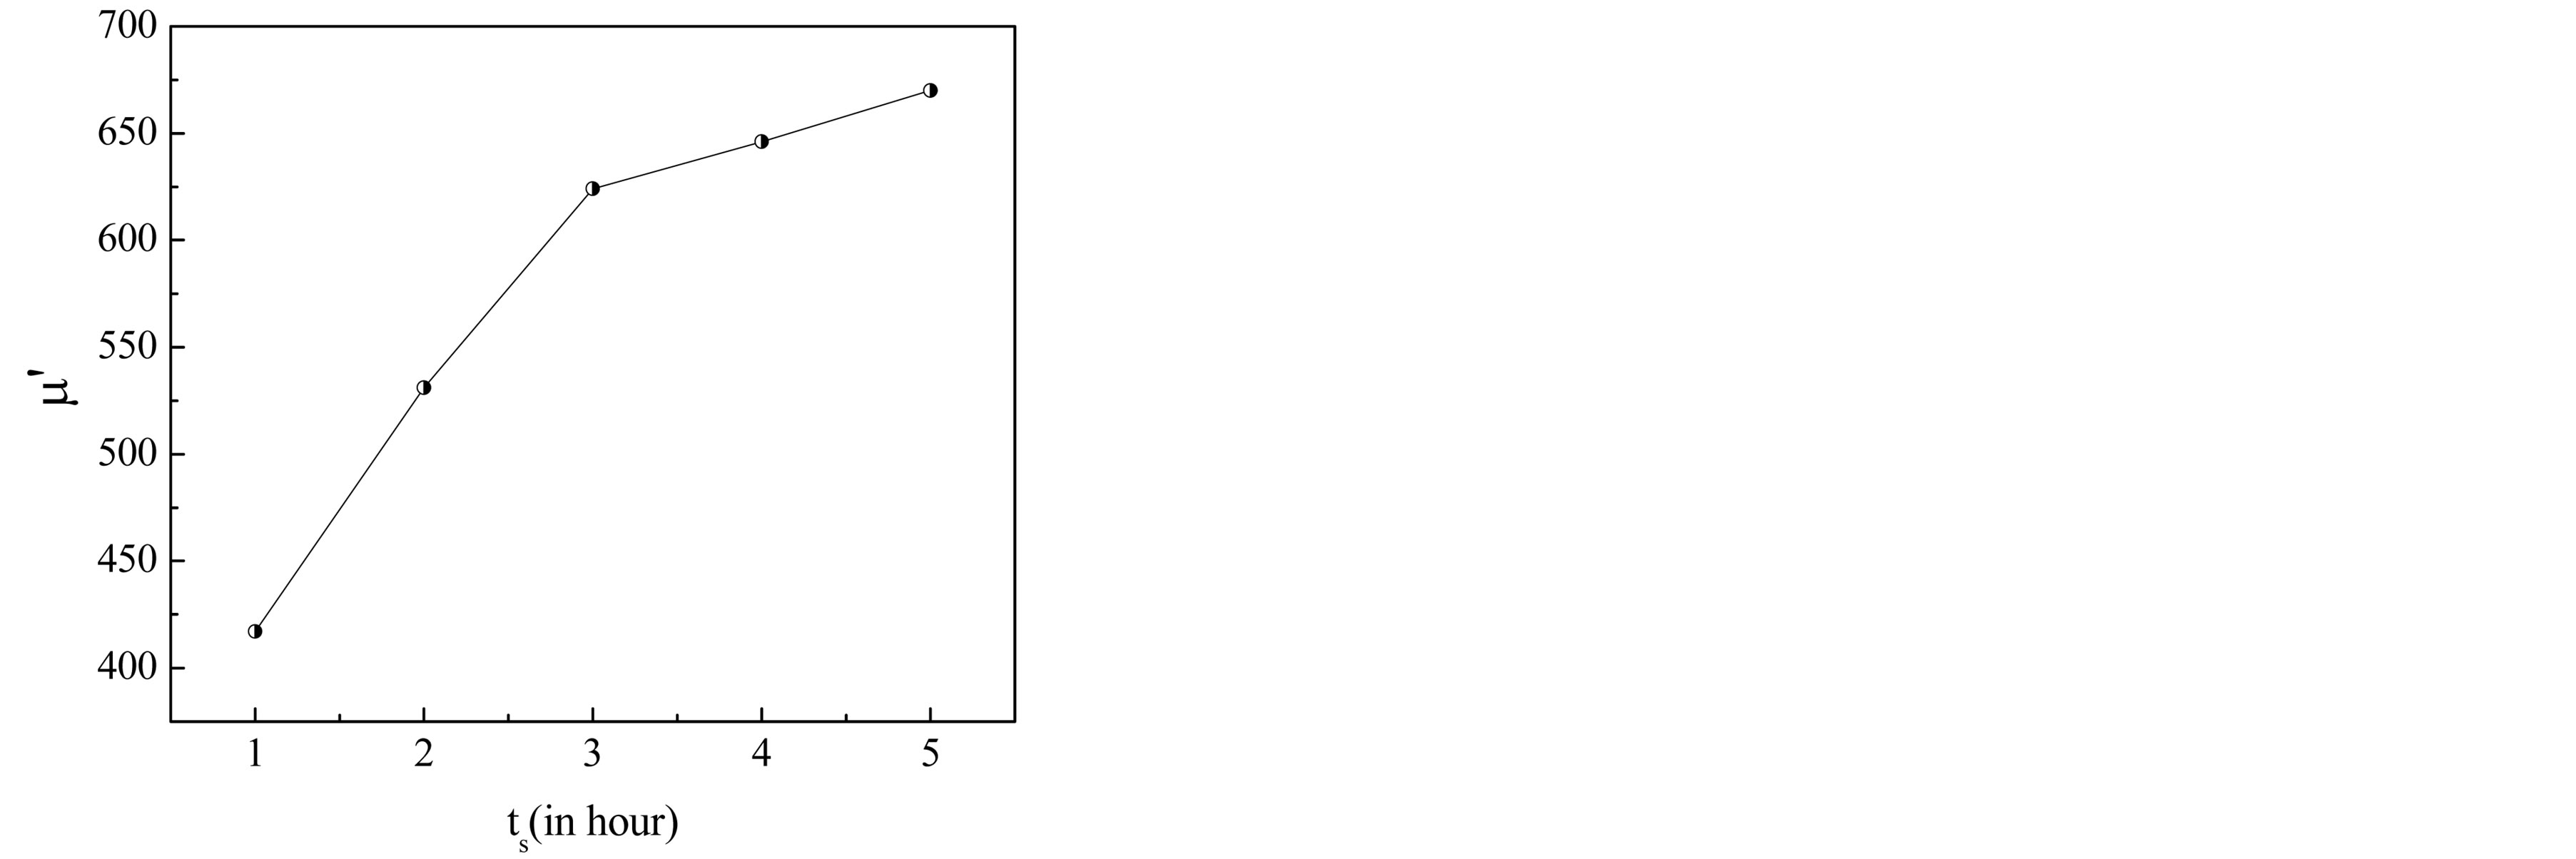
Figure 6. Variation of initial permeability as a function of sintering time ts.
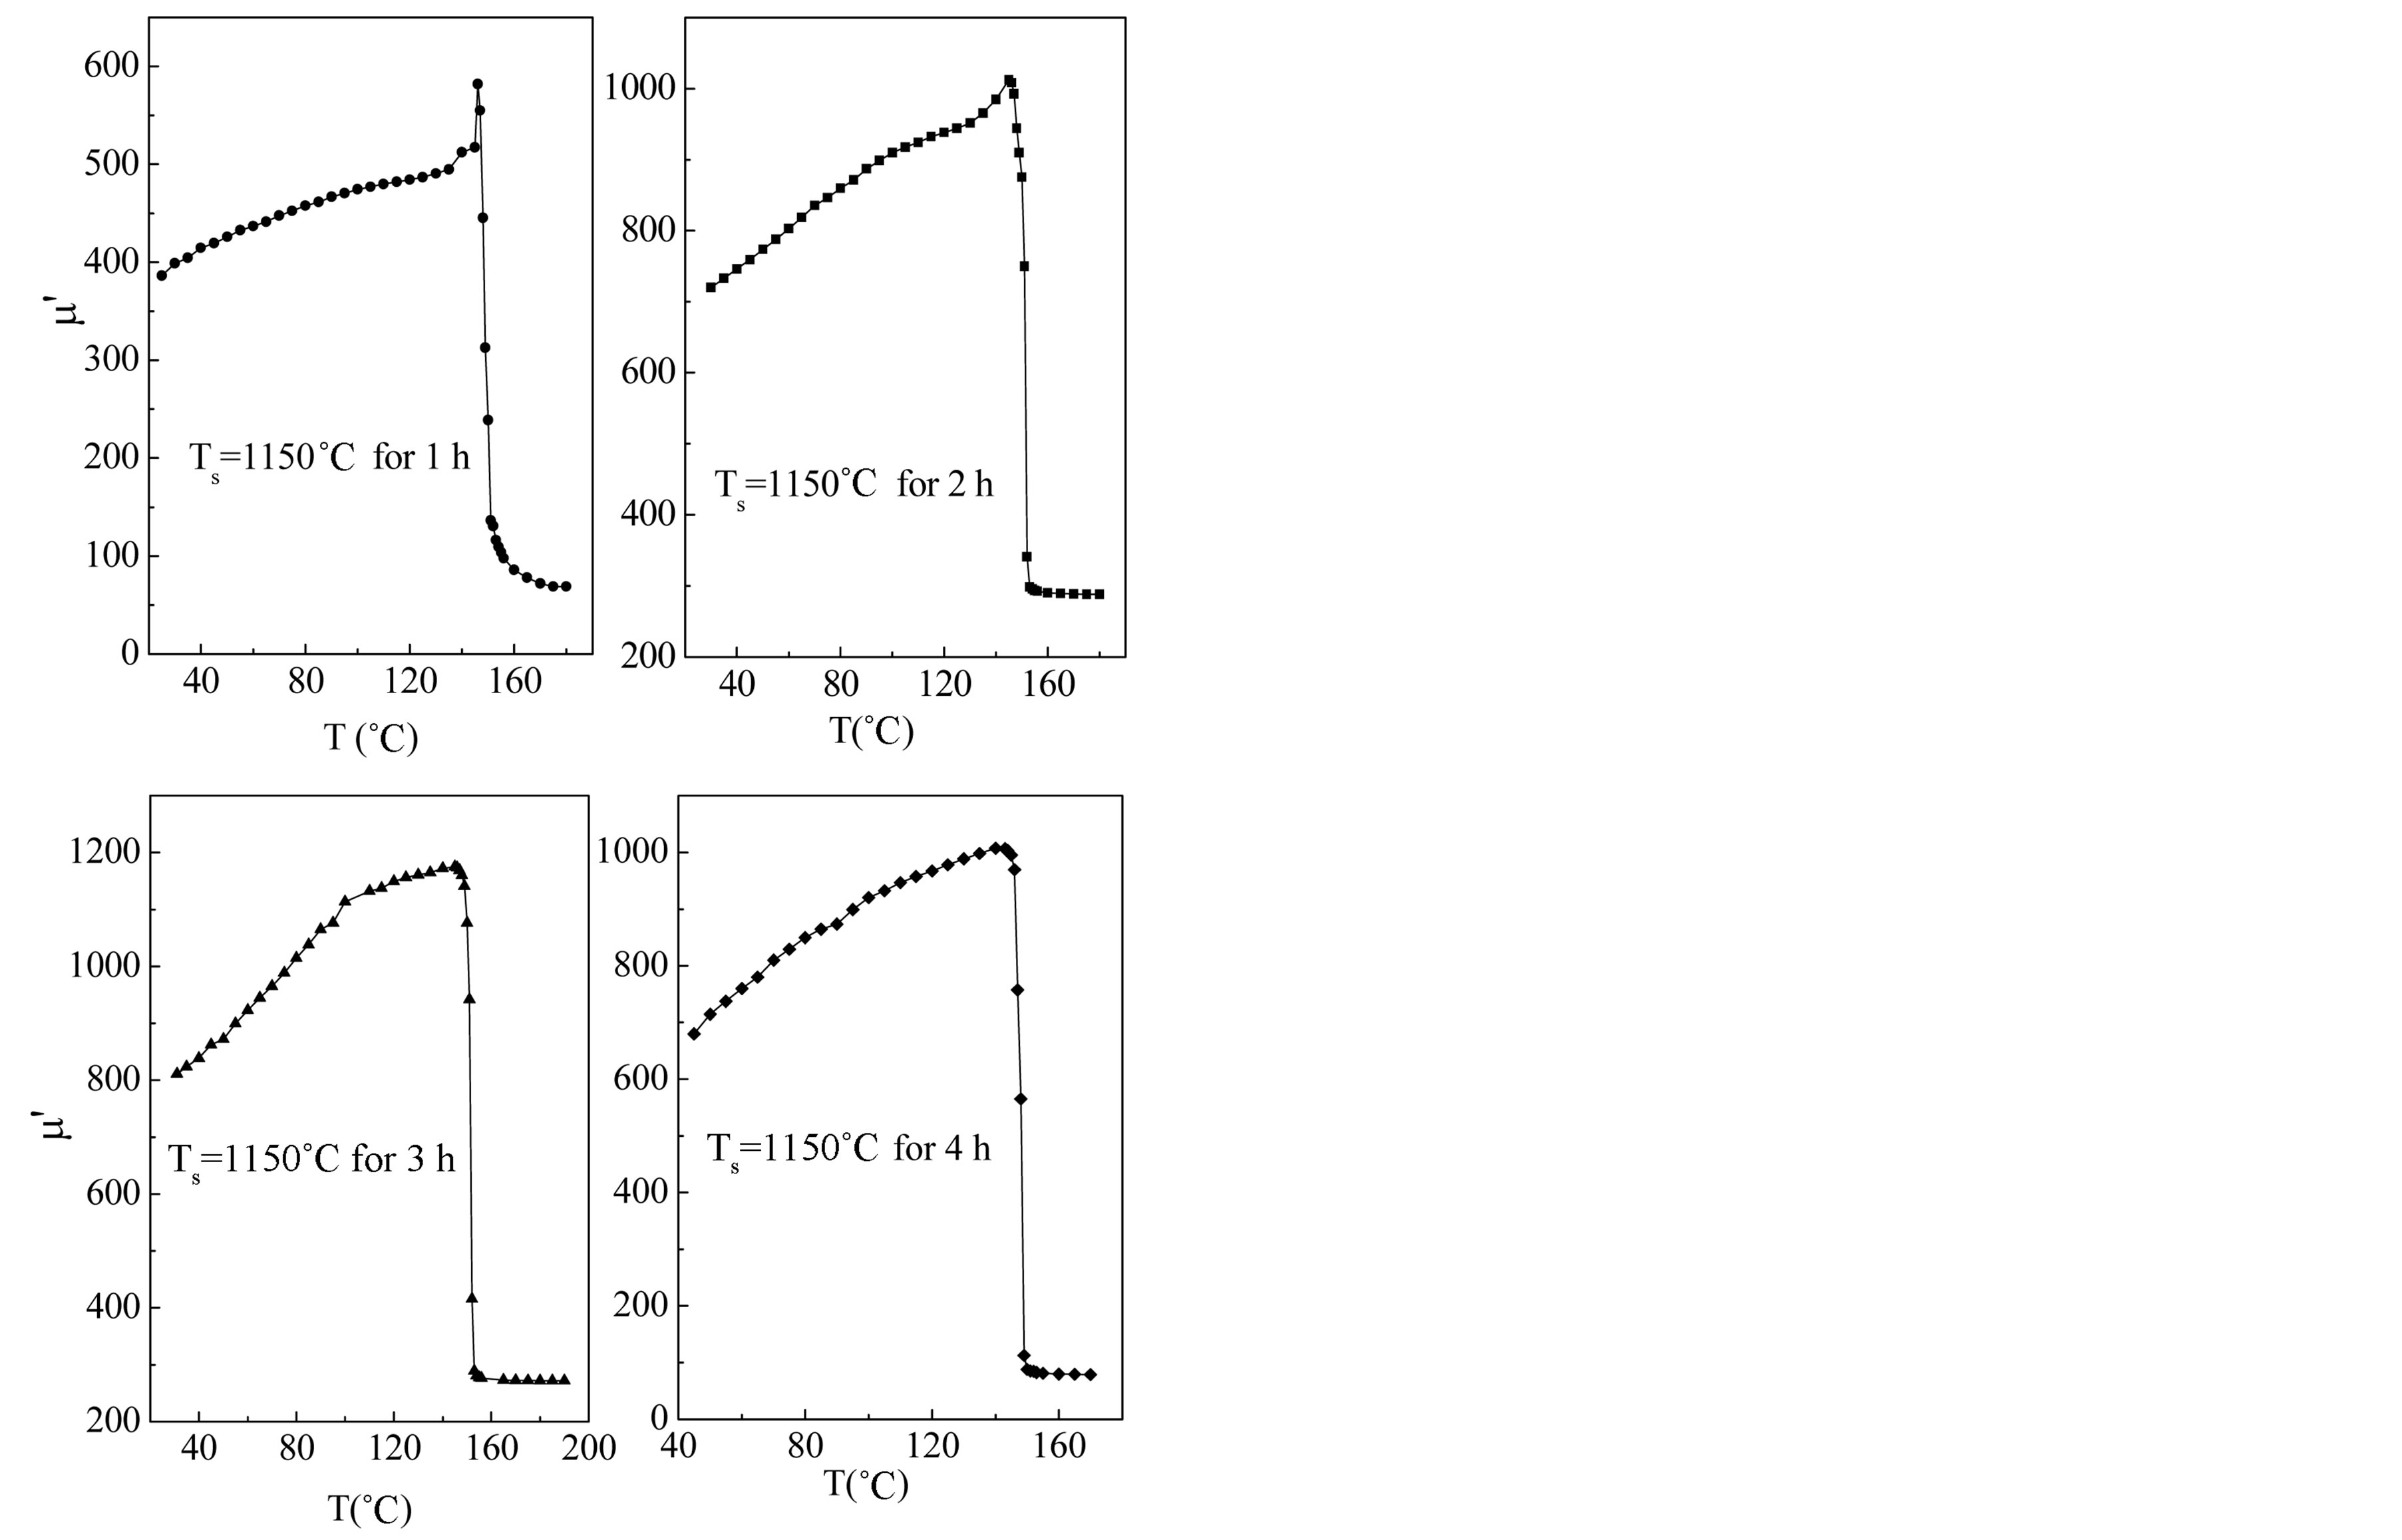
Figure 7. Variation of real permeability with temperature sintered at 1150˚C for different sintering time.
Curie temperature of a ferrite is a temperature at which the ferrimagnetic material becomes paramagnetic. Curie temperature gives an idea of the amount of energy takes to break up the long-range ordering in the material. Curie temperatures, Tc of the studied ferrite system has been determined from the m¢-T curves. The Curie temperature mainly depends upon the strength of A-B exchange interaction. The value of Tc is found to 148˚C (in Table 1) which is consistent with the reported value of Mg-Cu-Zn ferrites [22].
Figure 8 represents the magnetization curve as a function of magnetic field of Mg0.35Cu0.20Zn0.45Fe1.94O4 ferrite
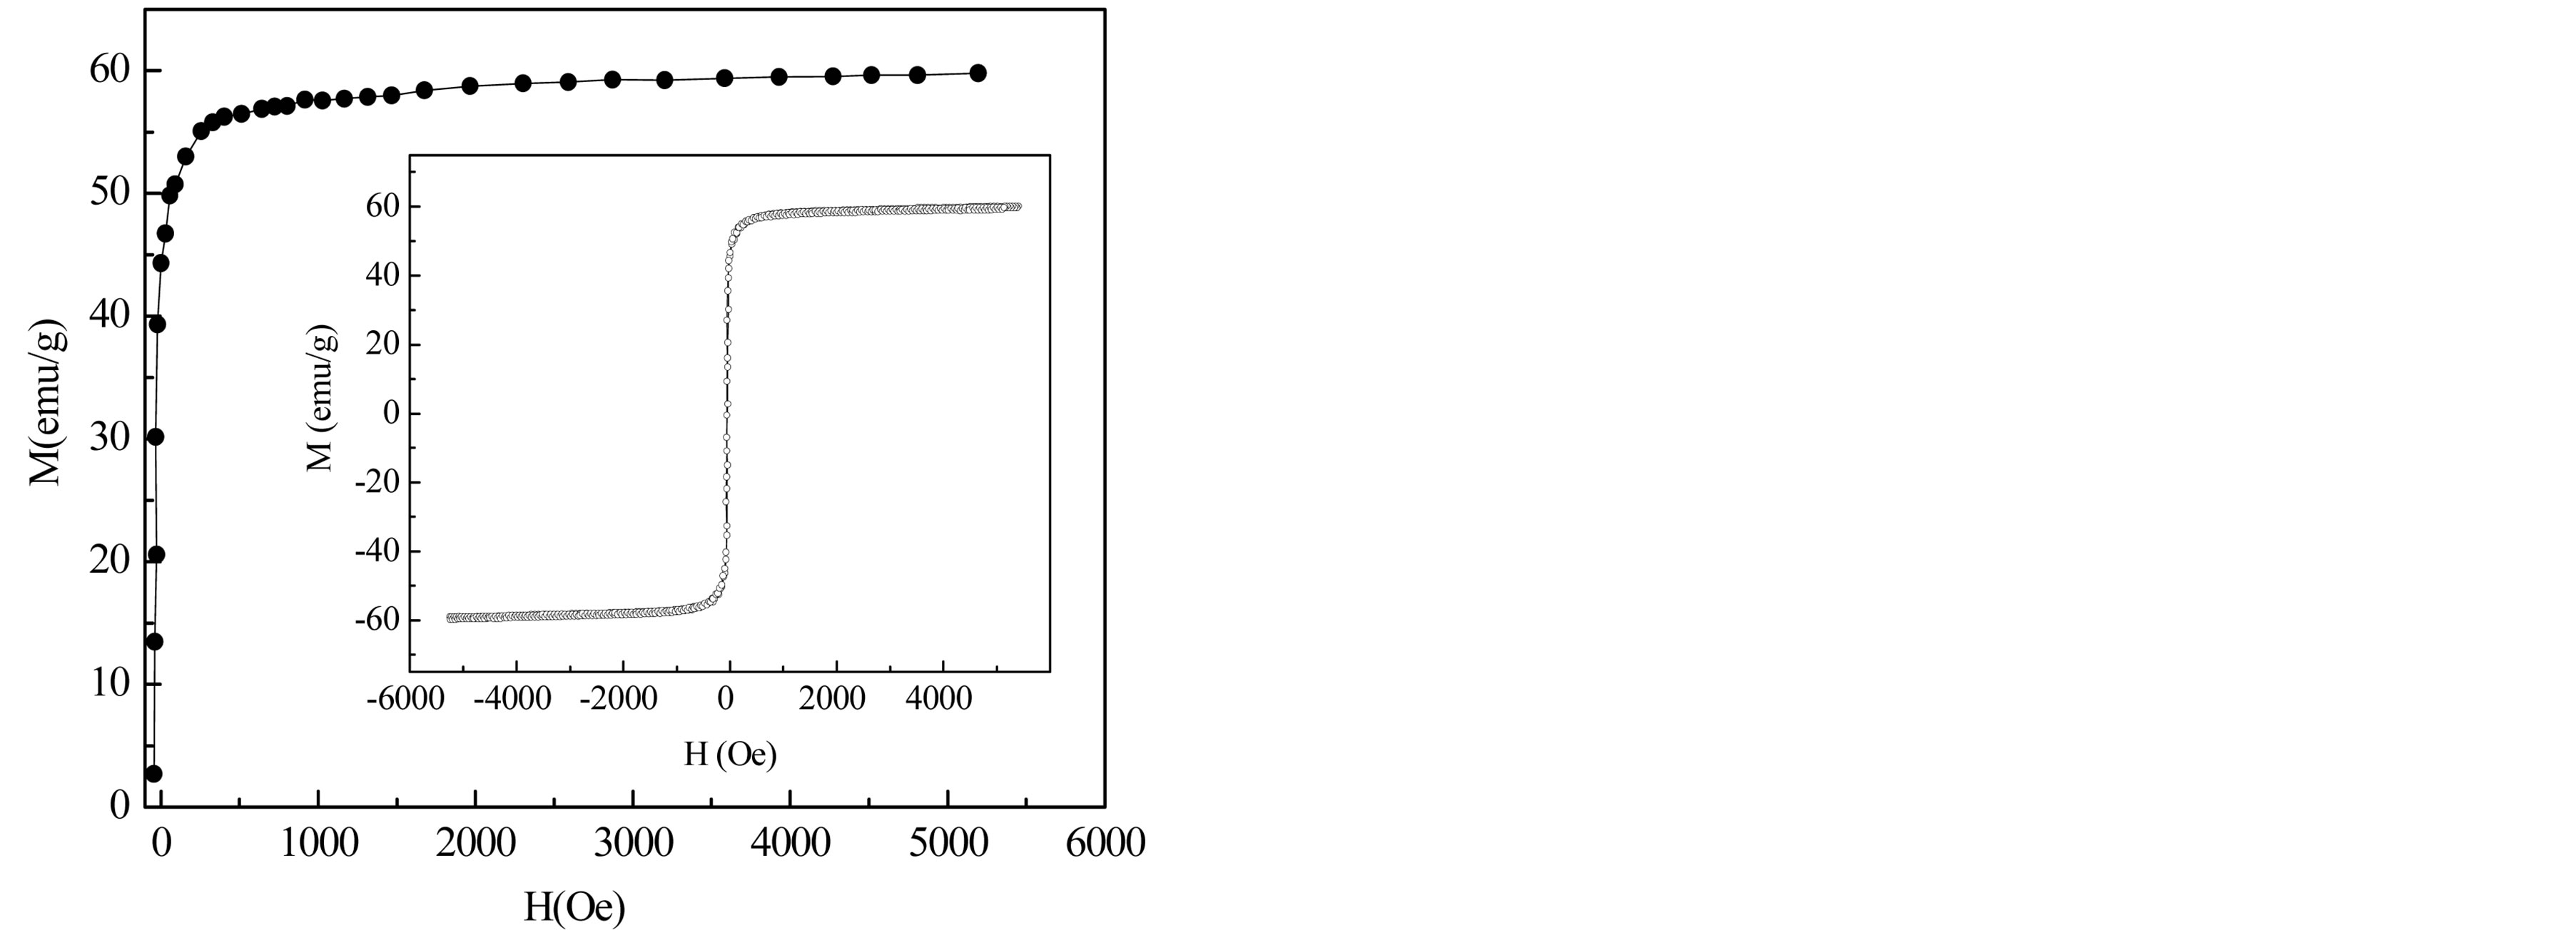
Figure 8. Field dependence of magnetization of Mg0.35Cu0.20Zn0.45Fe1.94O4 ferrite. In the inset: hysteresis loop of the sample.
carried out by using the vibrating sample magnetometer with an applied field of 6 kOe. Inset of the figure represents room temperature complete magnetic hysteresis loop of the sample. The sample exhibited low coercavity values indicating that the sample belongs to the family of soft ferrites. The saturation magnetization Ms for the sample at room temperature is found to be 60 emu/g.
3.3. Electrical Transport Properties
The electrical transport properties of ferrites are very sensitive to the chemical composition, sintering temperature, sintering time, type and amount of substitutions. The room temperature DC resistivity (rdc) of the sintered Mg-Cu-Zn ferrite is found to decrease markedly from 1.17 × 10⁵ W-cm to 2.25 × 10⁴ W-cm with the increase in sintering time from 1 h to 5 h as shown in Figure 9 and is given in Table 2. Verway-de-Boer explained [23] that in ferrites containing ions of the same element existing in more than one valence state and distributed randomly over crystallographically equivalent lattice sites. A number of such ions can be produced during the sintering of these ferrite samples. Fe2+ ion concentration is a characteristic property of a ferrite material and depends upon several factors such as sintering temperature or time and atmosphere including the grain structure. The conduction mechanism in ferrite takes place by hopping of electrons between the Fe ions in +2 and +3 valence states within the octahedral sites (B-sites) without causing a change in the energy state of the crystal as result of transition. At higher sintering temperature, there are more Fe2+ ions and more conduction which decreases the resistivity. Ferrite structurally forms cubic closed packed oxygen lattices with the cations at the Aand B-sites. The distance between two metal ions at B-site is smaller than the distance between a metal ion at B-site and another metal ion at A-site. The electron hopping between Aand B-sites
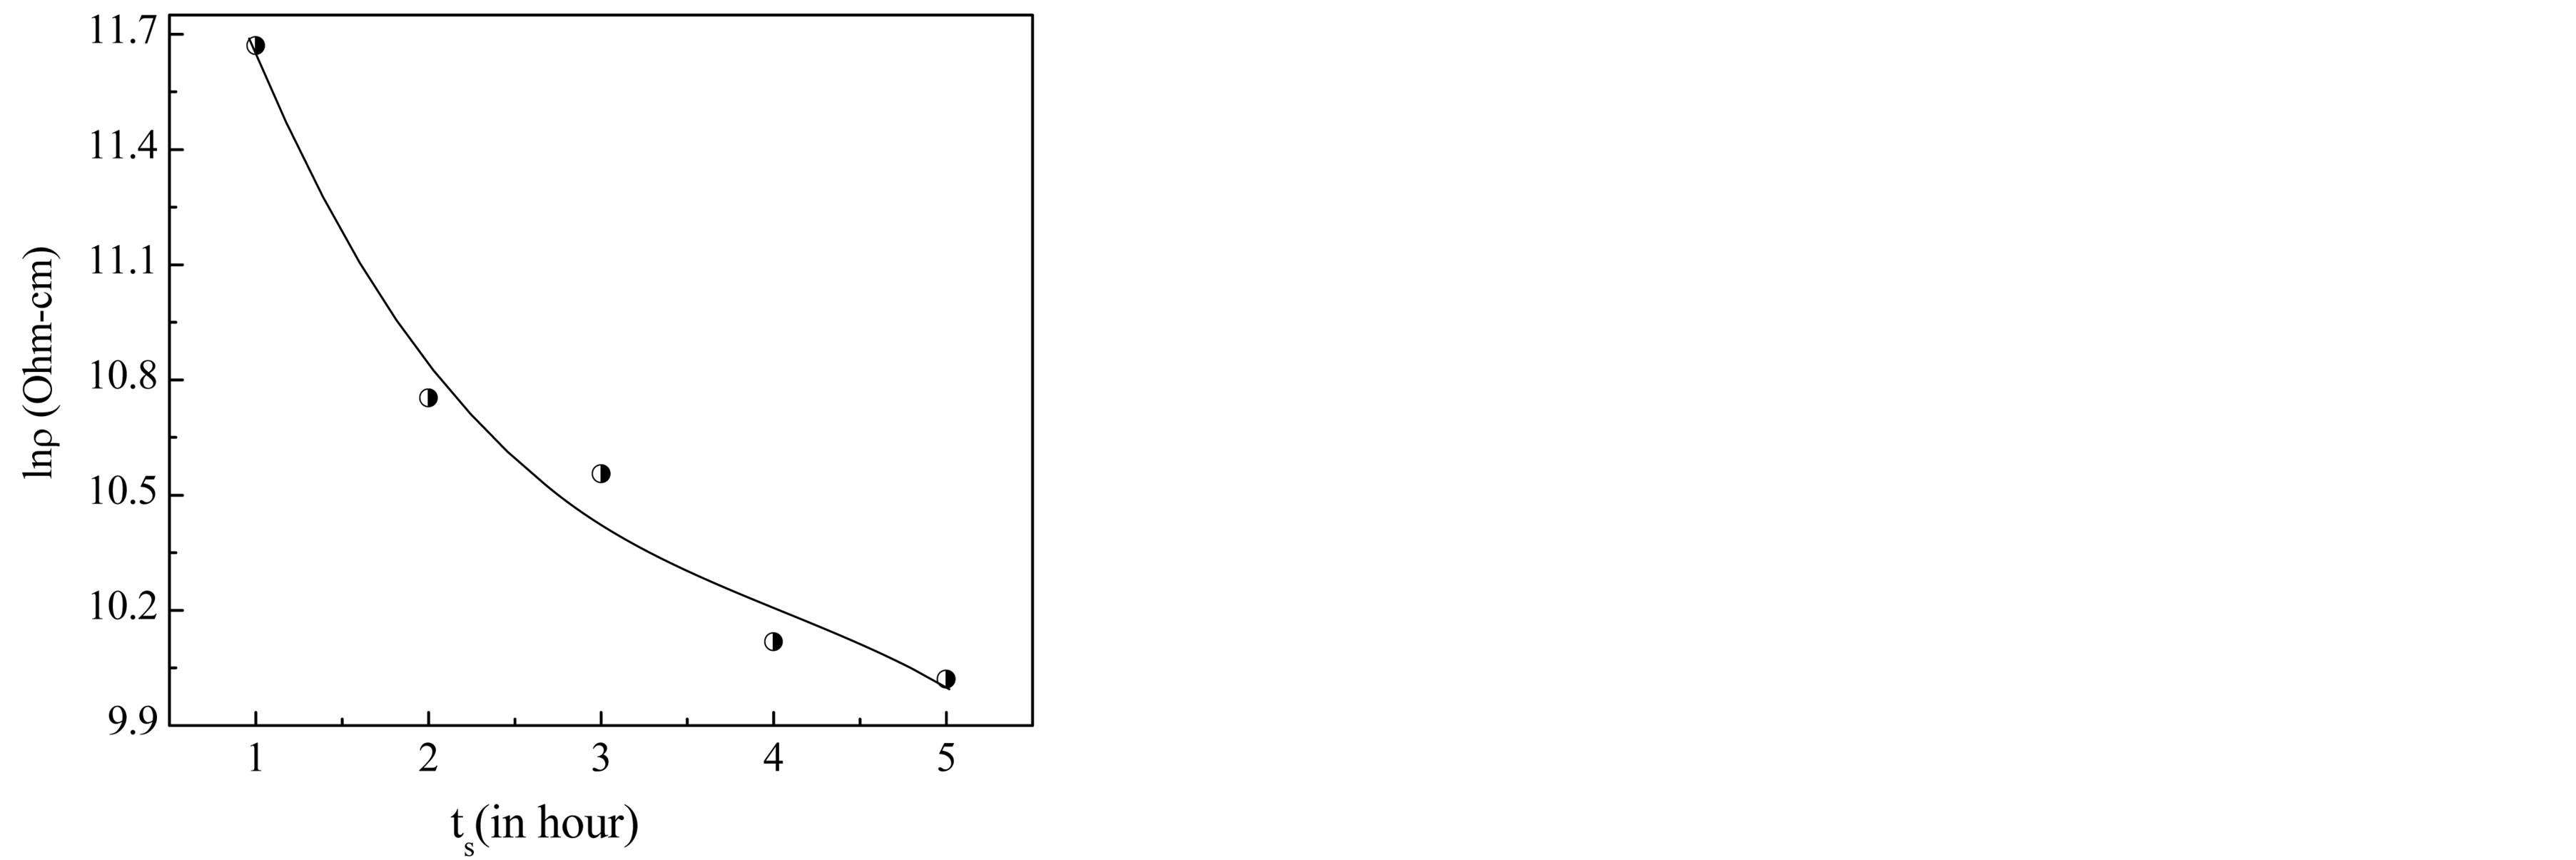
Figure 9. Variation of room temperature DC resistivity with sintering time, ts.
under normal conditions therefore has a very small probability compared with that for B-B hopping. Hopping between Aand A-sites does not exist for the reason that there are only Fe3+ ions at the A-site and Fe2+ ions formed during processing preferentially occupy B-sites only.
The highest value of DC resistivity of the sample sintered for 1 h is observed to be 1.17 ´ 105 W-cm. The observed decrease in resistivity with the increase of sintering time has been attributed to the increased Fe2+ ions content. Obviously, the more the Fe2+ ions the higher the conduction mechanism and consequently a decrease in the resistivity.
Plot of electrical resistivity (lnr) vs. temperature (103/T) is presented in Figure 10. The relationship between resistivity and temperature may be expressed by Arrhenius relation as
 (8)
(8)
where, r is the resistivity, T is the absolute temperature, kb the Boltzman constant and DE is the activation energy.
Figure 10 shows that the electrical resistivity of Mg0.35Cu0.20Zn0.45Fe1.94O4 ferrite decreases by increasing temperature which follows the Arrhenius equation. This is the property of the semiconducting nature in the sintered ferrites. From this figure one can observe that in the investigated temperature range, the resistivity is decreased by about three orders of magnitude. This strong increase in the conductivity with temperature must be regarded mainly as due to the thermally activated mobility of charge carriers, but not to a thermally activated creation of theses carriers. The activation energy Ea of the sintered ferrites was determined from the slop of lnr vs. 103/T plots by using the Equation (8) and is presented in Table 2. It decreases with the increase in sintering time. It is due to the fact that a material having higher conductivity has low activation energy and vice versa.
Figure 11 shows the variation of dielectric constant e¢ with frequency for different compositions of
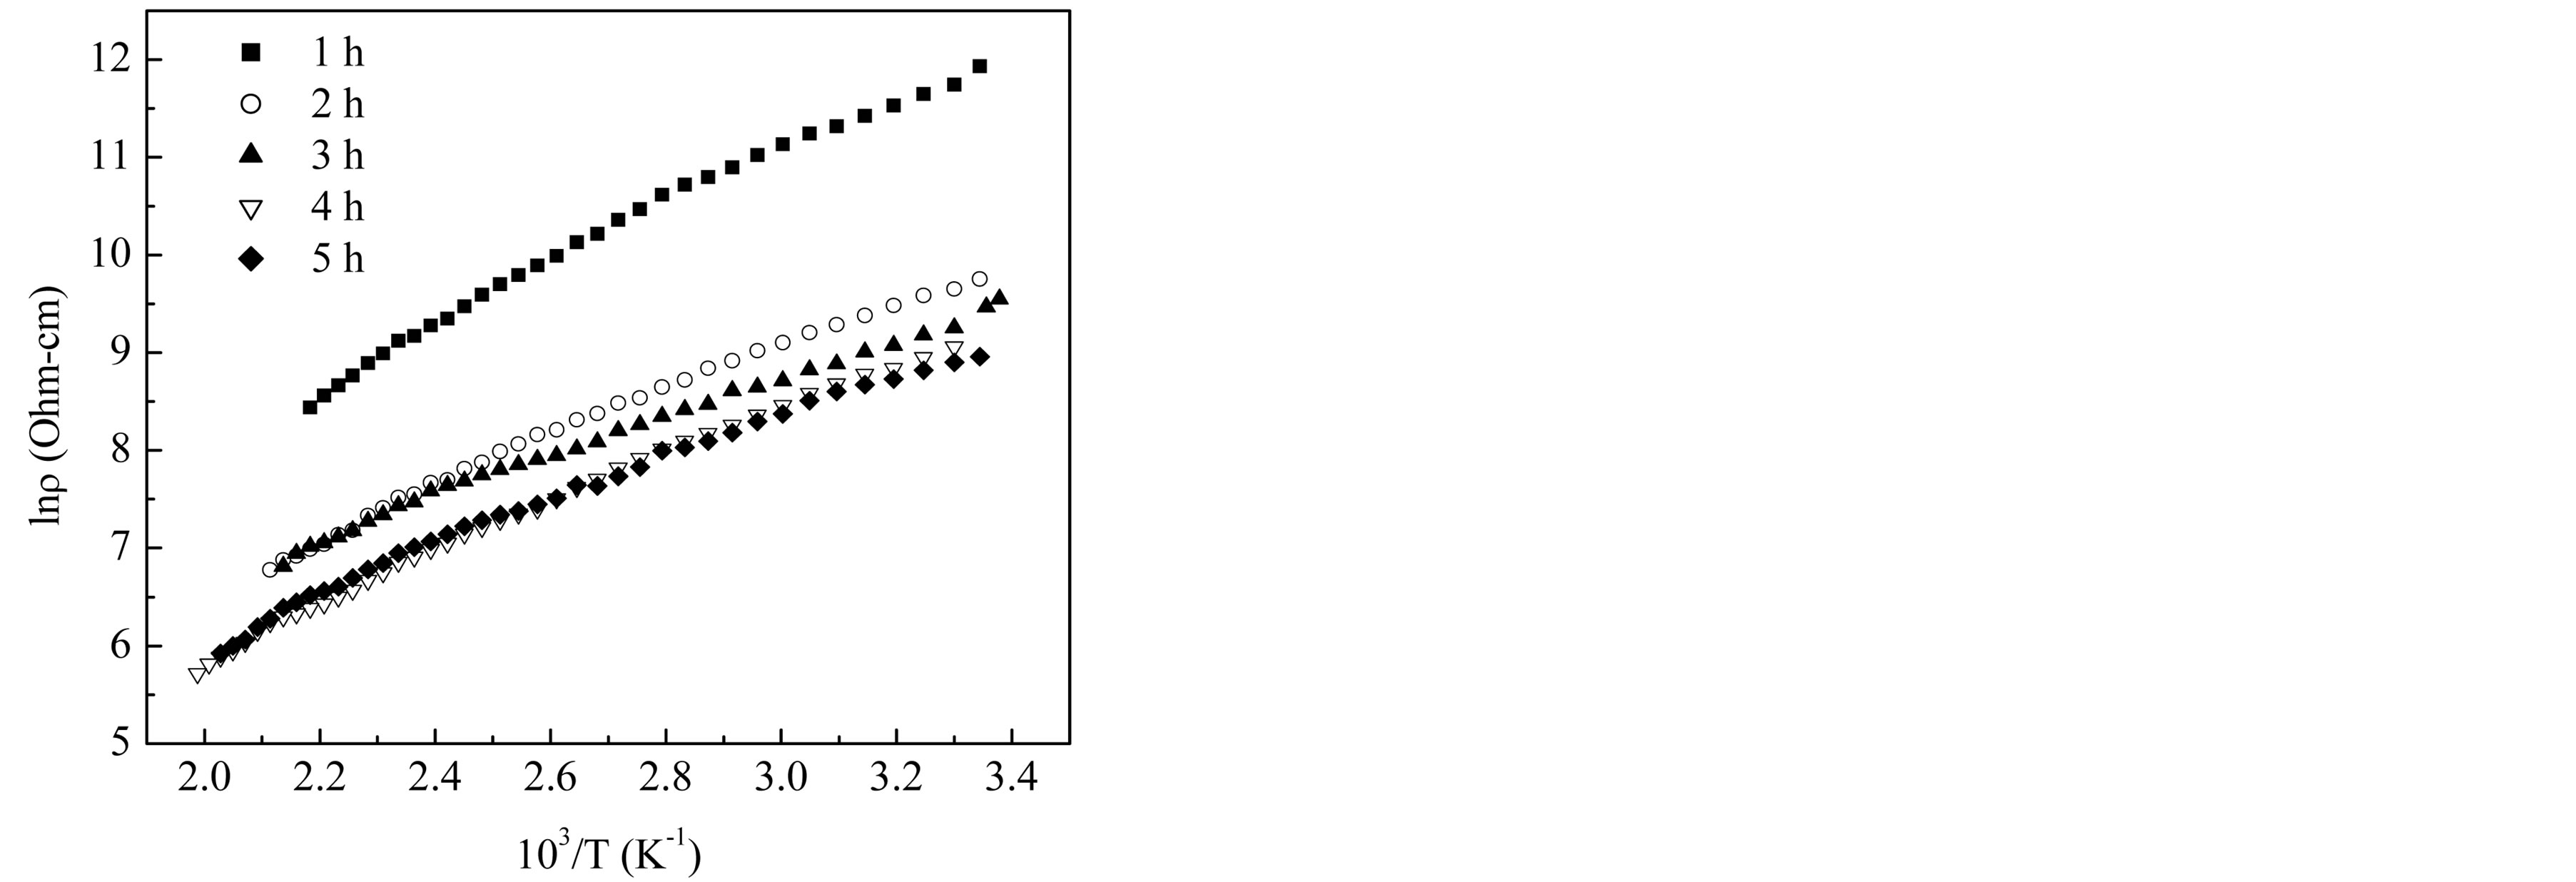
Figure 10. Temperature dependence of DC resistivity of Mg0.35Cu0.20Zn0.45Fe1.94O4 ferrites sintered at 1150˚C for different sintering time.
Mg0.35Cu0.20Zn0.45Fe1.94O4 ferrites sintered at 1150˚C. Value of e¢ is very high at lower frequencies. It decreases rapidly in the low frequency region and at high frequency region it becomes almost independent of frequency. This type of dielectric behaviour in the ferrites has been explained by the Maxwell-Wagner [24,25] and Koops phenomenological theory [26]. According to Maxwell and Wagner two layer model [24,25] space charge polarization is produced due to inhomogeneous dielectric structure of the material. In this model, a dielectric medium is assumed to be formed by highly conducting grains separated by thin poorly conducting grain boundaries. The grain boundaries are more effective at low frequencies while grains are found to be more effective at higher frequencies. This type of behaviour was observed in a number of ferrites such as Mg-Cu-Zn ferrites [27,28], LiCo ferrites [29], Ni-Cu-Zn ferrites [30], Li-Mg-Ti ferrites [31], Cu-Cd ferrites [32]. Rabinkin and Novikova [33] pointed out that the dielectric polarization in ferrites is similar to that of the conduction mechanism. The electronic exchange between Fe2+ ions and Fe3+ ions gives the local displacement of electrons in the direction of applied electric field, which induces the polarization in ferrites [26,34]. Polarization decreases with the increase in frequency and reaches a constant value. The observed decrease in e¢ with the increase in frequency is due to the fact that above certain frequencies the electronic exchange between Fe2+ and Fe3+ ions does not follow the frequency of the applied AC field. The electrons have to pass through the well conducting grain and the poorly conducting grain boundaries. As the grain boundaries have large resistance, the electrons pile up there and produce large space charge polarization. Therefore, dielectric constant e¢ has large values in low frequency range. With the further increase in frequency, the electrons change their direction of motion rapidly which hinders the movement of electrons inside the dielectric material
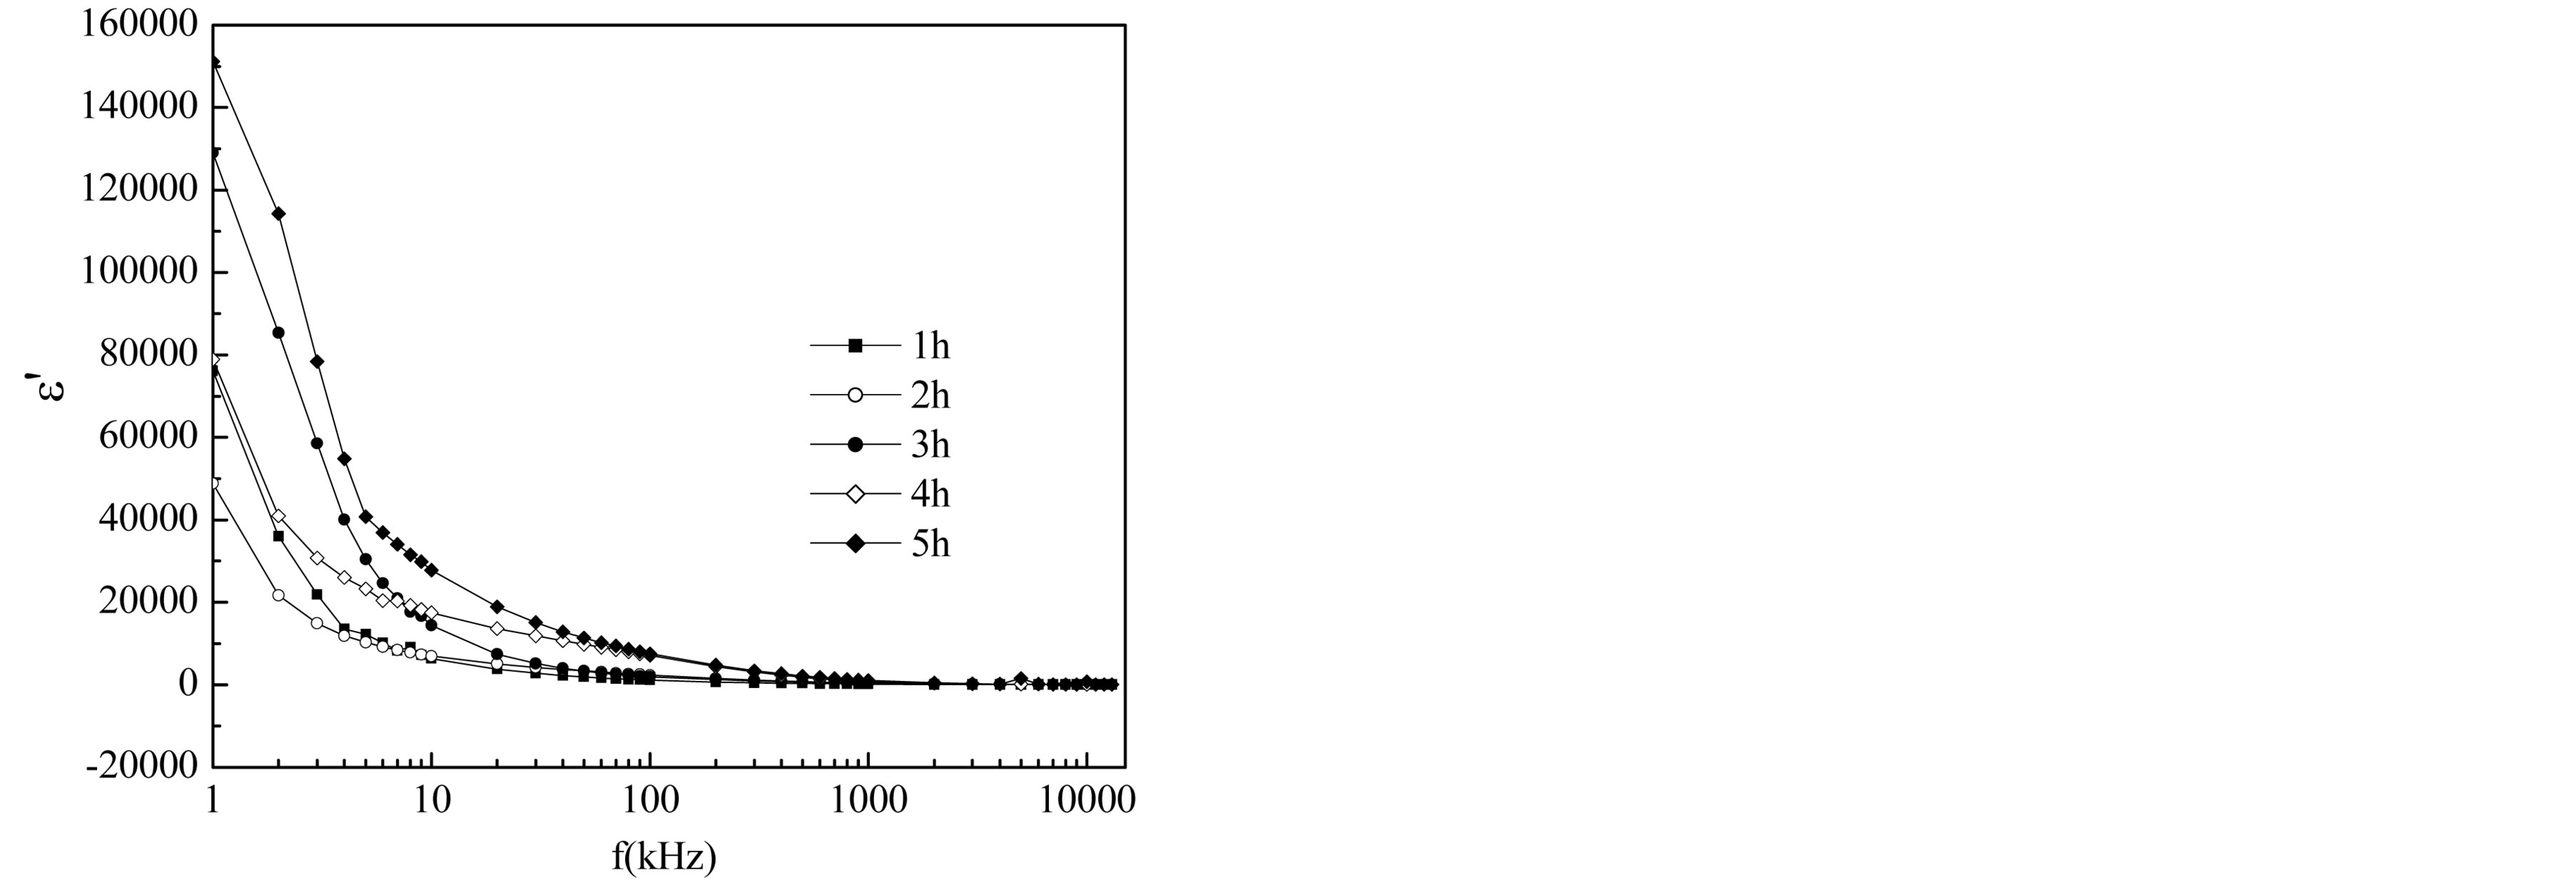
Figure 11. Dielectric constant (e¢) as a function of frequency of the ferrite system Mg0.35Cu0.20Zn0.45Fe1.94O4 sintered at 1150˚C for different sintering time.
and accumulation of charge at the grain boundaries decreases. This decreases the space charge polarization and therefore, the values of dielectric constant are also reduced. Values of dielectric constant are found to increase with the increase in sintering time. This is because the sintering time brings an increase in Fe2+ concentration and is responsible for the increase in polarization. It can be explained on the basis that the mechanism of dielectric polarization to be similar to that of electric conduction.
The temperature dependence of e¢ for the samples at 100 kHz is presented in Figure 12. e¢ increases as the temperature increases which is the normal dielectric behaviour magnetic semiconductor ferrites. The increase in e¢ with temperature was earlier observed for the Mg-Ti [35], Ni-Zn [36,37], Li0.5Fe2.5O4 [38], Mg-Zn [39] ferrites. The hopping of electrons between Fe2+ and Fe3+ ions (at adjacent B-sites) is thermally activated on increasing the temperature. The hopping of these strongly localized electrons in the d-shell causes local displacements in the direction of applied AC field. The local displacements of electronic charge carriers cause (or determine) the dielectric polarization in ferrites. The dielectric behaviour of ferrites may be explained on the basis of dielectric polarization process is similar to that of the conduction mechanism and are mainly by the hopping conduction mechanism [33]. The resistivity of ferrites decreases with the increase in temperature because ferrites were considered as magnetic semiconductors. According to Koops, the dielectric permittivity is inversely proportional to the square root of resistivity. Therefore an increase in dielectric permittivity with temperature is expected. In the first region e¢ is increased slowly with temperature. This means that the thermal energy given to the system is not sufficient enough to free the localized dipoles and to orient them in the field direction. In most cases, the atoms or molecules in the samples cannot orient themselves at a low temperature region. When the temperature rises, the orientation of these dipoles is facilitated and this increases the dielectric polarization. At very high temperatures the chaotic thermal oscillations of molecules are intensified and the permittivity passes through a maximum value.
Figure 13 shows the changes of tand with temperature of the samples at 100 kHz. It seems that tand has, in general, small values and increases with increasing temperature. The range of loss factor values indicates that the prepared materials suffered very low dielectric losses even at higher frequencies. A very low dielectric loss is one of the characteristic parameter for microwave applications.
4. Conclusion
The variation of sintering time causes appreciable changes in the physical, magnetic, electrical and dielectric properties of Mg0.55Cu0.20Zn0.45Fe1.94O4 ferrites. XRD pattern shows the cubic phase spinel structure of the samples. The apparent density increases and the porosity decreases
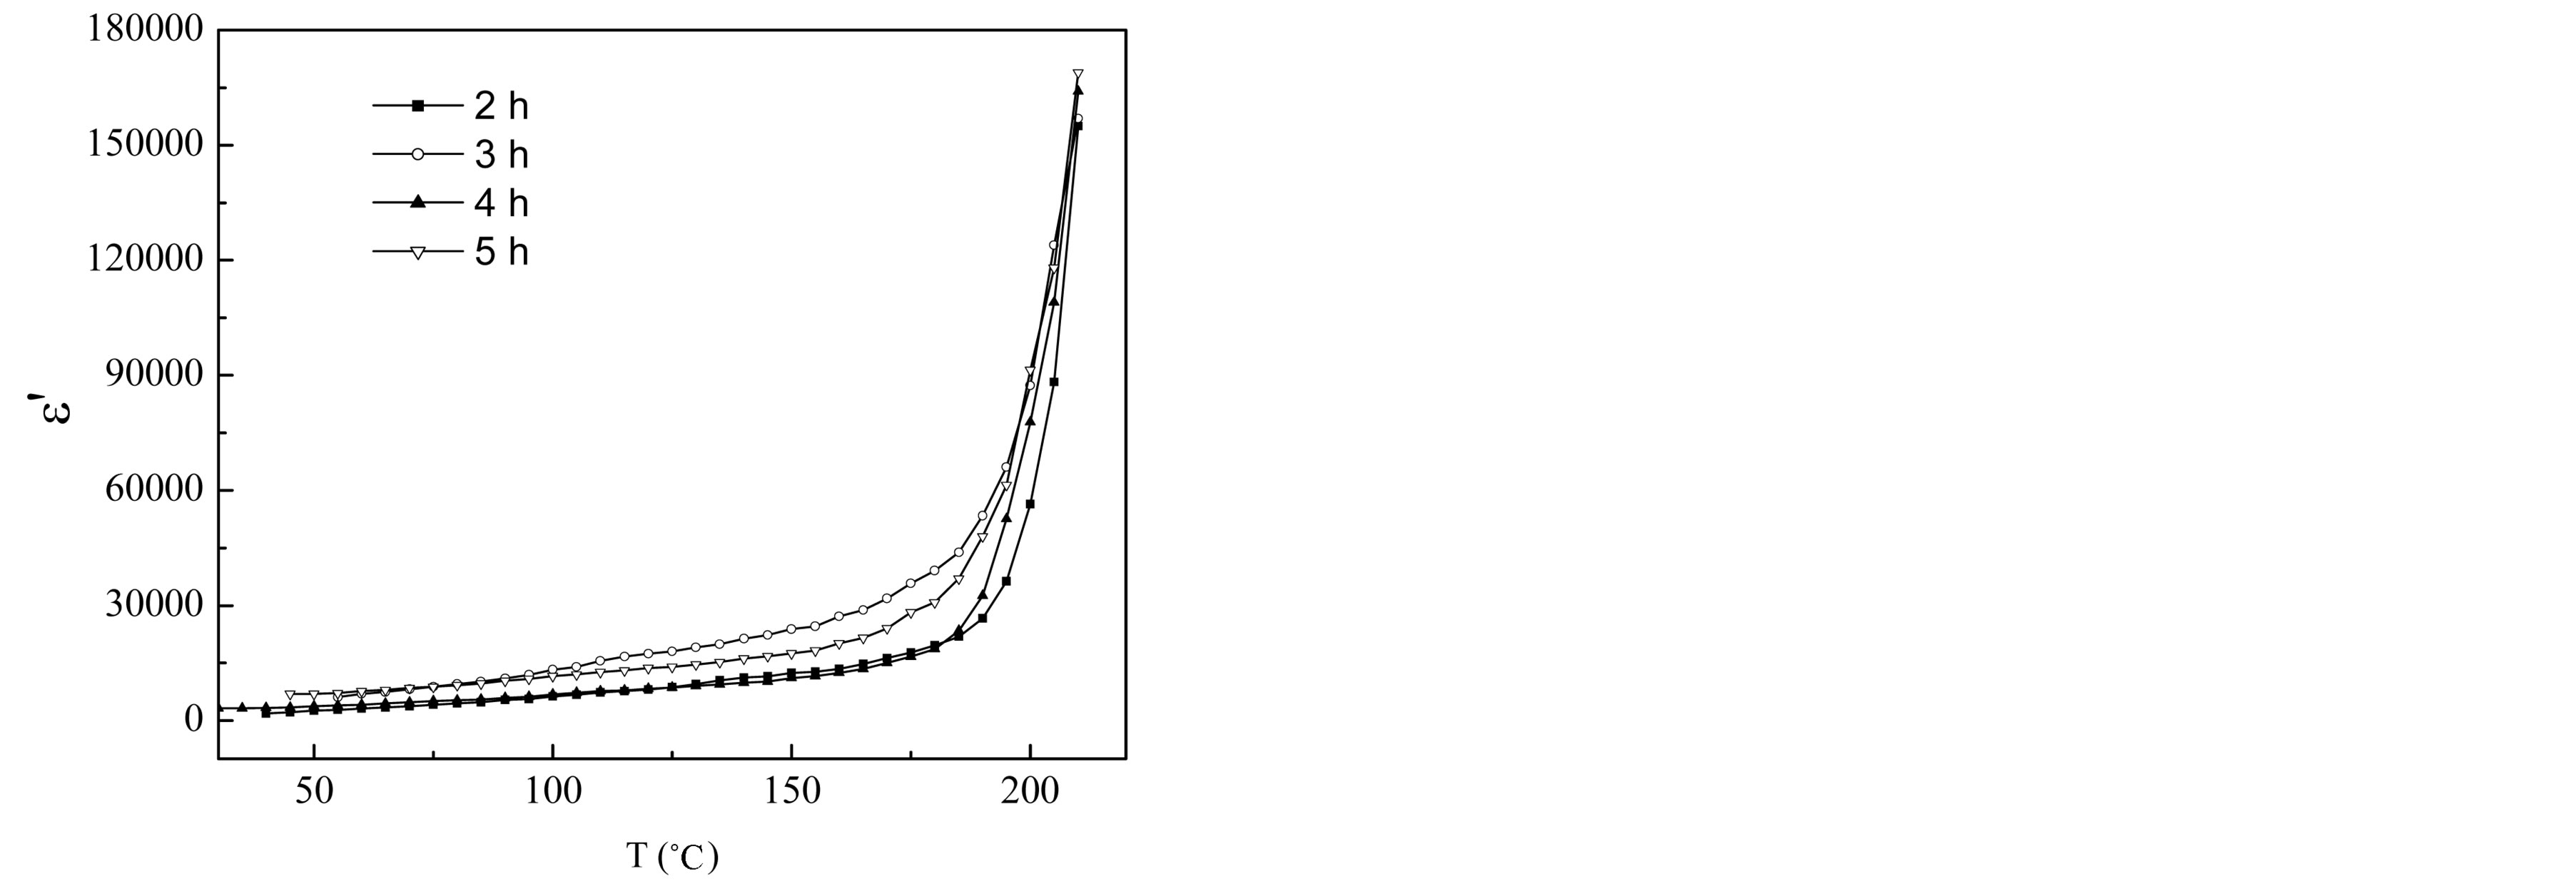
Figure 12. Temperature dependence of dielectric constant (e¢) of Mg0.35Cu0.20Zn0.45Fe1.94O4 samples.

Figure 13. Temperature dependence of dielectric loss tangent of Mg0.35Cu0.20Zn0.45Fe1.94O4 samples sintered at 1150˚C for different sintering time.
with the increase in sintering time of Mg-Cu-Zn ferrite. The increase in density of the samples may be attributed to the liquid phase sintering due to the presence of CuO. The initial permeability increases with sintering time but resonance frequency shifts toward the lower frequency which really confirms with Snoek’s relation. The increase in the permeability may be attributed to the increase of density and grain size. It is observed that DC resistivity (rdc) and activation energy of the sample decrease markedly with the increase in sintering time which is attributed to the increased Fe2+ ions content. The electrical conduction in these ferrites is explained on the basis of the hopping mechanism. Dielectric constant (e¢) decreases with increasing frequency exhibiting normal dielectric behaviour of ferrites. Dielectric constant and dielectric loss tangent increase with the increase of temperature passing through a maximum at high temperature which is attributed to the fact that the hopping of electrons between Fe2+ and Fe3+ ions is thermally activated with increasing temperature. In conclusion, it can be said that the sintering condition has influence on the properties like densification, microstructure, magnetic and electrical transport properties of Mg-Cu-Zn ferrites.
REFERENCES
- E. Reslescu, N. Reslescu and P. D. Popa, “Fine-Grained MgCu Ferrite with Ionic Substitutions Used as Humidity Sensor,” Journal of Magnetism and Magnetic Materials, Vol. 290-291, No. 2, 2005, pp. 1001-1004. http://dx.doi.org/10.1016/j.jmmm.2004.11.309
- M. Ajmal, N. Abbas Shah, A. Maqsood, M. S. Awan and M. Arif, “Influence of Sintering Time on the Structural, Electrical and Magnetic Properties of Polycrystalline Cu0.6Zn0.4Fe2O4 Ferrites,” Journal of Alloys and Compounds, Vol. 508, No. 1, 2010, pp. 226-232. http://dx.doi.org/10.1016/j.jallcom.2010.08.067
- J. Bera and P. K. Roy, “Effect of Grain Size on Electromagnetic Properties of Ni0.7Zn0.3Fe2O4 Ferrite,” Physica B, Vol. 363, No. 1-4, 2005, pp. 128-132. http://dx.doi.org/10.1016/j.physb.2005.03.010
- G. C. Jain, B. K. Das, R. B. Tripathi and R. Narayan, “Influence of V2O5 Addition on Electrical Conductivity and Magnetic Properties of Ni-Zn Ferrites,” IEEE Transaction on Magnetics, Vol. 18, No. 2, 1982, pp. 776-778. http://dx.doi.org/10.1109/TMAG.1982.1061820
- T. Nakamura, “Low-Temperature Sintering of Ni-Zn-Cu Ferrite and Its Permeability Spectra,” Journal of Magnetism and Magnetic Materials, Vol. 168, Vol. 3, 1997, pp. 285-291. http://dx.doi.org/10.1016/S0304-8853(96)00709-3
- J. E. Burke, “Ceramic Fabrication Processes,” Edited by W. D. Kingery, Wiley, New York, 1958, pp. 120-125.
- M. M. Haque, M. Huq and M. A. Hakim, “Thermal Hysteresis of Permeability and Transport Properties of MnSubstituted Mg-Cu-Zn Ferrites,” Journal of Physics D: Applied Physics, Vol. 41, No. 5, 2008, 10 p. http://dx.doi.org/10.1088/0022-3727/41/5/055007
- M. M. Haque, M. Huq and M. A. Hakim, “Influence of CuO and Sintering Temperature on the Microstructure and Magnetic Properties of Mg-Cu-Zn Ferrites,” Journal of Magnetism and Magnetic Materials, Vol. 320, No. 21, 2008, pp. 2792-2799. http://dx.doi.org/10.1016/j.jmmm.2008.06.017
- A. Bhaskar, B. R. Kanth and S. R. Murthy, “Electrical Properties of Mn Added MgCuZn Ferrites Prepared by Microwave Sintering Method,” Journal of Magnetism and Magnetic Materials, Vol. 283, No. 1, 2004, pp. 109-116. http://dx.doi.org/10.1016/j.jmmm.2004.05.039
- N. Reslescu, E. Reslescu, C. L. Sava, F. Tudorache and P. D. Popa, “On the Effects of Ga3+ and La3+ Ions in MgCu Ferrite: Humidity-Sensitive Electrical Conduction,” Crystal Research Technology, Vol. 39, No. 6, 2004, pp. 548- 557. http://dx.doi.org/10.1002/crat.200310223
- J. B. Nelson and D. P. Riley, “An Experimental Investigation of Extrapolation Methods in the Derivation of Accurate Unit-Cell Dimensions of Crystals,” Proceedings of the Physical Society (London), Vol. 57, No. 3, 1945, p. 160. http://dx.doi.org/10.1088/0959-5309/57/3/302
- G. T. Rado, R. W. Wright and W. H. Emerson, “Ferromagnetism at Very High Frequencies. III. Two Mechanisms of Dispersion in a Ferrite,” Physical Review, Vol. 80, No. 2, 1950, pp. 273-280. http://dx.doi.org/10.1103/PhysRev.80.273
- T. Nakamura, “Snoek’s Limit in High-Frequency Permeability of Polycrystalline Ni-Zn, Mg-Zn, and Ni-Zn-Cu Spinel Ferrites,” Journal of Applied Physics, Vol. 88, No. 1, 2004, pp. 348-353. http://dx.doi.org/10.1063/1.373666
- F. G. Brockman, P. H. Dowling and W. G. Steneck, “Dimensional Effects Resulting from a High Dielectric Constant Found in a Ferromagnetic Ferrite,” Physical Review, Vol. 77, No. 1, 1950, pp. 85-93. http://dx.doi.org/10.1103/PhysRev.77.85
- J. L. Snoek, “Dispersion and Absorption in Magnetic Ferrites at Frequencies above One Mc/s,” Physica, Vol. 14, No. 4, 1948, pp. 207-217. http://dx.doi.org/10.1016/0031-8914(48)90038-X
- O. F. Caltun, L. Spinu, A. I. Stancu, D. Thung and W. Zhou, “Study of the Microstructure and of the Permeability Spectra of Ni-Zn-Cu Ferrites,” Journal of Magnetism and Magnetic Materials, Vol. 242-245, No. 1, 2002, pp. 160-162. http://dx.doi.org/10.1016/S0304-8853(01)01187-8
- J. Smit and H. P. J. Wijn, “Ferrites (Philips Tech. Library (Netherlands),” 1959.
- A. Globus and M. Guyot, “Control of the Susceptibility Spectrum in Polycrystalline Ferrite Materials and Frequency Threshold of the Losses,” IEEE Transaction on Magnetics, Vol. 6, No. 3, 1970, pp. 614-617. http://dx.doi.org/10.1109/TMAG.1970.1066878
- K. G. Brooks, Y. Berta and V. R. W. Amarakoon, “Effect of Bi2O3 on Impurity Ion Distribution and Electrical Resistivity of Li-Zn Ferrites,” Journal American Ceramic Society, Vol. 75, No. 11, 1992, pp. 3065-3069. http://dx.doi.org/10.1111/j.1151-2916.1992.tb04387.x
- J. J. Shrotri, S. D. Kulkarni, C. E. Deshpande and S. K. Date, “Effect of Cu Substitution on the Magnetic and Electrical Properties of Ni-Zn Ferrite Synthesised by Soft Chemical Method,” Materials Chemistry and Physics, Vol. 59, No. 1, 1999, pp. 1-5. http://dx.doi.org/10.1016/S0254-0584(99)00019-X
- A. Globus, H. Pascard and V. J. Cagan, “Distance between Magnetic Ions and Fundamental Properties in Ferrites,” Journal of Physique Coll, Vol. 38, No. C1, 1977, pp. C1- 163. http://dx.doi.org/10.1051/jphyscol:1977132
- G. C. Jain, B. K. Das, R. S. Khanduja and S. C. Gupta, “Effect of Intragranular Porosity of Initial Permeability and Coercive Force in a Manganese Zinc Ferrite,” Journal of Materials Science, Vol. 11, No. 7, 1976, pp. 1335- 1338. http://dx.doi.org/10.1007/BF00545155
- E. J. W. Verwey and P. W. Haayman, “Electronic Conductivity and Transition Point of Magnetite (‘Fe3O4’),” Physica, Vol. 8, No. 9, 1941, pp. 979-987. http://dx.doi.org/10.1016/S0031-8914(41)80005-6
- J. Maxwell, “A Treatise on Electricity and Magnetism,” Clarendon Press, Oxford, London, 1982.
- K. Wangner, “Annalen de Physik,” Leipzig, Vol. 40, No. 5, 1913, p. 817. http://dx.doi.org/10.1002/andp.19133450502
- C. G. Koops, “On the Dispersion of Resistivity and Dielectric Constant of Some Semiconductors at Audiofrequencies,” Physical Review, Vol. 83, No. 1, 1951, pp. 121- 124. http://dx.doi.org/10.1103/PhysRev.83.121
- M. M. Haque, M. Huq and M. A. Hakim, “Densification, Magnetic and Dielectric Behaviour of Cu-Substituted MgZn Ferrites,” Materials Chemistry and Physics, Vol. 112, No. 2, 2008, pp. 580-586. http://dx.doi.org/10.1016/j.matchemphys.2008.05.097
- Z. X. Yue, Z. Ji, L. T. Li, X. L. Wang and Z. L. Gui, “Effect of Copper on the Electromagnetic Properties of MgZn-Cu Ferrites Prepared by Sol-Gel Auto-Combustion Method,” Materials Science and Engineering B, Vol. 86, No. 1, 2001, pp. 64-69. http://dx.doi.org/10.1016/S0921-5107(01)00660-2
- N. Gupta, S. C. Kashyap and D. C. Dube, “Dielectric and Magnetic Properties of Citrate-Route-Processed Li-Co Spinel Ferrites,” Physics Status Solidi (a), Vol. 240, No. 7, 2007, pp. 2441-2452. http://dx.doi.org/10.1002/pssa.200622146
- Z. X. Yue, Z. Ji, Z. L. Gui and L. T. Li, “Magnetic and Electrical Properties of Low-Temperature Sintered MnDoped NiCuZn Ferrites,” Journal of Magnetism and Magnetic Materials, Vol. 264, No. 2-3, 2003, pp. 258-263. http://dx.doi.org/10.1016/S0304-8853(03)00214-2
- S. S. Bellad and B. K. Chougule, “Composition and Frequency Dependent Dielectric Properties of Li-Mg-Ti Ferrites,” Materials Chemistry and Physics, Vol. 66, No. 1, 2000, pp. 58-63. http://dx.doi.org/10.1016/S0254-0584(00)00273-X
- C. B. Kolekar, P. N. Kamble, S. G. Kulkarni and A. S. Vaingankar, “Effect of Gd3+ Substitution on Dielectric Behaviour of Copper-Cadmium Ferrites,” Journal of Materials Science, Vol. 30, No. 22, 1995, pp. 5784-5788. http://dx.doi.org/10.1007/BF00356721
- L. I. Rabinkin and Z. I. Novikova, “Ferrites,” Doklady Akademii Nauk SSSR, Minsk, USSR, 1960, p. 146.
- K. Iwauchi, “Dielectric Properties of Fine Particles of Fe3O4 and Some Ferrites,” Japanese Journal of Applied Physics, Vol. 10, No. 11, 1971, pp. 1520-1528. http://dx.doi.org/10.1143/JJAP.10.1520
- M. A. Ahmed, E. Aeia and F. M. Salem, “Spectroscopic and Electrical Properties of Mg-Ti Ferrite Doped with Different Are-Earth Elements,” Physica B, Vol. 381, No. 1-2, 2006, pp. 144-155. http://dx.doi.org/10.1016/j.physb.2005.12.265
- A. M. Abdeen, “Dielectric Behaviour in Ni-Zn Ferrites,” Journal of Magnetism and Magnetic Materials, Vol. 192, No. 1, 1999, pp. 121-129. http://dx.doi.org/10.1016/S0304-8853(98)00324-2
- A. Verma, O. P. Khakur, C. Prakash, T. C. Goel and R. G. Mendiratta, “Temperature Dependence of Electrical Properties of Nickel-Zinc Ferrites Processed by the Citrate Precursor Technique,” Materials Science and Engineering B, Vol. 116, No. 1, 2005, pp. 1-6. http://dx.doi.org/10.1016/j.mseb.2004.08.011
- M. George, S. S. Nair, A. M. John, P. A. Joy and M. R. Anantharaman, “Structural, Magnetic and Electrical Properties of the Sol-Gel Prepared Li0.5Fe2.5O4 Fine Particles,” Journal of Physics D: Applied Physics, Vol. 39, No. 5, 2006, pp. 900-910. http://dx.doi.org/10.1088/0022-3727/39/5/002
- M. A. El Hiti, “Dielectric Behaviour in Mg-Zn Ferrites,” Journal of Magnetism and Magnetic Materials, Vol. 192, No. 2, 1999, pp. 305-313. http://dx.doi.org/10.1016/S0304-8853(98)00356-4
NOTES
*Corresponding author.