World Journal of Condensed Matter Physics
Vol.1 No.3(2011), Article ID:6929,7 pages DOI:10.4236/wjcmp.2011.13012
Electron Momentum Density and X-Ray Structure Factors of Copper
![]()
1Department of Physics, Banasthali University, Banasthali, India; 2Department of Physics, University of Rajasthan, Jaipur, India.
Email: *gsphysics@gmail.com
Received June 13th, 2011; revised July 8th, 2011; accepted July 20th, 2011.
Keywords: Momentum Density, LCAO Method, Electronic Structure, X-Ray Structure Factor, Metallic Behavior
ABSTRACT
In this paper, the ground state properties i.e. electron momentum density and X-ray structure factors of fcc-copper are presented. The Am241 Compton spectrometer, which uses 59.54 keV gamma-rays, has been used for the Compton profile measurement. To compare the experimental data, the Compton profiles within the framework of linear combination of atomic orbitals (LCAO) method using Hartree-Fock (HF), density functional (DF) and hybrid B3PW schemes embodied in the CRYSTAL06 code have been computed. Among the various theoretical calculations, it is found that the present experimental data is in very good agreement with the hybrid B3PW scheme. A real-space analysis of the experimental Compton profile shows the metal-like behavior of copper. The structure factors for copper are computed using hybrid B3PW scheme and compared with available experimental and theoretical data.
1. Introduction
The transition metals, owing to their partially filled dshell valence electrons, exhibit versatile and useful properties in forming oxides, alloys, ceramics, etc. The basic ground-state electronic and structural properties of copper attract much attention from scientists [1-22]. Fong and Cohen [1] employed the empirical pseudopotential method to investigate the electronic band structure of fcc-copper. The Compton profiles of fcc-copper have been measured along the [100], [110] and [111] directions by Eisenberger and Reed [2] using Te123m 160 keV gamma-rays source. They found the presence of d-type bonds in the [110] direction. Kanhere and Singru [3] have been investigated the electron momentum distribution in copper using renormalized-free-atom (RFA) model. Directional Compton profiles of copper have been measured by Pattison et al. [4] by means of 412 keV gamma-rays. Momentum density of all occupied states of copper has been calculated by Bross [5] using the modified augmented plane wave (MAPW) method. The electronic band structure of copper along [001], [110] and [111] directions have been reported by Courths et al. [6] using angle-resolved photoemission spectra and they found that the experimental band structure below the Fermi energy shows the spin-orbit splitting of the dbands. Bauer and Schneider [7] reported the band structure calculations of copper and compared with the experiment. They found that the significant discrepancies for the Compton profile anisotropies do not originate from inaccurate solutions of the Kohn-Sham self-consistent equations, but from a non-local momentum density correlation correction functional. Further, they also investigated the non-local exchange-correlation and correlation effects on Compton profile of copper [8,9]. Petrillo and Sacchetti [10] calculated the Compton spherical profiles of copper employing the one-particle Green function. Heller and Moreira [11] reported the Compton profiles measurements on copper for three scattering angles (30˚, 15˚ and 10˚) using 662 keV gammarays. Chang et al. [12] measured the isotropic Compton profile of some transition metals including copper using Cs137 source and compared with RFA model. The first ab-initio quasiparticle calculation for copper has been employed by Marini et al. [13]. They found that exchange effects between d electrons and 3s, 3p core states play a key role and cannot be neglected in the calculation of the QP corrections. Winkelmann et al. [14] reported the clear influence of coherent excitation pathways in three-photon photoemission from copper (001).
Among structural properties, the relativistic HartreeFock atomic field method has been employed by Doyle and Turner [15] to explore the X-ray and electron scattering factors of copper. Wakoh and Yamashita [16] reported the theoretical form factors of 3d transition metals including copper using charge density distributions obtained by the band calculation. The band structure calculation of Bagayoko et al. [17] for structure factors using Gaussian orbitals and a local exchange correlation potential, gave a good fit to photoemission data. The effective isotropic Debye-Waller (DW) factor for copper has been measured accurately by Schneider et al. [18] using Bragg gamma-ray diffraction at 50 K and room temperature. Eckardt et al. [19] investigated the good-quality selfconsistent charge densities and converged excited bands up to 30 eV above the Fermi level in some noble metals including copper. Petrillo et al. [20] also employed the gamma-ray diffraction to determine the structure factors in some elemental solids including copper. The zone-axis convergent-beam electron diffraction (CBED) has been applied by Saunders et al. [21] to explore the low-order structure factor in copper. Friis et al. [22] have measured the accurate low-order structure factors for copper metal using qualitative convergent beam electron diffraction (QCBED). Thus, structure factors of copper have been studied by many researchers using different methods over the last 40 years. A new data set is added here using the hybrid scheme of LCAO method.
The Compton scattering measurement, which gives a spectrum of inelastically scattered photons from electrons in a sample, is useful to probe the electronic structure of materials [23]. The Compton profile, J(pz), which is one dimensional projection of the electron momentum density ρ(p), along the usually chosen z-axis of a cartesian co-ordinate system can be given as
 (1)
(1)
here the momentum space wave function  is simply a Fourier transform of the real space wave function
 . In this paper the Compton profile study of copper using 59.54 keV gamma-ray source is presented. For the theoretical Compton profiles, LCAO calculations embodied in CRYSTAL06 code [24] have been used. Being an observable derived from ground state charge density, we also calculate the X-ray structure factors which are compared with the available experimental and theoretical results. These have further usage in structure refinement techniques for the experiments to appear in future. An outline of this paper is as follows: After a brief description of the experiment and data analysis (Section 2), computational details are discussed in Section 3. In Section 4 the results and discussion are given and the last Section 5 summarizes the results of this investigation. In this paper, all quantities are in atomic units (a.u.) where e = ħ = m = 1 and c = 137.036, giving unit momentum =1.9929 × 10⁻²⁴ kg·m·s–1, unit energy = 27.212 eV and unit length = 5.2918 × 10⁻¹¹ m.
2. Experiment and Data Analysis
The measurement on copper was performed using the Am241 radioisotope-based Compton spectrometer [25]. The sample were held vertically in an evacuated (~10–2 torr) scattering chamber. The g-rays of 59.54 keV were scattered from the sample through a mean angle of 166˚ (±3.0˚). The scattered radiation was analyzed by an HPGe detector (Canberra model, GL0110S), and associated electronics like spectroscopy amplifier (Canberra, 2010 model), an analogue to digital converter (Canberra, 8075 model) and a multi channel analyzer (Canberra, S-100 model). To minimize the electronic drift in the amplification and analogue-to-digital conversion, the detection system was kept at an ambient temperature. The drift in the electronic system was checked of by using a weak Am241 calibration source. The channel width of the multi channel analyzer (MCA) was about 20 eV, which corresponds to 0.03 a.u. on electron momentum scale. The spectrometer had an overall momentum resolution of 0.6 a.u. (Gaussian FWHM), which includes the detector resolution and the geometrical broadening of the incident and the scattered radiations. The Compton scattering spectra was measured for around 17 h with total peak counts around 30,000 for copper. To correct for the background, measurement with sample holder was performed for 17 h and the intensity was subtracted from the measured spectra. Thereafter, the Compton profile was corrected for instrumental resolution (stripping off the low energy tail), sample absorption, cross section and multiple scattering etc. using computer code of the Warwick group [26,27]. To account for multiple scattering corrections history of approximately 107 photons were considered. The effect of multiple scattering was found to be 10.38% in the –10 to +10 a.u for copper. Finally, the profile was normalized to 12.473 electrons in the momentum range 0 to +7 a.u. at the interval of 0.1 a.u., being the area of free atom Compton profile [28] in the given range.
3. Computational Details
The CRYSTAL code [24] has been employed in the computation.This code follows LCAO method under HF, DFT and hybrid schemes [24,29]. In this method each crystalline orbital ψi(r,k) is a linear combination of Bloch functions φμ(r,k) defined in terms of local functions φμ(r), normally referred as atomic orbitals. The local functions are expressed as linear combination of certain number of individually normalized Gaussian type functions. In the present calculations, the local functions of Cu were constructed from the 86-4111G basis sets [30]. Two correlation functionals namely the generalized gradient approximation proposed by Perdew and Wang (PW-GGA) [31] and von Barth and Hedin (vBH) [32] were considered and the exchange potential of Becke [33] was employed to generate the crystal Hamiltonian. The hybrid B3PW scheme [29,34,35] is also considered for copper. The B3PW scheme is very similar to the B3LYP [36], except that the PW-GGA correlation scheme is considered instead of the correlation scheme of Lee, Yang and Parr [37]. The optimization has been performed with fcc crystal structure ( -type) of copper with lattice constants a = 0.361 nm [1]. The integration in the reciprocal space has been carried out on a grid of 29 k points in the irreducible Brillouin zone. To achieve self-consis-tency 55 percent mixing of successive cycles was considered and the self-consistency was achieved within 14 cycles.
4. Results and Discussion
4.1. Compton Profiles
The isotropic experimental and theoretical (B3PW, PWGGA, vBH and HF) profiles of polycrystalline copper are presented for some selected values of pz ranging from 0 to +7 a.u in Table 1. Errors at a few points are also given. To examine the agreement between theory and experiment, the difference profiles (convoluted theory-experiment) are plotted in Figure 1. It is worthwhile to mention here that in order to compare the theoretical values with the experiment; the theoretical values have to be convoluted with the Gaussian function of FWHM 0.6 a.u. and normalized to 12.473 electrons in the momentum range 0 to +7 a.u. The figure reveals that in the low momentum region i.e. 0.0 < pz < 0.8 a.u. the momentum density predicted by HF is lower than the measurement whereas momentum density predicted by other LCAO based calculations are higher than the experiment. In the intermediate region 0.8 < pz < 1.8 a.u., all the theoretical data provide higher momentum density than the measurement. The maximum differences shown by the B3PW, PWGGA, vBH and HF with our experimental J(0) are about 1.55%, 2.30%, 2.05% and 1.65% respectively. Beyond 4.0 a.u., all theories show similar trend. This is to be expected as this region is dominated by core electrons which largely remain unchanged on solid formation. To examine the overall agreement we computed and found that the B3PW scheme gives the best agreement with the experiment. In the inset of Figure 1, the difference between earlier and present measurement is also given. It can be seen that present data is in very good agreement with earlier measurement on copper [38]. Although slight differences in the low momentum region are seen which may perhaps be due to the modalities of data acquisition and reduction technique.
As d electrons are present in copper, it leads to some disagreement in the low momentum range (0.0 < pz < 2.0 a.u.). Thus, larger deviation seen in this region may probably be due to the inadequate treatment of d electrons in the LCAO calculations. As these electrons are large in number, the inclusion of electron-electron correlation effects by a better scheme like LP correction could be useful in bringing the theory closer to the experiment. Such a correction causes a shift of momentum density
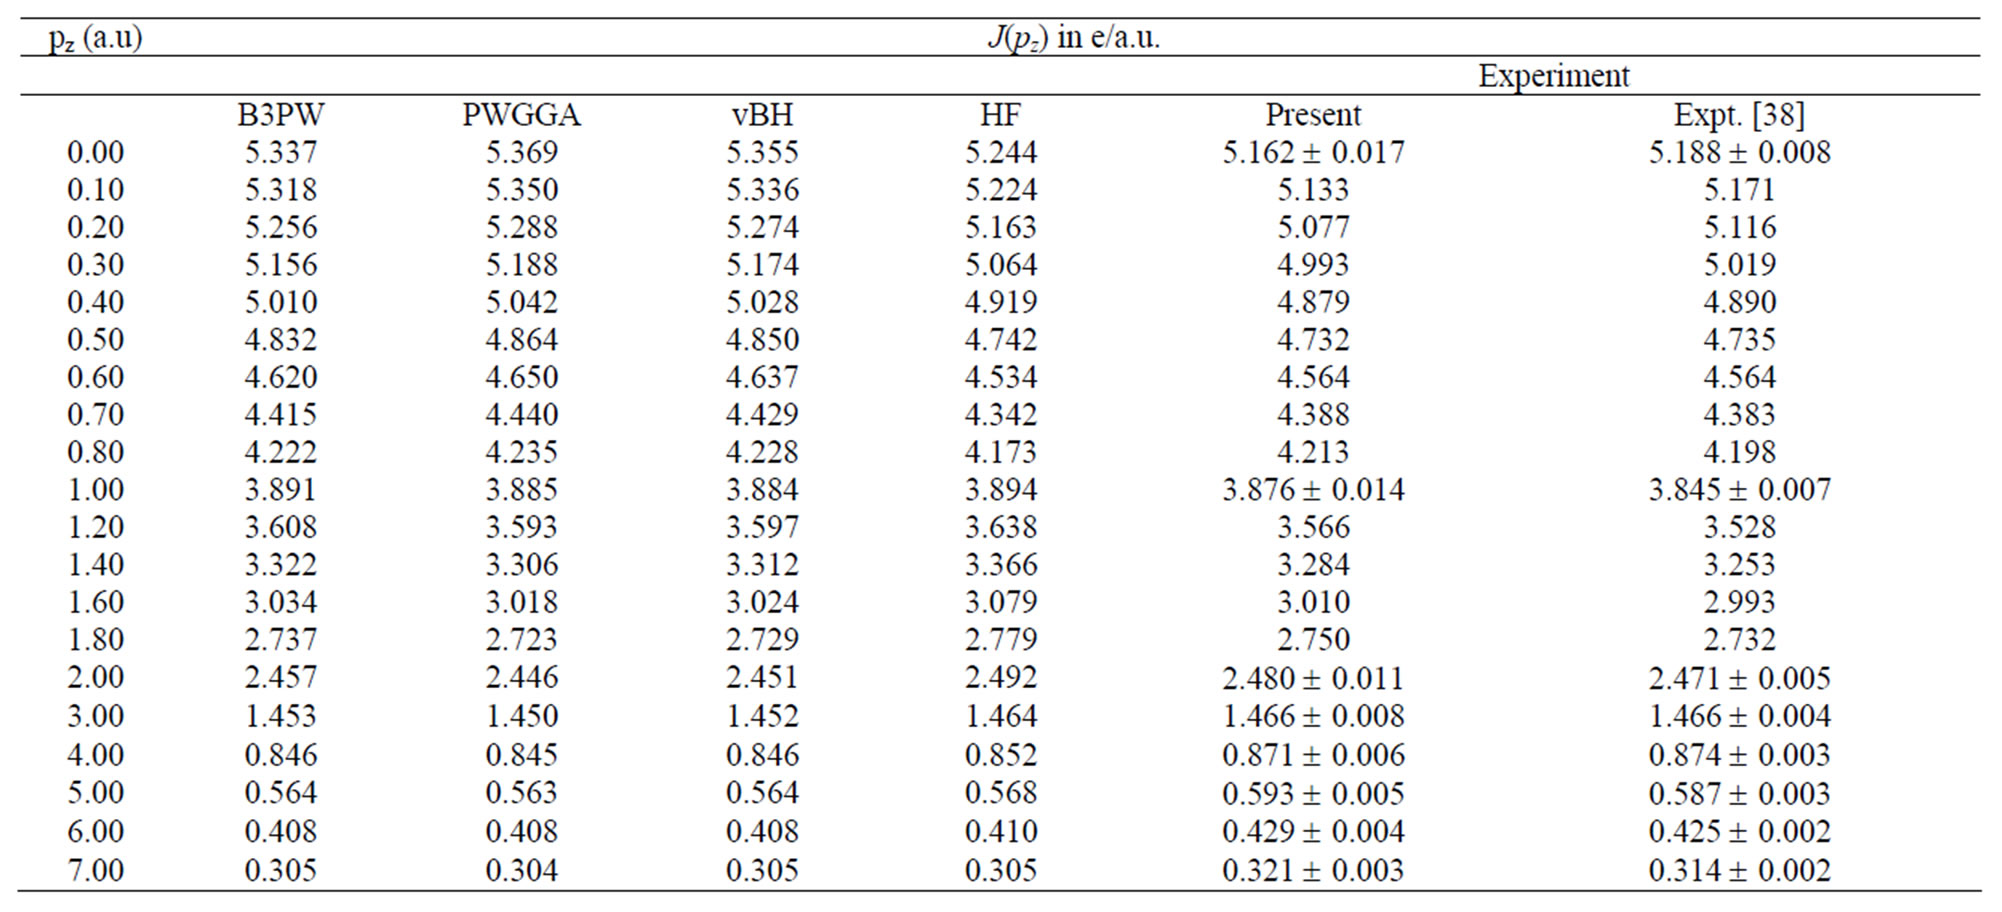
Table 1. The unconvoluted theoretical (B3PW, PWGGA, vBH and HF) Compton profiles of copper. Also given here present and earlier [38] experimental values. Experimental errors ( ) at few points are also given.
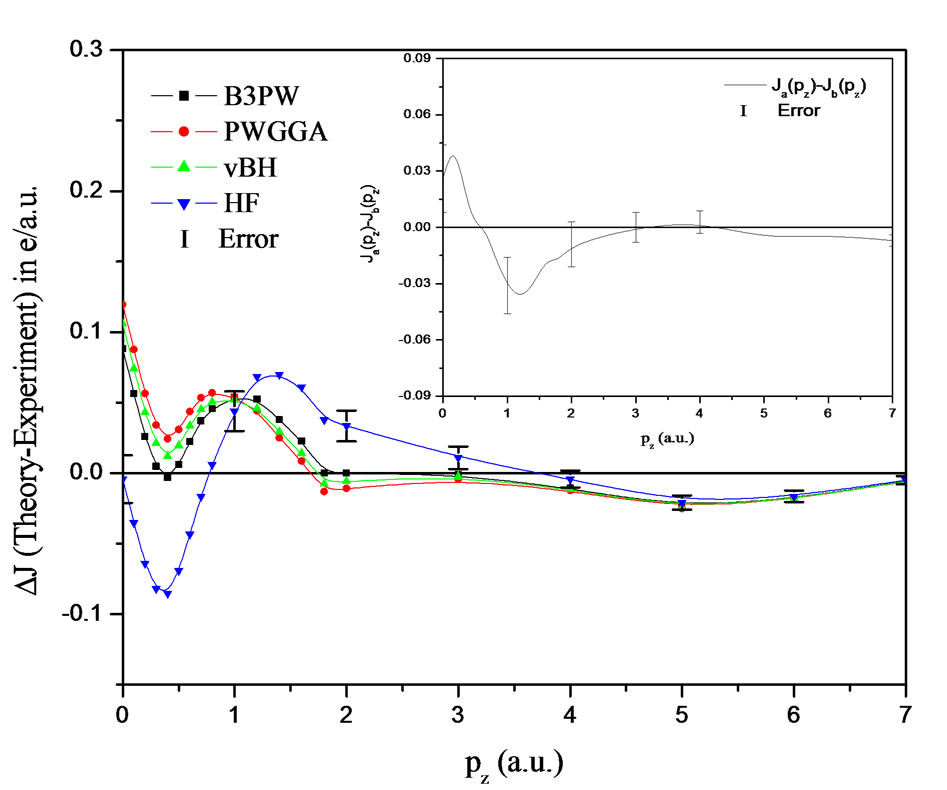
Figure 1. The difference between the theory (B3PW, PWGGA, vBH and HF) and experimental Compton profile of copper. The theoretical profiles are convoluted with a Gaussian of FWHM 0.6 a.u. to mimic the experimental resolution. The difference between earlier and present measurements ( ) is also presented in the inset.
around the Fermi momentum. As a consequence of normalization the agreement in the entire range may also improve then.
To examine the directional features theoretically, the directional Compton profiles of copper calculated along the three directions i.e. [100], [110] and [111] from hybrid B3PW scheme. All profiles were convoluted by a Gaussian function of 0.6 a.u. FWHM before deriving these anisotropies. In Figure 2, anisotropies [110]-[100], [110]-[111] and [111]-[100] for copper are plotted. The anisotropies corresponding to [110]-[100] and [110]-[111] are positive nature at pz = 0.0 a.u. It indicates large occupied states along [110] direction at pz = 0 a.u. In the momentum region (2.0 < pz <4.5 a.u.), the anisotropy [111]-[100] is very small because both the directions cut the [110] bond at roughly the same angle (45˚ and 35˚). Thus, the direction [110] is unique and also may be the direction of bonding in copper. All anisotropies are negligible in the high momentum region (pz > 4.5 a.u.) because the isotropic contribution due to core electrons dominates in determining the momentum densities in this region. The earlier measurements of Eisenberger and Reed [2] on copper along the principle directions [100], [110] and [111] confirm our scheme of computation and anisotropies.
4.2. Autocorrelation Function
To predict the metallic behavior in copper, we have deduced the Compton profile yields in real space. It is
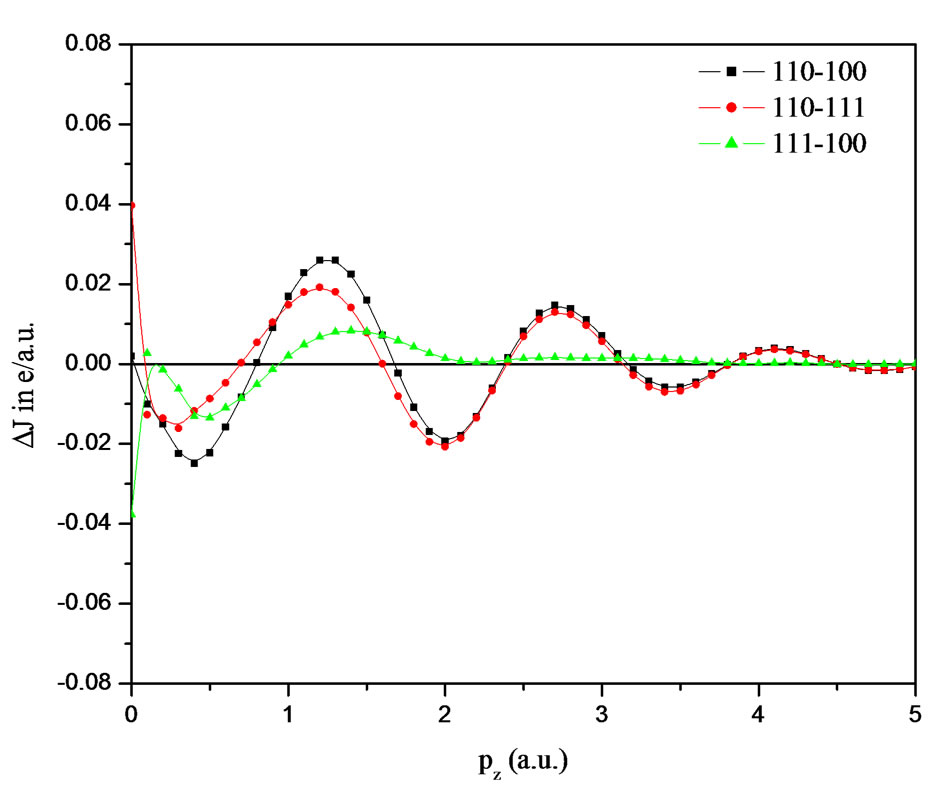
Figure 2. Compton profile anisotropies [110-100], [110-111] and [111-100] for copper. The anisotropies are computed following the B3PW hybrid scheme. All anisotropies are obtained from convoluted directional Compton profiles.
known that the consideration of the Fourier transform of the Compton profile, rather than the profile itself enables to circumvent the difficulties like relatively poor resolution, multiple scattering etc. [39]. This one-dimensional Fourier transform of the Compton profile that yields accurate information around the Fermi momentum of simple metallic systems is given by
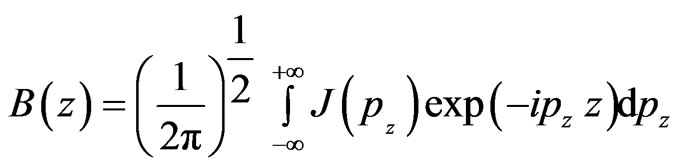 (2)
(2)
For a free electron gas, the parabolic Compton profile has a zero value at the Fermi momentum. Corresponding to unit area of the parabola, the B(z) function is given by
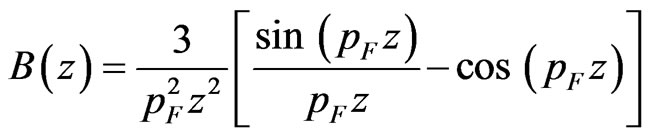 (3)
(3)
So, for a free-electron based Compton profile, B(z) is zero for  = 4.493, 7.725, 10.904, 14.066…………. Further, the inclusion of core contribution does not change the position of the zero crossings of B(z) function. In Figure 3, the B(z) function of copper derived from the experimental valence (experiment-convoluted core) has been plotted. A similar approach was successful in predicting the free-electron like behavior of a-Ga [40]. From Figure 3, it is seen that the B(z) curve cut horizontal axis at z = 5.58 a.u. From this first cut, the
  value comes to be 0.80 a.u., which is close to theoretical value 0.72 a.u. obtained from the free electron model calculation. Thus, the agreement between the free electron and the experimental value of
  indicates the metal-like character of copper.
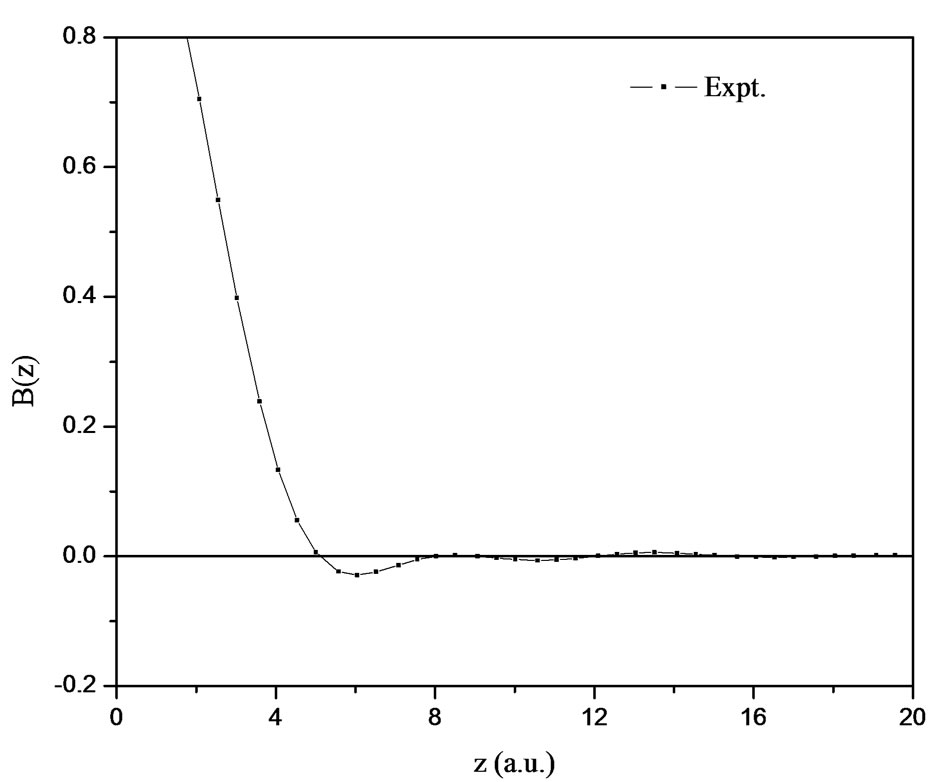
Figure 3. The autocorrelation i.e. B(z) function derived from experimental valence (experiment-convoluted core). Here z is the direction of scattering vector.
4.3. X-Ray Structure Factors
The static structure factors are very useful in analyzing the X-ray diffraction data, charge density, and thereby charge transfer and the bonding in solids [41]. The structure factors are also derived from the ground state charge density distribution in solids. One can obtain the structure factors S(k), for a given reflection line identified by [hkl] using the following relation:
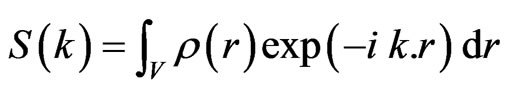 (4)
(4)
where the integration is performed over the unit cell giving total number of electrons in the unit cell for k = 0.
In Table 2, the static structure factors for a few reflection lines of copper are presented. Column 2-5 contain the earlier experimental structure factors derived from Bragg gamma-ray diffraction [18,20], QCBED measurement [22] and electron diffraction [21]. In column 6-9 we list the calculated structure factors of Wakoh and Yamashita [16], Bagayoko et al. [17], and Eckardt et al.
[19], together with the free atom values of Doyle and Turner [15] for neutral copper. The X-ray structure factors deduced from hybrid B3PW scheme are listed in last column. These numbers are not processed with the multipole refinement procedure and correction due to thermal effects. The differences from the neutral atom [15] suggest reorganization of charge density on solid formation. The B3PW scheme underestimates the structure factors unlike predicted by Doyler and Turner [15] for neutral copper up to [220] plane but beyond [220] reverse trend is visible. The structure factors computed by Eckardt et al. [19] are larger than B3PW for all reflection lines and all other experimental and theoretical values are lower than the present data. Inclusion of correction factor due to thermal effects may probably improve the agreement. Thus, there is enough scope for experiments with high statistical accuracy at synchrotron radiation facilities which would provide more accurate structure factors enabling rigorous comparison.
5. Conclusions
Compton profile and structure factors of polycrystalline fcc-copper have been discussed in this work. The measurement on copper is compared with the LCAO based B3PW, PWGGA, vBH and HF calculations. All theoretical values are in good agreement with the measurement. However, B3PW scheme shows best agreement with the experiment. The structure factors computed using B3PW scheme are in good agreement with the available experimental and theoretical data. To compare the CRYSTAL06 code based densities, the computation of Compton profiles from other band structure schemes might be needed.
6. Acknowledgements
This work is financially supported by the University Grant Commission (UGC) through Emeritus Fellowship, SR/33-37/2007 to BKS and SR/39-982/2010 to GS. Authors are also thankful to Centre for Education and Research in Basic Sciences, Banasthali University for providing research facilities.
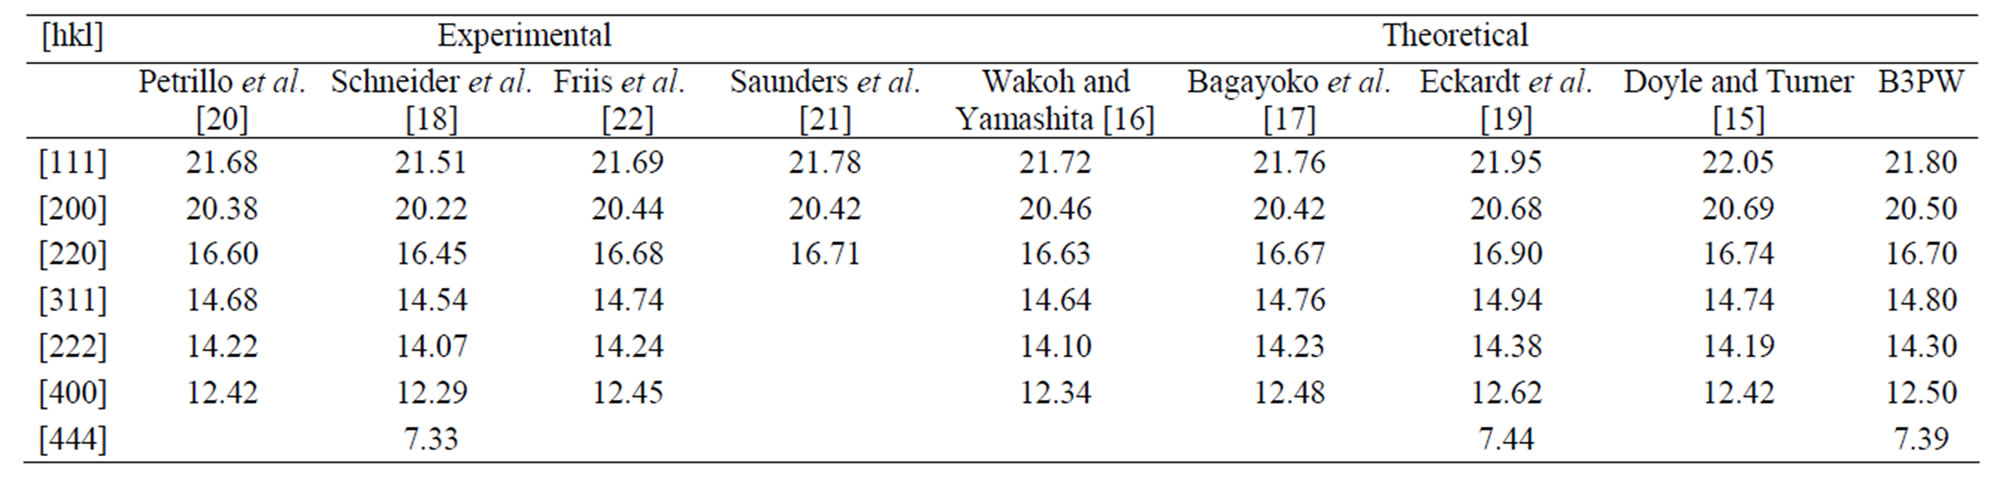
Table 2. The experiment and theoretical X-ray structure factors of copper. Our B3PW results are also given here, which are neither corrected for the temperature effects nor processed for multiple refinement.
REFERENCES
- C. Y. Fong and M. L. Cohen, “Energy Band Structure of Copper by the Empirical Pseudopotential Method,” Physical Review Letters, Vol. 24, 1970, pp. 306-309. HHUUdoi:10.1103/PhysRevLett.24.306UU
- P. Eisenberger and W. A. Reed, “Gamma-Ray Compton Profiles of Copper and Nickel,” Physical Review B, Vol. 9, No. 8, 1974, pp. 3242-3247. HHUUdoi:10.1103/PhysRevB.9.3242UU
- D. G. Kanhere and R. M. Singru, “Electron Momentum Distribution in Nickel and Copper Employing a Renormalized Free Atom Model,” Journal of Physics F: Metal Physics, Vol. 5, No. 6, 1975, pp. 1146-1154. HHUUdoi:10.1088/0305-4608/5/6/017UU
- P. Pattison, N. K. Hansen and J. R. Schneider, “Anisotropy in the Compton Profile of Copper,” Zeitschrift für Physik B Condensed Matter, Vol. 46, No. 4, 1982, pp. 285-294. HHUUdoi:10.1007/BF01307702UU
- H. Bross, “Band Structure Calculation of the Momentum Density and Compton Profile of Copper,” Journal of Physics F: Metal Physics, Vol. 12, 1982, pp. 2249-2266. HHUUdoi:10.1088/0305-4608/12/10/018UU
- R. Courths, B. Cord, H. Wern and S. Hufner, “AngleResolved Photoemission and Band Structure of Copper,” Physica Scripta, Vol. 1983, No. T4, pp. 144-147. HHUUdoi:10.1088/0031-8949/1983/T4/031UU
- G. E. W. Bauer and J. R. Schneider, “Density-Functional Theory of the Compton Profile Anisotropy of Copper Metal,” Zeitschrift für Physik B Condensed Matter, Vol. 54, No. 1, 1983, pp. 17-24. HHUUdoi:10.1007/BF01507944UU
- G. E. W. Bauer and J. R. Schneider, “Nonlocal Exchange-Correlation Effects in the Total Compton Profile of Copper Metal,” Physical Review Letters, Vol. 52, No. 23, 1984, pp. 2061-2064. HHUUdoi:10.1103/PhysRevLett.52.2061UU
- G. E. W. Bauer and J. R. Schneider, “Electron Correlation Effect in the Momentum Density of Copper Metal”, Physical Review B, Vol. 31, No. 2, 1985, pp. 681-692. UUdoi:10.1103/PhysRevB.31.681
- C. Petrillo and F Sacchetti, “Electron-Electron Interaction and Single-Particle Properties in Copper. II. Compton Profile,” Journal of Physics F: Metal Physics, Vol. 15, No. 1, 1985, pp. 91-99. HHUUdoi:10.1088/0305-4608/15/1/013UU
- M. V. Heller and J. R. Moreira, “Compton-Profile Measurements for W, Ag, and Cu with 662-keV γ Rays,” Physical Review A, Vol. 33, No. 4, 1986, pp. 2391-2395. HHUUdoi:10.1103/PhysRevA.33.2391UU
- Ch. N. Chang, L. K. Ngai and B. Li, “The Experimental Compton Profile of Cu, Zn, Cd, Ta, and Au,” Chinese Journal of Physics, Vol. 27, No. 6, 1989, pp. 461.
- A. Marini, G. Onida and R. D. Sole, “Quasiparticle Electronic Structure of Copper in the GW Approximation,” Physical Review Letters, Vol. 88, No. 1, 2002, pp. 016403-014407. HHUUdoi:10.1103/PhysRevLett.88.016403UU
- A. Winkelmann, W.-C. Lin, Ch.-T. Chiang, F. Bisio, H. Petek and J. Kirschner, “Resonant Coherent Three-Photon Photoemission from Cu(001),” Physical Review B, Vol. 80, No. 15, 2009, pp. 155128-155137. HHUUdoi:10.1103/PhysRevB.80.155128UU
- P. A. Doyle and P. S. Turner, “Crystal Physics, Diffraction, Theoretical and General Crystallography,” Acta Crystallographica Section A, Vol. 24, Part 3, 1968, pp. 390-397. HHUUdoi:10.1107/S0567739468000756UU
- S. Wakoh and J. Yamashita, “Theoretical Form Factors of 3D Transition Metals,” Journal of the Physical Society of Japan, Vol. 30, 1971, pp. 422-427. HHUUdoi:10.1143/JPSJ.30.422UU
- D. Bagayoko, D. G. Laurent, S. P. Singhal and J. Callaway, “Band Structure, Optical Properties, and Compton Profile of Copper,” Physical Review A, Vol. 76, No. 2, 1980, pp. 187-190. HHUUdoi:10.1016/0375-9601(80)90609-XUU
- J. R. Schneider, N. K. Hansen and H. Kretschmer, “Crystal Physics, Diffraction, Theoretical and General Crystallography,” Acta Crystallographica Section A, Vol. 37, Part 5, 1981, pp. 711-722. HHUUdoi:10.1107/S0567739481001599UU
- H. Eckardt, L. Fritsche and J. Noffke, “Self-Consistent Relativistic Band Structure of the Noble Metals,” Journal of Physics F: Metal Physics, Vol. 14, No. 1, 1984, pp. 97-112. HHUUdoi:10.1088/0305-4608/14/1/013UU
- C. Petrillo, F. Sacchetti and G. Mazzone, “Foundations of Crystallography,” Acta Crystallographica Section A, Vol. 54, Part 4, 1998, pp. 468-480. HHUUdoi:10.1107/S0108767398001548UU
- M. Saunders, A. G. Fox and P. A. Midgley, “Foundations of Crystallography,” Acta Crystallographica Section A, Vol. 55, Part 3, 1999, pp. 480-488. HHUUdoi:10.1107/S0108767398016316UU
- J. Friis, B. Jiang, J. C. H. Spence and R. Holmestad, “Quantitative Convergent Beam Electron Diffraction Measurements of Low-Order Structure Factors in Copper,” Microscopy and Microanalysis, Vol. 9, No. 5, 2003, pp. 379-389. HHUUdoi:10.1017/S1431927603030319UU
- M. J. Cooper, “Compton Scattering and Electron Momentum Determination,” Reports on Progress in Physics, Vol. 48, No. 4, 1985, pp. 415-481. HHUUdoi:10.1088/0034-4885/48/4/001UU
- R. Dovesi, V. R. Saunders, C. Roetti, R. Orlando, C. M. Zicovich-Wilson, F. Pascale, B. Civalleri, K. Doll, N. M. Harrison, I. J. Bush, Ph. D’Arco and M. Llunell, “Crystal 06 User’s Manual,” University of Torino, Torino, 2006.
- B. K. Sharma, A. Gupta, H. Singh, S. Perkkiö, A. Kshirsagar and D. G. Kanhare, “Reports on Progress in Physics Compton Profile of Palladium,” Physical Review B, Vol. 37, No. 12, 1988, pp. 6821-6826. HHUUdoi:10.1103/PhysRevB.37.6821UU
- D. N. Timms, “Compton Scattering Studies of Spin and Momentum Densities,” Ph.D. Thesis, University of Warwick, England, 1989.
- J. Felsteiner, P. Pattison and M. J. Cooper, “Effect of Multiple Scattering on Experimental Compton Profiles: A Monte Carlo Calculation,” Philosophical Magazine, Vol. 30, No. 3, 1974, pp. 537-548. HHUUdoi:10.1080/14786439808206579UU
- F. Biggs, L. B. Mandelsohn and J. B. Mann, “Hartree-Fock Compton Profiles for the Elements,” Atomic Data and Nuclear Data Tables, Vol. 16, No. 3, 1975, pp. 201-309. HHUUdoi:10.1016/0092-640X(75)90030-3UU
- C. Pisani, R. Dovesi and C. Roetti, “Hartree Fock Ab Initio Treatment of Crystalline Systems (Lecture Notes in Chemistry),” Springer-Verlag, Berlin, 1988.
- http://www. crystal. unito. it/Basis sets/Copper. html
- J. P. Perdew and Y. Wang, “Accurate and Simple Analytic Representation of the Electron-Gas Correlation Energy,” Physical Review B, Vol. 45, No. 23, 1992, pp. 13244-13249. HHUUdoi:10.1103/PhysRevB.45.13244UU
- U. von Barth and L. Hedin, “A Local Exchange-Correlation Potential for the Spin Polarized Case. I,” Journal of Physics C: Solid State Physics, Vol. 5, No. 13, 1972, pp. 1629-1642. HHUUdoi:10.1088/0022-3719/5/13/012UU
- A. D. Becke, “Density-Functional Exchange-Energy Approximation with Correct Asymptotic Behavior,” Physical Review A, Vol. 38, No. 6, 1988, pp. 3098-3100. HHUUdoi:10.1103/PhysRevA.38.3098UU
- J. P. Perdew, “Electronic Structure of Solids 1991,” Akademie Verlag, Berlin, 1991.
- A. D. Becke, “Density-Functional Thermochemistry. III. The Role of Exact Exchange,” The Journal of Chemical Physics, Vol. 98, No. 7, 1993, pp. 5648-5652. HHUUdoi:10.1063/1.464913UU
- X. -B. Feng and N. M. Harrison, “Electronic Structure of CaCuO2 from the B3LYP Hybrid Density Functional,” Physical Review B, Vol. 69, No. 12, 2004, pp. 132502- 132506. HHUUdoi:10.1103/PhysRevB.69.132502UU
- C. Lee, W. Yang and R. G. Parr, “Development of the Colle-Salvetti Correlation-Energy Formula into a Functional of the Electron Density,” Physical Review B, Vol. 37, No. 2, 1988, pp. 785-789. HHUUdoi:10.1103/PhysRevB.37.785UU
- R. Benedek, R. Prasad, S. Manninen, B. K. Sharma, A. Bansil and P. E. Mijnarends, “Compton Profiles for Polycrystalline CuxNi1-x Alloys: Theory and Experiment,” Physical Review B, Vol. 32, No. 12, pp. 7650-7658. UUdoi:10.1103/PhysRevB.32.7650
- P. Pattison, N. K. Hansen and J. R. Schneider, “Identifying the Bonding in Diamond and Silicon Using Compton Scattering Experiments,” Chemical Physics, Vol. 59, No. 3, 1981, pp. 231-242. HHUUdoi:10.1016/0301-0104(81)85166-XUU
- R. Jain, B. L. Ahuja and B. K. Sharma, “DensityFunctional Thermochemistry. III. The Role of Exact Exchange,” Indian Journal of Pure & Applied Physics, Vol. 42, 2004, pp. 43-48.
- P. Coppens, “X-Ray Charge Density and Chemical Bonding,” Oxford University Press, Oxford, 1997.