Atmospheric and Climate Sciences
Vol.4 No.2(2014), Article ID:44465,7 pages DOI:10.4236/acs.2014.42019
A Unique Case-Study of Near-Circular Saharan Dust Transport over the Atlantic Ocean
Joseph Barkan, Pinhas Alpert
Department of Geophysics, Planetary and Atmospheric Sciences, Tel-Aviv University, Israel
Email: Yossib@post.tau.ac.il
Copyright © 2014 by authors and Scientific Research Publishing Inc.
This work is licensed under the Creative Commons Attribution International License (CC BY).
http://creativecommons.org/licenses/by/4.0/


Received 1 January 2014; revised 1 February 2014; accepted 8 February 2014
ABSTRACT
An occurrence of transportation of Saharan dust from equatorial West African and back to Europe and Africa around the Atlantic Ocean was synoptically analyzed. The entire circle around the Atlantic took twelve days. The direction and speed of the dust cloud was governed by the position, the strength and the movement of the Center of Activity (COA) of the Azores High. This type of trajectory is quite rare. In the year 2009 (the year of the analyzed trajectory) it occurred only 8 times. We assume, that the interesting point in this type of trajectory is the possibility that in its long way, it collects from and deposits in, different types of aerosols at the American European and African continents and the Ocean between them.
Keywords:Dust; Azores High; Transportation

1. Introduction
A huge amount of mineral dust enters the atmosphere every year and reaches every corner of the globe. Almost all the dust is emitted from the deserts of the Northern Hemisphere located in a relatively narrow band along the 30˚N parallel, from Western Africa through the Sahara, the Middle East, Central Asia and to the shores of the Pacific Ocean and then in the desert of the Southwest US (Prospero 2002 [1] ). The Saharan desert is the most important source of the dust. The transport of dust from the Sahara to the Atlantic Ocean is a common phenomenon especially in the summer months (Prospero et al. 1981 [2] ). According to Chiapello et al. [3] (1997), 300 - 700 Tg (teragram) per year are emitted from this area into the atmosphere. According to Prospero [4] (1996) 170 Tg/y are transported into the Atlantic Ocean and 25 Tg/y transported toward the Mediterranean and Europe. Kaufman et al. [5] , using the MODIS (MODerate-resolution Imagining Spectroradiometer) aboard the satellites Terra and Aqua estimated that 230 ± 80 Tg/y of dust are transported annually from the Sahara into and across the Atlantic Ocean. 45 ± 15 Tg/y from this amount reaches the American continent. About 30 ± 10 Tg/y turns back toward Europe and Africa.
The dust is elevated by convective disturbances due to the strong heating of the soil, especially in the summer months, to great heights up to 5 - 7 km and then transported by disturbances embedded in the trade winds from east to west (Prospero 2001 [6] ).
The actual transportation of the dust is influenced, mainly, by the Azores High. Its position, strength and center of action (COA) determine the direction and the speed of the transportation (Doherty et al. 2008 [7] ).
In this case study we want to analyze a special case in which the dust left the African continent approximately at 16˚N in 31 July 2009, made a nearly full turn around the Atlantic Ocean and reached Europe in 10 days and Northern Africa in 12 days (figure 1). It is possible that along its trajectory it deposited part of its load and collected different types of aerosols like industrial particles from North America and Europe and marine salt particles from the Atlantic.
2. Methodology
The forward trajectory was computed with the NOAA HYSPLIT model.
According to the HYSPLIT model, The trajectory was divided into five sections: 1) near the starting point in Africa, 2) along the southern flank of the Azores High westward, 3) along the American coast northeastward, 4) along the northern flank of the Azores High eastward, 5) between the eastern flank of the Azores High and a trough along the European coast and into Northern Africa—southward.
Average synoptic maps at 700 hPa were prepared for the area 10˚N - 70˚N, 90˚W - 30˚E; A map for the whole trajectory and one for each section. In every map the point the dust cloud reached every day, according to the HYSPLIT model, was marked by a full square.
3. Discussion
This work is based on the assumption that the dust is carried by the air-mass transport and therefore the Hysplit result (figure 1) shows, approximately, the location of the dust cloud.
The exact location of the dust cloud and the AOT every day is shown in table 1. It is evident that the AOT is very high in the first day and decreasing slowly in the next two days and increasing in the fifth and sixth days when the cloud is approaching the Caribbean. It becomes high again in the ninth day when the cloud is in the middle of the Atlantic against Canada. Presumably, the additional aerosols mass comes from the west although it is possible that its source is from sea salt aerosols.
Table 2 shows the speed of the dust cloud every day. One can see that it is very slow at the southern section of the trajectory and very fast in the northern section.
Synoptic analysis for the whole trajectory and every section is shown below:
Figure 2 shows the whole circular trajectory day after day marked by filled squares. The Azores High dominates the whole width of the Southern Atlantic between 20˚N - 40˚N. It is clear that the dust cloud is driven by this synoptic system. Two Low centers to the north, one in Eastern Canada and the other around Iceland cause steep gradient and strong winds west and north of the AH. A well defined trough along the European coast turns the dust cloud southeastward toward Northern Africa.
Figure 3 shows the synoptic situation in the first day of the dust cloud's movement which is quite like the whole average in map 2. The cloud's movement is relatively fast due the strong flow at its back in the African continent.
Figure 4 deals with the next four days of the dust cloud’s movement. The AH develops two centers; a western one near the Americas and an Eastern one in Northern Africa. To the north the two Lows are deepening. The dust cloud moves very slowly, due to the weak flow at the southern flank of the AH.
Figure 5 Due to strengthening of the western wing of the AH and the deepening of the northern Low, the flow between them became stronger. Consequently, the dust cloud in the days 6 and 7 turned to the north along the western flank of the AH (Map 5)
Figure 6 In the days 8 and 9 of the cloud’s journey the COA of the AH moved to the east, steepening the gradient to the north of it. Consequently, the cloud accelerated covering a considerable distance in these two days.
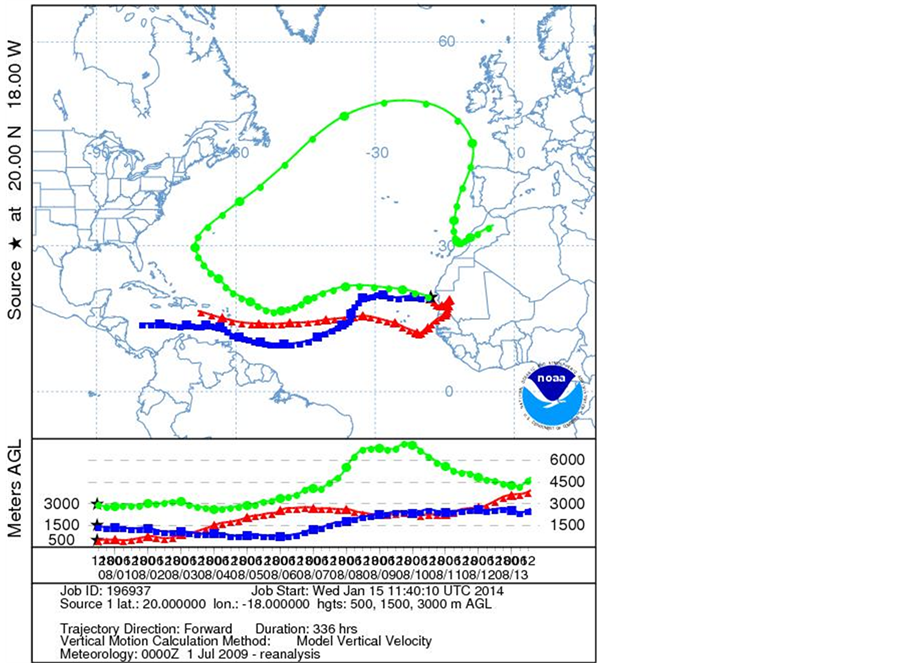
Figure 1. NOAA HYSPLIT MODEL forward trajectories starting at 1100 UTC 31 Jul 09 CDC1 meteorological data.

Table 1. Saharan aerosol transport around the atlantic ocean.
West of the AH a trough is deepening along the European coast (Map 6).
Figure 7 shows further movement of the AH to the east and considerable deepening of the trough west of it, to the south along the African coast. The cloud in days 10-11 turned southward into the fast flow between the AH and the western trough advancing southward from latitude 45N to latitude 30N in one day. Between the days 11 and 12 the cloud slowed down rounding the southern edge of the trough turning to the east and entering back Africa. It is worth mentioning that according to this map it is possible that part of the dust entered Northern Europe with the strong westerly flow along latitude 50N.
Table 2. Speed of the dust cloud (km/hour).
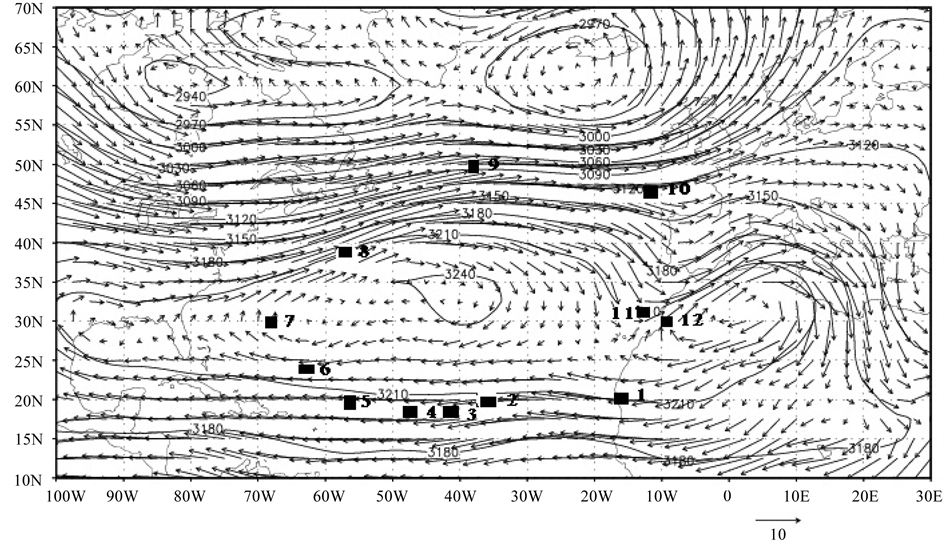
Figure 2. Mean synoptic map—days 1 to 12.
4. Conclusions
A relatively rare happening of the Saharan dust transported westward across the Atlantic Ocean and back toward Europe was investigated. This circular track was determined by the position and height of the Azores High determining the direction and the speed of the flow. For instance, the eastern flow at the southern flank of the AH is quite smooth and slow due to the relatively uniform AH in the southern Atlantic. Consequently, the dust was transported westward almost to the American continent but quite slowly. The journey took six days. The closed high which developed opposite the American shore caused southern flow along its western side taking with it the dust northward. To cover this, relatively short, section took two days in a slightly higher speed of the flow due to gradient developed between the closed high in the east and the American continent in the west. On the northern side of the AH a strong westerly flow developed because of the steep gradient between the AH and low pressure to the north. To the dust, entering this strong flow took only two days to cross the Atlantic and reach the European coast. Meantime, the closed high moved back to the east causing southern flow along its eastern
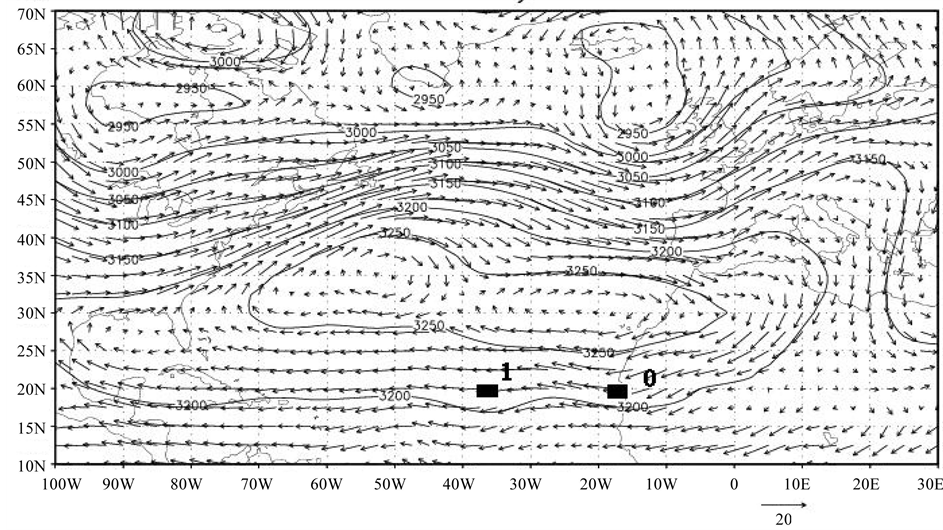
Figure 3. Mean synoptic map of days 0 and 1. The dust cloud is in the vicinity of the African continent.
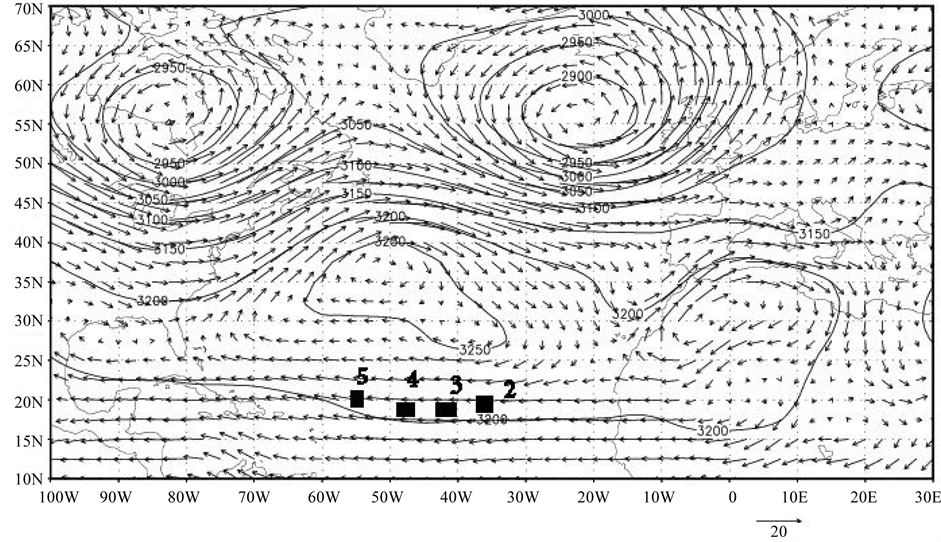
Figure 4. Mean synoptic map—days 2 to 5. The dust cloud is at the southern flank of the Azores High.
side. Consequently, the dust moving with the flow turned southward and, presumably, ended its journey in the North African coast.
The importance of this kind of track is by the possibility, along its route the dust cloud originated in the Sahara collects and deposits different kinds of aerosol. For instance, it deposits dust in the Caribbean and South America but collects particles from the industrial eastern coast of the US and Canada. In its way across the
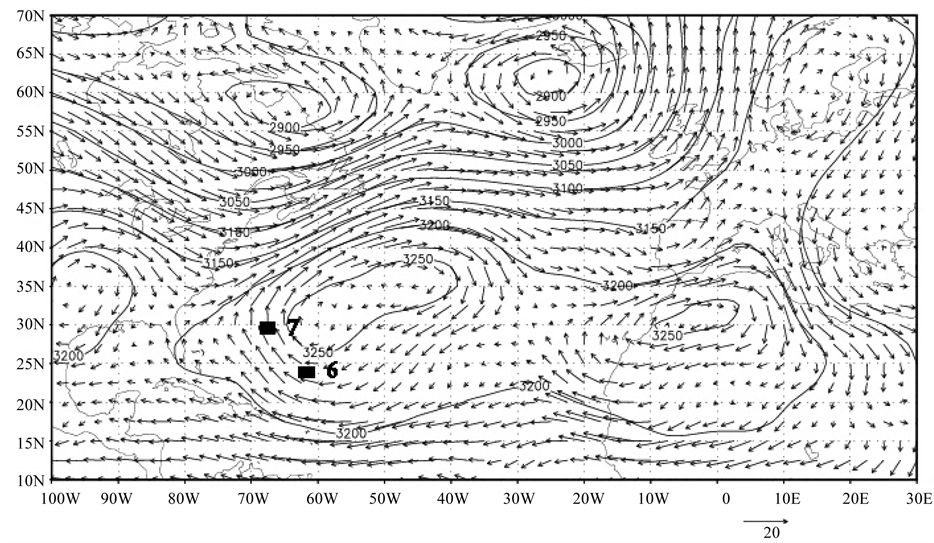
Figure 5. Mean synoptic map—days 6-7. The dust cloud turns to the north along the American coast.
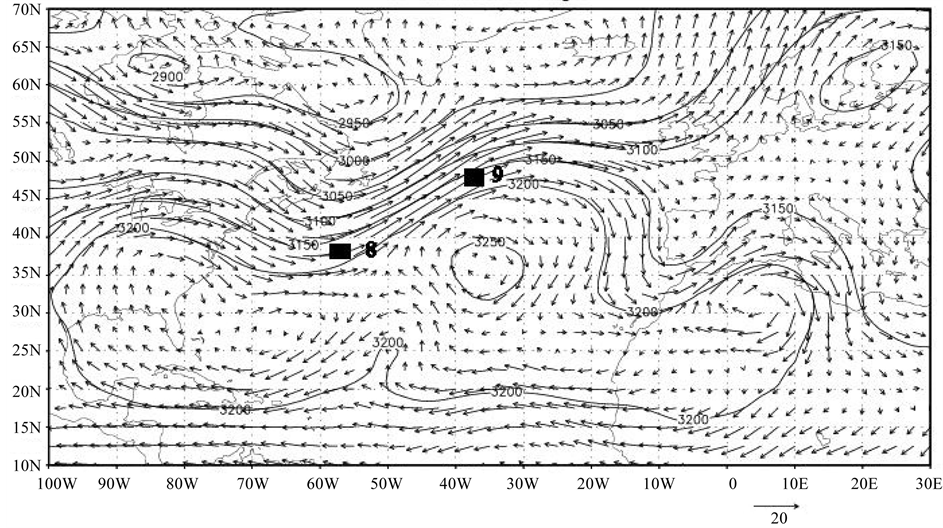
Figure 6. Mean synoptic map—days 8-9. The dust cloud moves fast to the east along the northern flank of the Azores High.
Southern Atlantic and back across the Northern Atlantic it collects sea salt particles and near Europe it absorbs, again, polluted particles. This cocktail it deposits in Western Europe and Northwestern Africa.
To sum up this study: The transportation of aerosols across the Atlantic Ocean from the African continent is influenced chiefly by the position, the movement and the strength of the Azores High, and partly by the depth of the low to the north.
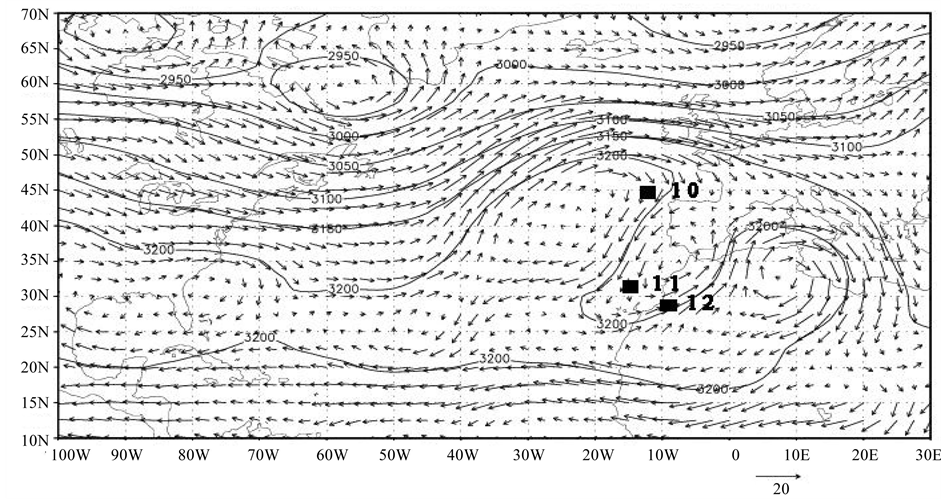
Figure 7. Mean synoptic map—days 10-12. The dust cloud turns to the south between the Azores High and a trough along the European coast and reaches Africa.
Our assumption is that along its route this Saharan dust cloud is able to collect and deposit various kinds of aerosols and thus influences the environment in both sides of the Atlantic Ocean.
References
- Prospero, J.M., Ginoux, P., Torres, O., Nicholson, S.H. and Gill, T.E. (2002) Environmental Characterization of Global Sources of Atmospheric Soil Dust Identified with the Nimbus 7 Total Ozone Mapping Spectrometer (TOMS) Absorbing Aerosol Product. Rewievs of Geophysics, 40, 2-1-2-31.
- Prospero, J.M., Glaccum, R.A. and Nees, R.T. (1981) Atmospheric Transport of Soil Dust from Africa to South America. Nature, 289, 570-572. http://dx.doi.org/10.1038/289570a0
- Chiapello, J., Bergametti, G., Chatetnet, B., Bosquet, P., Dulac, F. and Santos Guares, E. (1997) Origins of the African Dust Transported over the Northeastern Tropical Atlantic. Journal of Geophysical Research, 102, 13701-13709. http://dx.doi.org/10.1029/97JD00259
- Prospero, J.M. (1996) Saharan Dust Transport over the North Atlantic Ocean and the Mediterranean: An Overview. In: Guerzoni, S. and Chester, R., Eds., The Impact of Desert Dust Across the Mediterranean, Springer, Netherlands, 133- 151. http://dx.doi.org/10.1007/978-94-017-3354-0_13
- Kaufman, Y.J., Koren, I., Remer, L.A., Tanre, D., Ginoux, P. and Fan, S. (2005) Dust Transport and Deposition Observed from the TERRA-MODIS Spacecraft over the Atlantic Ocean. Journal of Geophysical Research, 110, DOS12. http://dx.doi.org/10.1029/2003JD004436
- Prospero, J.M. (2001) African Dust in America. Geotimes. Earth Energy and Environment News.
- Doherty, O.M., Riemer, N. and Hameed, S. (2008) Saharan Mineral Dust Transport into the Carribean: Observed Atmospheric Controls and Trends. Journal of Geophysical Research, 113, Article ID: D07211.