Atmospheric and Climate Sciences
Vol. 3 No. 3 (2013) , Article ID: 33655 , 9 pages DOI:10.4236/acs.2013.33030
Study of the Oceanic Heat Budget Components over the Arabian Sea during the Formation and Evolution of Super Cyclone, Gonu
Department of Atmospheric Sciences, Cochin University of Science and Technology, Cochin, India
Email: prjayakrishnan@gmail.com
Copyright © 2013 P. R. Jayakrishnan, C. A. Babu. This is an open access article distributed under the Creative Commons Attribution License, which permits unrestricted use, distribution, and reproduction in any medium, provided the original work is properly cited.
Received April 29, 2013; revised June 1, 2013; accepted June 10, 2013
Keywords: Oceanic Heat Budget; Cyclone; Arabian Sea
ABSTRACT
Oceans play a vital role in the global climate system. They absorb the incoming solar energy and redistribute the energy through horizontal and vertical transports. In this context it is important to investigate the variation of heat budget components during the formation of a low-pressure system. In 2007, the monsoon onset was on 28th May. A wellmarked low-pressure area was formed in the eastern Arabian Sea after the onset and it further developed into a cyclone. We have analysed the heat budget components during different stages of the cyclone. The data used for the computation of heat budget components is Objectively Analyzed air-sea flux data obtained from WHOI (Woods Hole Oceanographic Institution) project. Its horizontal resolution is 1˚ × 1˚. Over the low-pressure area, the latent heat flux was 180 Wm−2. It increased to a maximum value of 210 Wm−2 on 1st June 2007, on which the system was intensified into a cyclone (Gonu) with latent heat flux values ranging from 200 to 250 Wm−2. It sharply decreased after the passage of cyclone. The high value of latent heat flux is attributed to the latent heat release due to the cyclone by the formation of clouds. Long wave radiation flux is decreased sharply from 100 Wm−2 to 30 Wm−2 when the low-pressure system intensified into a cyclone. The decrease in long wave radiation flux is due to the presence of clouds. Net heat flux also decreases sharply to −200 Wm−2 on 1st June 2007. After the passage, the flux value increased to normal value (150 Wm−2) within one day. A sharp increase in the sensible heat flux value (20 Wm−2) is observed on 1st June 2007 and it decreased thereafter. Short wave radiation flux decreased from 300 Wm−2 to 90 Wm−2 during the intensification on 1st June 2007. Over this region, short wave radiation flux sharply increased to higher value soon after the passage of the cyclone.
1. Introduction
The Indian peninsula splits the north Indian Ocean into two basins, the Arabian Sea in the west and Bay of Bengal in the east. In 2007, an organized convection was formed on 28th May near southeastern Arabian Sea. Monsoon onset was declared on 28th May treating the organized convection as monsoon onset surge. This was converged into a well-marked low-pressure area and deepened further into a super cyclone, Gonu on 2nd June 2007. It is important to evaluate the different characteristics of ocean during the formation of a low-pressure system. Hence an attempt is made to study the different heat budget components during the formation of Gonu. A large number of studies were conducted about the heat budget during the past. Hareesh Kumar and Mathew [1]
examined the heat budget of the Arabian Sea and found that the heat storage of the sea is mainly controlled by heat change due to horizontal divergence and vertical motion while the effect of heat change due to lateral advection is much larger than expected. Shenoi et al. [2] studied the differences in heat budget of the near-surface Arabian Sea and the Bay of Bengal during summer monsoon season. The influence of heat, moisture and moist static energy budget, over the Arabian Sea and adjoining area (0˚N - 30˚N and 30˚E - 75˚E), during the onset and various epochs of Asian summer monsoon, has been analyzed in detail by Mohanty et al. [3]. Duing and Leetmaa [4] found that upwelling plays a significant role in cooling the surface layers of the Arabian Sea during southwest monsoon season. Molinari et al. [5] analyzed the relative importance of air sea fluxes and horizontal advection in the variability of sea surface temperature (SST) for the entire Arabian Sea. In the recent years there were some attempts to study the heat budget of the upper 200 m of the Arabian Sea either with limited datasets (Hasterrath and Lamb [6], Lamb and Bunker [7]; Hastenrath and Greischar [8]) or limited to specific region (Rao [9]; Varma and Kurup [10]). Hsuing et al. [11] estimated the annual cycle of heat storage and meridional heat transport in the world oceans.
Oceanic heat budget is the changes in heat stored in the upper layers of the ocean resulting from local imbalance between input and output of heat through the sea surface. The transfer of heat through the surface is called the heat flux. The symbol Q is used to represent the rate of heat flow (measured in Joules per second per square metre, i.e. Wm−2). Etter [12] estimated the heat budget using an empirical formula,

where QS is rate of oceanic heat storage; QF is the net air sea heat flux; QV is heat change due to horizontal divergence and vertical advection and QA is the heat change due to horizontal advection. Budyko [13] was the first to conduct a study on the spatial and temporal structure of the oceanic heat balance on a global scale. Hastenrath and Lamb [8,14,15] have used long term 1˚ × 1˚ averages of surface marine observations to establish a monthly high resolution climatology of the heat budget over parts of the tropical ocean. Oshima et al. [16] estimated the surface heat budget of the Sea of Okhotsk during 1987-2001 and the role of sea ice on it.
Halpern and Reed [17] estimated the heat budgets of the upper ocean under light winds. Hastenrath [6] derived the heat budget estimates for the global tropics from recent calculations of the oceanic heat budget and satellite measurements of net radiation at the top of the atmosphere. The local seasonal variation of heat content in the equatorial Atlantic Ocean is found to be about ten times larger than the seasonal variation of the heat gain from the atmosphere through the surface, and is not confined to the upper mixed layer [18]. This annual cycle of heat content appears to be mainly due to vertical movement of the thermocline associated with the dynamical response of the ocean to the seasonally varying winds. The Indian monsoon is partly driven by this air-sea interaction. Even though the broad scale features of the monsoon circulation are repetitive, the total monsoon problem, comprising the year-to-year fluctuations and vagaries in the onset as well as the time space variations in the monsoon activity, is very complex, and it demands intensive study and research [19]. Pisharoty [20]; Das [21] and Mohanty and Mohankumar [22] showed the importance of the energy fluxes over the Indian seas during different epochs of the summer monsoon activity over India. Mohanty et al. [23] emphasized the importance to understand the connection between the air-sea fluxes and monsoon activity rather than SST anomaly and the monsoon activity. They examined the oceanic heat budget components and their variability over the Indian Ocean in relation to the extreme monsoon activity (flood/drought) over the Indian sub continent using Comprehensive Oceanic and Atmospheric Data Set (COADS) for the period 1950-1979. Jayakrishnan and Babu [24] analysed the different surface marine atmospheric boundary layer parameters associated with the evolution of super cyclone Gonu in the Arabian Sea. They could quantify the variations in association with the passage of system. In this analysis, the variability of heat budget components during the evolution and subsequent intensification of Gonu over the Arabian Sea is studied.
2. Materials and Methods
The data used for the computation of heat budget components is Objectively Analyzed air-sea flux data obtained from WHOI (Woods Hole Oceanographic Institution) project. Its horizontal resolution is 1˚ × 1˚. The net heat budget equation used here is [1],

where QF is the net heat flux, QI is the incoming short wave radiation flux, QB is the effective outgoing long wave radiation flux, QH is the sensible heat flux and QE is the latent heat flux. In the above budget equation, QI contributes significantly to the oceanic heat gain whereas the other terms contribute towards the heat loss from tropical oceanic surfaces. The heat budget components employed for the study are Latent heat flux, Long wave radiation flux, Short wave radiation flux, Net flux and Sensible heat flux during the period of Gonu (26 May to 7 June, 2007). The evolution and intensification of the low pressure system during different stages are described below. Figure 1 represents track of the system from 26th May to 7th June 2007 (On the track, black circles represent the location of the system before intensification into a cyclone on a daily basis and blue circles represent that for cyclone, on a 6 hourly basis).
On 28th May, monsoon onset was declared by IMD and the onset surge further intensified into a low pressure system over the location 5˚N - 6˚N and 74˚E - 75˚E. The low developed into a depression and again intensified into a deep depression at the location 10˚N - 11˚N and 74˚E -75˚E. On 2nd June, it developed into a tropical cyclone with centre 15˚N - 16˚N and 69˚E -70˚E. It further intensified into a super cyclone Gonu on 3rd June 2007. It moved towards northwest and intensified during 4th and 5th June. At last the landfall occurred on 6th June 2007 in Oman coast (marked in the Figure) and after the landfall the system dissipated. Contours of heat budget components on a daily basis were analyzed from 26th May to 7th June 2007. Also, the area averaged heat
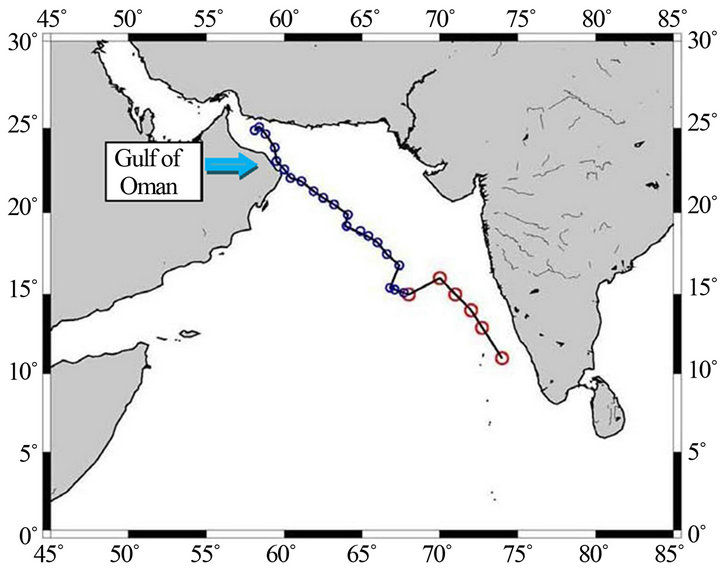
Figure 1. Track of cyclone Gonu from 28 May to 7 June.
budget components at the location of the system when it was deepened into a cyclone were studied. For the analysis of daily variation of heat budget components associated with the low pressure system, a special type of Hovmoller diagram is used in this study. The variation of the parameters at the centre of the low pressure system can be evaluated using this diagram. For this, we first identified the location of centre of the low pressure system on a daily basis during the period of the low pressure system from 26th May to 7th June (13 days). Daily values of heat budget components were extracted at these locations during the 13 days. Then a Hovmoller diagram is plotted with the X-axis as location of points of the low pressure system in the track up to landfall (total 28 points) and the Y-axis as the days starting from 26th May to 7th June. Table 1 contains the details of the locations in the track as obtained from Unisys weather.
3. Results and Discussions
3.1. Latent Heat Flux
On the onset date i.e. 28th May the latent heat flux value was about 200 Wm−2 over the oceanic region adjacent to south Indian peninsula (Figure 2). On 30th, it increased to 210 Wm−2. On 1st June, it intensified with value of 240 Wm−2. On 3rd and 4th June, the latent heat values increased to 300 Wm−2 as the system was intensified into a severe cyclonic storm. Landfall was occurred on 6th June and the flux values decreased abruptly. Figure 3 gives the Hovmoller diagram for Latent heat flux. The X-axis gives the location of points on the track of the system from the well marked low to the landfall. Y-axis gives the days starting from 26th May to 7th June. From the figure, it is clear that the system was intensified intosevere cyclonic storm on 4th, which is at the middle of the contour and the flux value became 220 Wm−2.
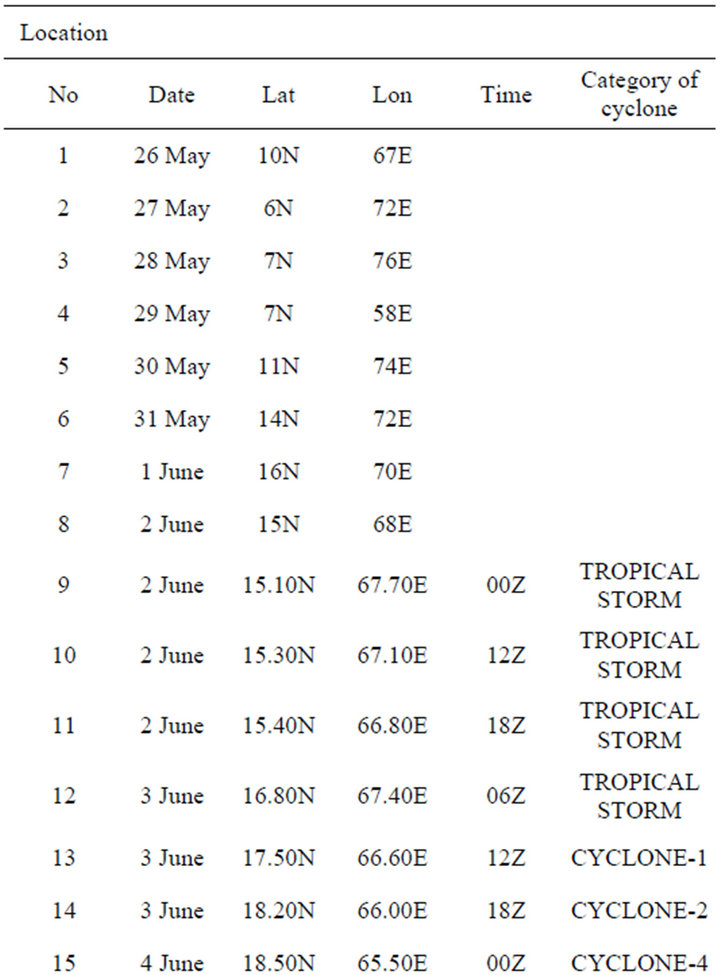
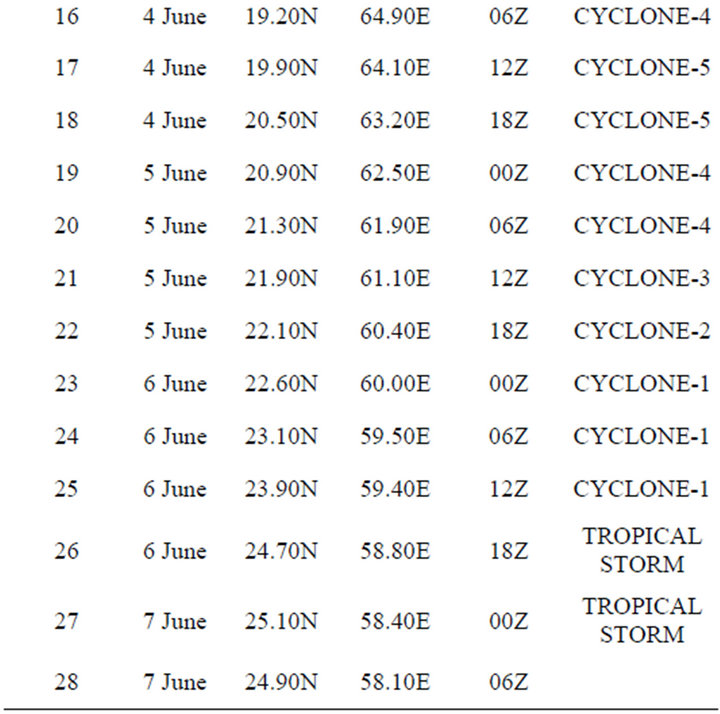
Table 1. Location and track of cyclone as obtained from Unisys weather.
Since the system was further intensified, the maximum latent heat flux value was 250 Wm−2, occurred on 5th June. As the system crossed Oman coast on 6th, a decrease in latent heat flux was noticed due to cut off in moisture supply. However, the system was intensified further on 7th June over the Gulf stream (after crossing the Oman coast) and the value became 280 Wm−2, for a short period just before landfall in the Iran coast. The latent heat flux value came back to the normal (100 Wm−2) after dissipation of the system.
3.2. Long Wave Flux
In comparison with the latent heat flux, long wave flux does not show one to one relationship associated with the clouding. It is observed that in response to the intense cloud over the region of system, long wave flux is decreasing. The exact location of the OLR and long wave
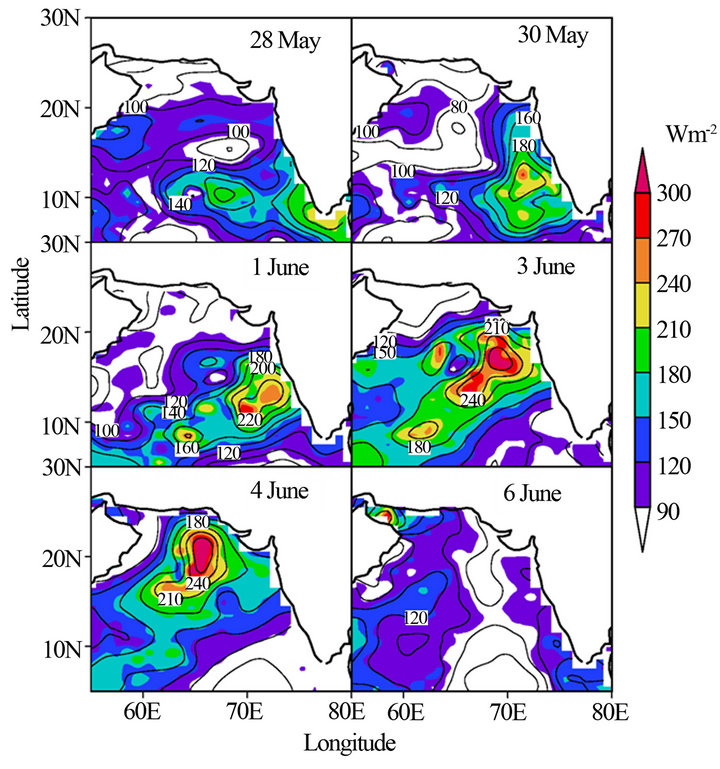
Figure 2. Latent heat flux in the Arabian Sea for various intensities of the cyclone, Gonu during 28 May to 6 June.
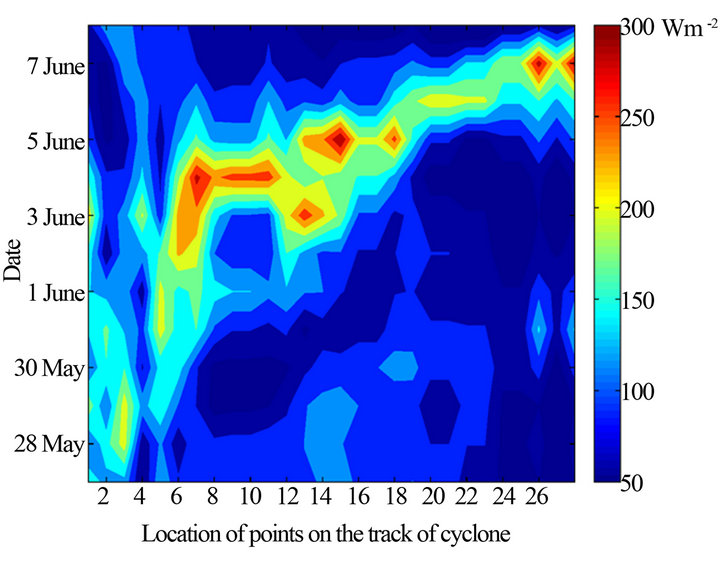
Figure 3. Hovmoller diagram for latent heat flux from 26 May to 7 June 2007.
flux is not matching as in the case of latent heat flux. On 28th, the long wave flux values (Figure 4) were high (100 Wm−2). On 1st June, the value came down to 40 Wm−2 over the region of the system. The value decreased further as the cyclone intensified on 3rd (20 Wm−2) and 4th (10 Wm−2). After the landfall on 6th June the value started to increase due to the dissipation of Gonu and subsequent revival of monsoon and associated clouding over the Arabian Sea.
Following Waliser and Graham [25]
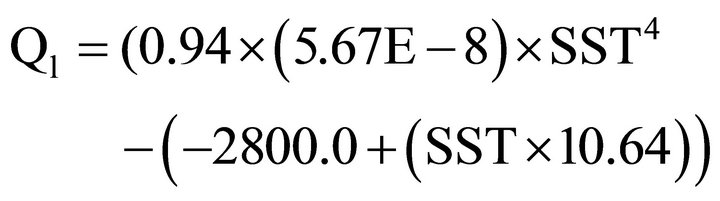
where SST is the sea surface temperature. The long wave flux is the outgoing long wave radiation flux which is emitted by the sea surface whereas the OLR is the Outgoing Long wave Radiation on the top of atmosphere. Since the SST is the forcing function for the long wave radiation flux and the response of SST to the passage of cyclone is a slow process, it is difficult to have one to one relationship between the cloud pattern and associated long wave flux. This is the reason why the Hovmoller diagram does not show a similar path corresponding to Figure 3.
Figure 5 shows Hovmoller diagram for long wave radiation flux. It is clear that the long wave flux values sharply decreased to 50 Wm−2 from 100 Wm−2 during the intensification of cyclone. The long wave flux decreased due to the passage of the system (associated with decrease in SST and increase in cloud cover). Long wave flux values were 50 Wm−2 during the mature stage of the low pressure system.
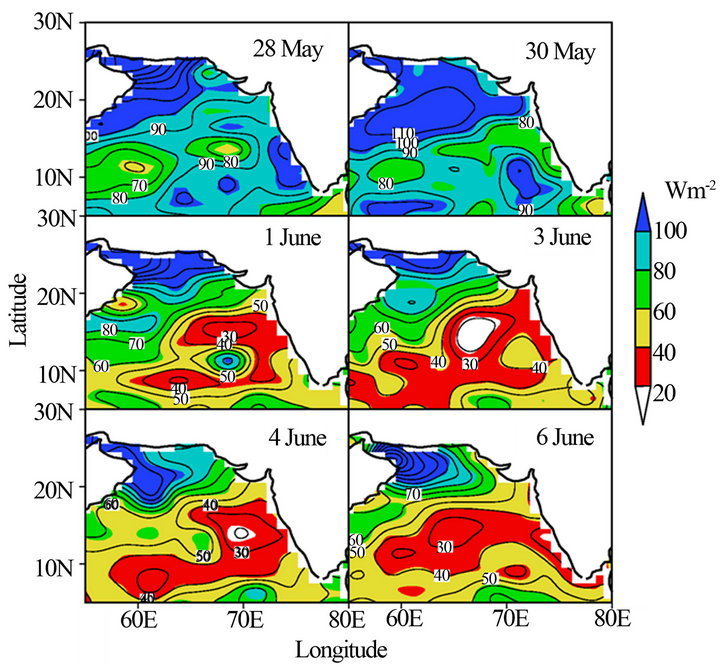
Figure 4. Long wave flux in the Arabian Sea for various intensities of the cyclone, Gonu during 28 May to 6 June.
3.3. Sensible Heat Flux
On 28th the sensible heat flux values (Figure 6) increased from 0 Wm−2 to 15 Wm−2 and on reaching 30th May and 1st June it increased to 20 Wm−2. On 3rd and 4th June it again increased to 30 Wm−2 over the cyclone center and after the landfall on 6th June it sharply decreased.
From the Hovmoller diagram (Figure 7) it is found that the sensible heat flux values were increased from –10 Wm−2 to 30 Wm−2. The maximum values are observed to be on 3rd and 4th June. Sensible heat flux value during the formation of cloud is 10 Wm−2. When there is cloud the value increased to 50 Wm−2.
3.4. Short Wave Radiation Flux
The algorithm to predict net surface insolation from OLR
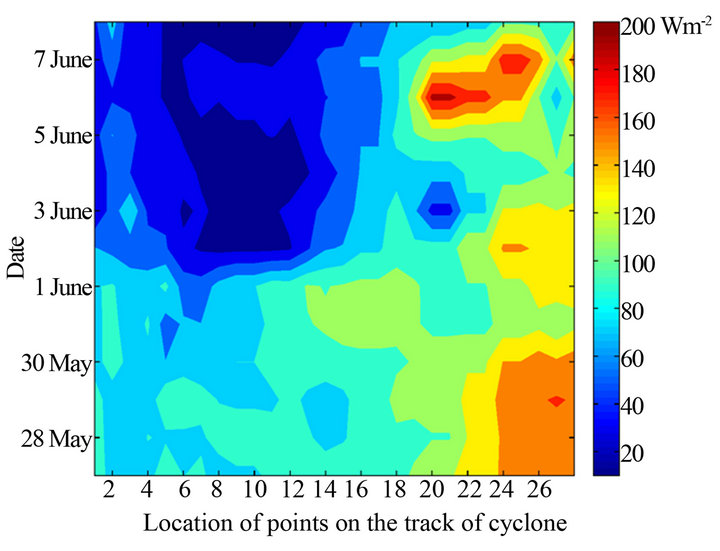
Figure 5. Hovmoller diagram for long wave radiation flux from 26 May to 7 June 2007.
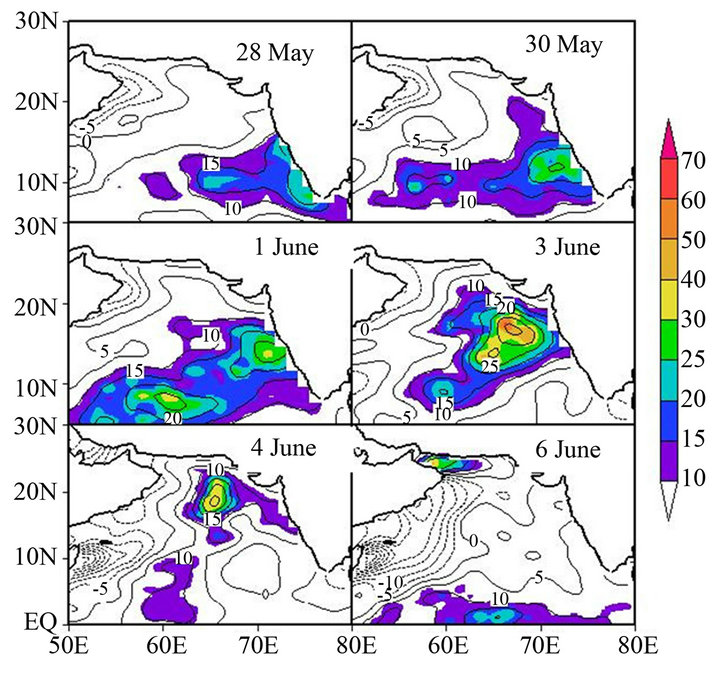
Figure 6. Sensible heat flux in the Arabian Sea for various intensities of the cyclone, Gonu during 28 May to 6 June.
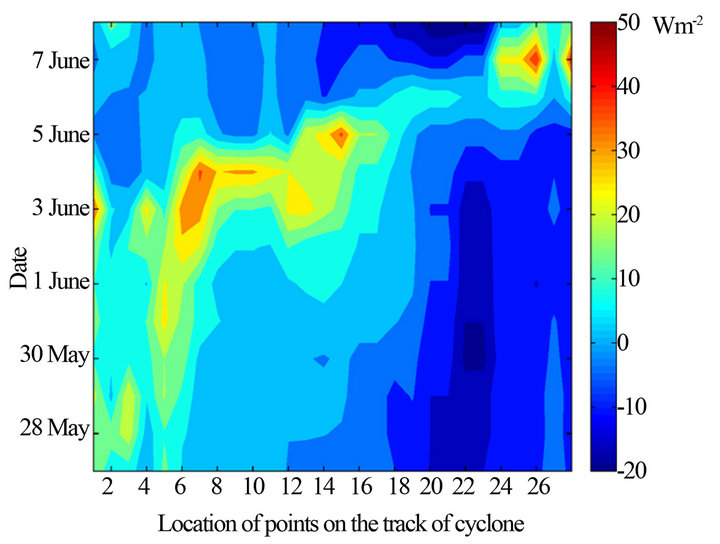
Figure 7. Hovmoller diagram for sensible heat flux from 26 May to 7 June 2007.
is based on linear regression of OLR onto Surface Radiation Budget: Shinoda et al. [26]
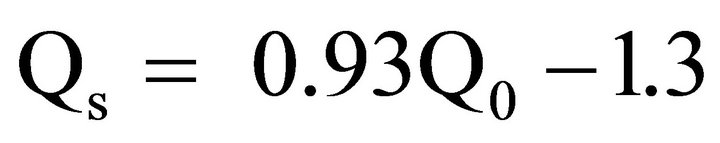
where Qs is the net surface insolation in watts per square meter, and Q0 is the OLR in watts per square meter. Figure 8 describes variation of short wave radiation flux from the contour charts. Short wave flux decreased to 120 Wm−2 over the region of system on May 28th. It was decreased further to 100 Wm−2 on 1st June and remained the same value during 3rd and 4th June. After the landfall on 6th it increased to value 260 Wm−2. From the Hovmoller diagram of short wave flux (Figure 9) it is observed that short wave radiation flux also decreased from 300 Wm−2 to 50 Wm−2 during cyclone intensification. After cyclone passage it increased to normal values.
3.5. Net Flux
Over the entire track of the low-pressure system, it is observed that net flux values (Figure 10) were negative. On 28th May, the net flux was –150 Wm−2. On 30th, the value decreased further to –250 Wm−2 and remained up to 3rd June. At the centre, the values were below –300 Wm−2 on 4th June. After the landfall on 6th it increased to positive values. By looking the Hovmoller diagram of Net flux (Figure 11) we can note that the net flux values were decreasing from 150 Wm−2 to –250 Wm−2 over the cyclone area. Large negative values are observed over the centre of the system. It is found that the Net heat flux is mainly varying due to the drastic variations in short wave radiation and latent heat flux. These are the two terms, which are most important and contributing to the net heat flux. Net flux is found to have large negative values (–270 Wm−2) in the wall cloud region of the system. In the absence of low pressure system the net heat flux value is above 60 Wm−2.
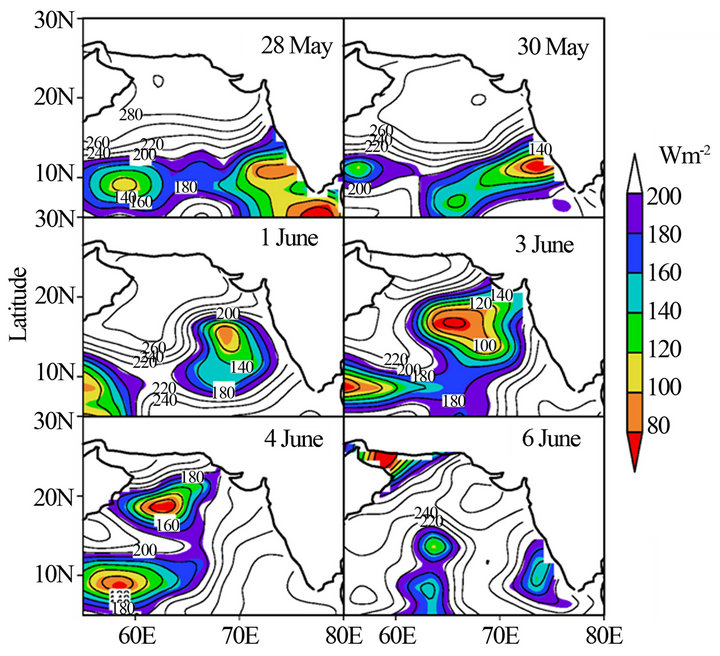
Figure 8. Short wave flux in the Arabian Sea for various intensities of the cyclone, Gonu during 28 May to 6 June.
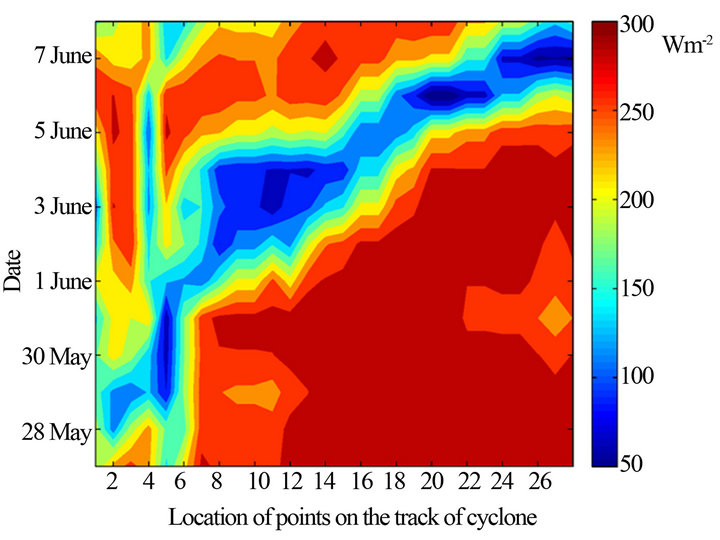
Figure 9. Hovmoller diagram for short wave flux from 26 May to 7 June 2007.
3.6. Analysis of Fluxes from the Area Averaged Diagrams
Figure 12(a) gives the area averaged latent heat flux over 17˚N - 18˚N and 66˚E - 67˚E. The area was chosen because the system was intensified into a cyclonic storm over this location. We can note that the latent heat flux values increased from 120 Wm−2 on 26th May to 270 Wm−2 on 2nd June. After the passage of cyclone, the values decreased to 60 Wm−2. The variation of long wave flux during the presence of low pressure system is presented in Figure 12(b). The long wave radiation value is found to drop from 100 Wm−2 to 20 Wm−2 from 26th May to 3rd June. It is found that it remained the same even after the passage of cyclone. The area averaged short wave flux values (Figure 12(c)) are found to decrease in the presence of clouds as they block the incom-
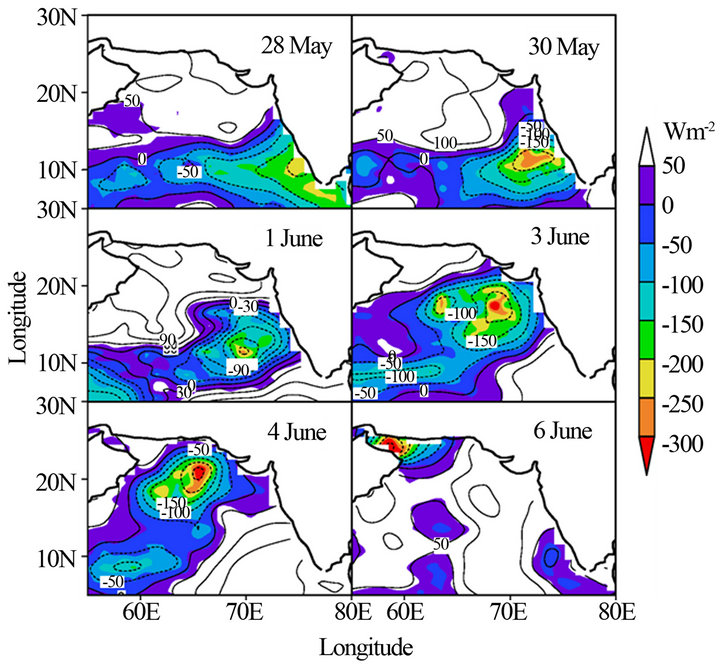
Figure 10. Net flux in the Arabian Sea for various intensities of the cyclone, Gonu during 28 May to 6 June.
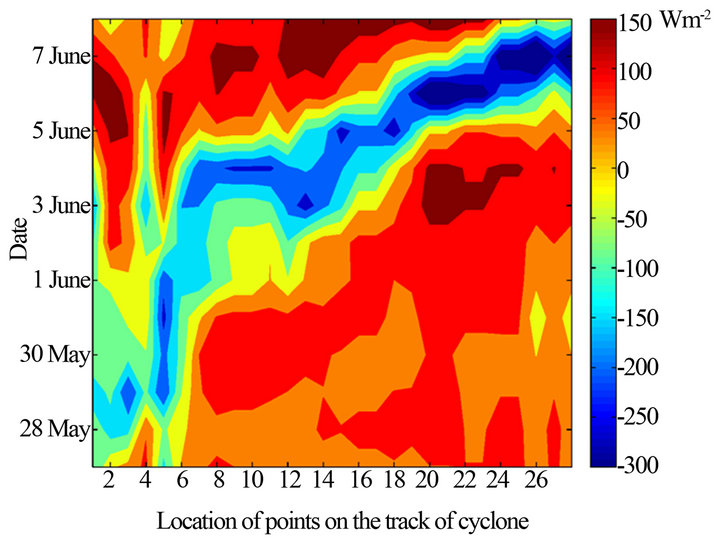
Figure 11. Hovmoller diagram for net radiation flux from 26 May to 7 June 2007.
ing solar radiation. It is found that the short wave radiation decreased from 300 Wm−2 to 90 Wm−2 on 3rd June after the intensification of the system. The short wave radiation flux value returns to normal after the landfall of the system. From the area averaged diagram (Figure 12(d)) sensible heat flux values are found to be increasing due to the formation of clouds over cyclone area. It is found that the values increased from 5 Wm−2 to 30 Wm−2 on reaching 3rd June and after the passage of the cyclone it again decreased to normal values. From the area averaged flux pattern at the center of the system, it is found that the average net flux radiation (Figure 13) value decreased during the presence of cyclone. The net flux values decreased from 100 Wm−2 to –250 Wm−2 on 3rd June when cyclone was present. After the passage of cyclone it again increased to normal values.
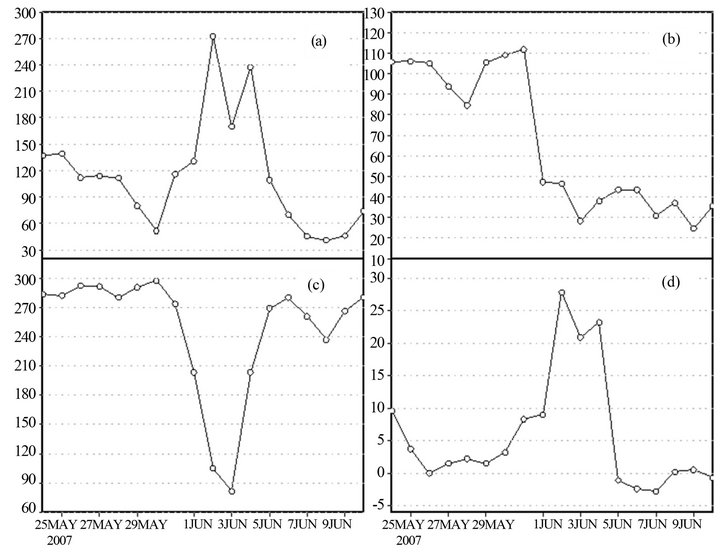
Figure 12. (a) Latent heat flux over the region 17˚N - 18˚N and 66˚E - 67˚E; (b) Long wave radiation flux; (c) Short wave radiation flux; (d) Sensible heat flux.
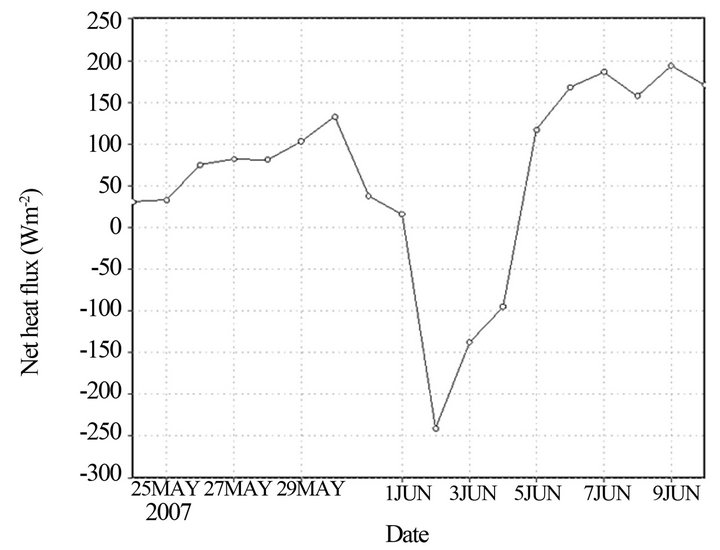
Figure 13. Net heat flux over the region 17˚E - 18˚E and 66˚E - 67˚E.
Immediately after the landfall and dissipation of the super cyclone Gonu over the Oman coast, the monsoon cloud bands started to revive over the oceanic region adjacent to south Indian peninsula. The revival of monsoon organized convection helped the formation of intense clouding which was responsible for the low OLR values even after the dissipation of super cyclone Gonu.
4. Conclusion
In 2007, a low pressure system was formed over the Arabian Sea on 29th May and it was developed into a depression on 1st June 2007. It evolved as a cyclone viz. Gonu and moved towards northwest direction and crossed Oman coast on 6th June 2007. We have examined different heat budget components over the Arabian Sea region during the development of Gonu. After analyzing the different heat budget parameters during the formation of Gonu, it is found that latent heat flux increased from 120 Wm−2 to a maximum of 210 Wm−2 over the cyclone centre. The latent heat flux is increasing due to the intense clouding and associated latent heat release and it is found that the pattern of OLR and latent heat flux has a one to one relationship. For the long wave radiation there is a sharp decrease from 100 Wm−2 to 30 Wm−2 when the system was intensified into severe cyclone. The long wave radiation is the emitted radiation from the sea surface and it is a function of SST. Since the SST responses are a slow process over the ocean, even though the long wave radiation decreases as the SST decreases, it does not have a similar pattern corresponding to OLR. Net flux decreased sharply to negative values, –200 Wm−2 at the centre of the system. The contribution to the net flux is made by the other component fluxes and therefore there is a corresponding decrease observed in the Net flux. There is a sharp increase in the sensible heat flux value to 20 Wm−2. Short wave radiation flux decreases from 300 Wm−2 to 90 Wm−2 during the formation of cyclone. Short wave radiation flux ix being decreased by the intense cloud cover due to the presence of system and a decrease is observed. From our observations it is concluded that the main meteorological and oceanographic parameters that responsible for the variability in heat budget components are OLR (Cloud cover), SST, and wind magnitude.
5. Acknowledgements
The authors gratefully acknowledge the data received from WHOI centre and the first author is thankful to CSIR (New Delhi) for providing the Senior Research Fellowship. Also the authors are thankful to Dr. P. V. Hareeshkumar, NPOL for his fruitful suggestions in the work. The authors would like to acknowledge CUSAT for providing facilities to carry out research.
REFERENCES
- P. V. Hareesh Kumar and B. Mathew, “On the Heat Budget of the Arabian Sea,” Meteorology and Atmospheric Physics, Vol. 62, No. 3-4, 1997, pp. 215-224. doi:10.1007/BF01029703
- S. S. C. Shenoi, D. Shankar and S. R. Shetye, “Differences in Heat Budgets of the Near-Surface Arabian Sea and Bay of Bengal: Implications for the Summer Monsoon,” Journal of Geophysical Research, Vol. 107, No. C6, 2002, p. 3052. doi:10.1029/2000JC000679
- U. C. Mohanty, S. K. Dube and M. P. Singh, “A Study of Heat and Moisture Budget over the Arabian Sea and Their Role in the Onset and Maintenance of Summer Monsoon,” Journal of the Meteorological Society of Japan, Vol. 61, No. 2, 1983.
- W. Duing and A. Leetma, “The Arabian Sea Cooling—A Preliminary heat Budget,” Journal of Physical Oceanography, Vol. 10, No. 2, 1980, pp. 307-312. doi:10.1175/1520-0485(1980)010<0307:ASCAPH>2.0.CO;2
- R. L. Molinari, J. C. Swallow and J. F. Festa, “Evolution of Near Surface Thermal Structure in the Western Indian Ocean during FGGE 1979,” Journal of Marine Research, Vol. 44, No. 4, 1986, pp. 739-762. doi:10.1357/002224086788401639
- S. Hastenrath and P. J. Lamb, “On the Heat Budget of Hydrosphere and Atmosphere in the Indian Ocean,” Journal of Physical Oceanography, Vol. 10, 1980, pp. 694- 707. doi:10.1175/1520-0485(1980)010<0694:OTHBOH>2.0.CO;2
- P. J. Lamb and A. F. Bunker, “The Annual March of Heat Budget of the Northern and Tropical Arabian Sea,” Journal of Physical Oceanography, Vol. 12, No. 12, 1982, pp. 1388-1410. doi:10.1175/1520-0485(1982)012<1388:TAMOTH>2.0.CO;2
- S. Hastenrath and L. L. Greischar, “The Monsoonal Heat Budget of the Hydrosphere-Atmosphere System in the Indian Ocean Sector,” Journal of Geophysical Research, Vol. 98, No. C4, 1993, pp. 6869-6881. doi:10.1029/92JC02956
- R. R. Rao, “Seasonal Heat Budget Estimates of the Upper Layers in the Central Arabian Sea,” Mausam, Vol. 39, 1988, pp. 241-248.
- K. K. Varma and R. G. Kurup, “Seasonal Upper Ocean Heat Budget of Northern Part of Somali Current Area,” Indian Journal of Marine Scienes, Vol. 25, No. 1, 1996, pp. 62-66.
- J. Hsuing, R. E. Newell and T. Houghtby, “The Annual Cycle of Oceanic Heat Storage and Oceanic Meridional Heat Transport,” Quarterly Journal of the Royal Meteorological Society, Vol. 115, No. 485, 1989, pp. 1-28. doi:10.1002/qj.49711548502
- E. C. Etter, “Heat and Fresh Water Budget of the Gulf of Mexico,” Journal of Physical Oceanography, Vol. 13, No. 11, 1983, pp. 2058-2069. doi:10.1175/1520-0485(1983)013<2058:HAFBOT>2.0.CO;2
- M. I. Budyko, “Atlas of the Heat Balance of the Earth,” Idrometcorozdat, Moscoue, 1963, p. 69.
- S. Hastenrath and E. J, Lamb, “Climatic Atlas of the Indian Ocean—Part I: Surface Climate and Atmospheric Circulation,” The University of Wisconsin Press, Madison, 1979, p. 19.
- S. Hastenrath and E. J. Lamb, “Climatic Atlas of the Indian Ocean—Part II: The Oceanic Heat Budget,” The University of Wisconsin Press, Madison, 1979, p. 17.
- I. Kay, T. Ohshima, Watanabe and S. Nihashi, “Surface Heat Budget of the Sea of Okhotsk during 1987-2001 and the Role of Sea Ice on It,” Journal of the Meteorological Society of Japan, Vol. 81, No. 4, 2003, pp. 653-677.
- D. Halpern and R. K. Reed, “Heat Budget of the Upper Ocean under Light Winds,” Journal of Physical Oceanography, Vol. 6, No. 6, 1976, pp. 972-975. doi:10.1175/1520-0485(1976)006<0972:HBOTUO>2.0.CO;2
- J. Merle, “Seasonal Heat Budget in the Equatorial Atlantic Ocean,” Journal of Physical Oceanography, Vol. 10, 1980, pp. 464-469. doi:10.1175/1520-0485(1980)010<0464:SHBITE>2.0.CO;2
- R. Ananthakrishnan, B. Parthasarthy and J. M. Pathan, “Meteorology of Kerala,” Contributions to Marine Science, 1979, pp. 123-125.
- P. R. Pisharoty, “Evaporation from the Arabian Sea and Indian Southwest Monsoon,” Proceedings of International Indian Ocean Expedition, Bombay, 22-26 July 1965, pp. 43-54.
- P. K. Das, “IMO Monograph on Monsoon,” Fifth IMO Lecture Series, World Meteorological Organization, Geneva, 1983, p. 155.
- U. C. Mohanty and N. Mohankumar, “A Study of Surface Marine Boundary Layer Fluxes over the Indian Seas during Divergent Epochs Asian Summer Monsoon,” Atmospheric Environment, Vol. 24A, No. 4, 1990, pp. 823-828.
- U. C. Mohanty, K. J. Ramesh, N. Mohankumar and K. V. J. Potty, “Variability of the Indian Summer Monsoon in Relation to Oceanic Heat Budget over Indian Seas,” Dynamics of Atmospheres and Oceans, Vol. 21, No. 1, 1994, pp. 1-22. doi:10.1016/0377-0265(94)90023-X
- P. R. Jayakrishnan and C. A. Babu, “Variations of Surface Boundary Layer Parameters Associated with Cyclone Gonu over Arabian Sea Using QuikSCAT Data,” International Journal of Remote Sensing, Vol. 34, No. 7, 2013, pp. 2417-2431.
- D. E. Waliser and N. E. Graham, “Convective Cloud Systems and Warm-Pool Sea Surface Temperatures: Coupled Interactions and Self-Regulation,” Journal of Geophysical Research, Vol. 98, No. D7, 1993, pp. 881-893.
- T. Shinoda, H. H. Hendon and J. Glick, “Intraseasonal Variability of Surface Temperature during the 1998 Summer Monsoon,” Journal of Geophysical Research, Vol. 28, No. 10, 1998, pp. 2033-2036.