International Journal of Astronomy and Astrophysics
Vol.4 No.3(2014), Article ID:48780,8 pages
DOI:10.4236/ijaa.2014.43039
Total Solar Flux Intensity at 11.2 GHz as an Indicator of Solar Activity and Cyclicity
Juha Kallunki, Minttu Uunila
Metsähovi Radio Observatory, Aalto University, Kylmälä, Finland
Email: juha.kallunki@aalto.fi
Copyright © 2014 by authors and Scientific Research Publishing Inc.
This work is licensed under the Creative Commons Attribution International License (CC BY).
http://creativecommons.org/licenses/by/4.0/


Received 9 June 2014; revised 5 July 2014; accepted 1 August 2014
ABSTRACT
In this paper we present an overview of solar radio observations at 11.2 GHz on Metsähovi Radio Observatory (MRO). The data were observed during the solar cycles 23 and 24 (2001-2013) both in solar maxima and minimum. In total, 180 solar radio bursts, with varying intensities and properties, were observed. We compare our data series with other similar data sets. A good correlation can be found between the data series. It is concluded that one can conduct scientifically significant solar radio observations with a low cost instrument as the one presented in this paper.
Keywords:Solar Activity, Solar Flare, Solar Cycle, Solar Radio Burst

1. Introduction
Metsähovi RT-1.8, located at Metsähovi Radio Observatory (MRO), Aalto University (Helsinki Region, Finland, GPS: N60˚13.04ꞌ, E24˚23.35ꞌ), is a radio telescope with a 1.8 m dish diameter dedicated for continuous solar observations. The telescope has a beam size of 81.6 arc min and its system noise temperature is 270 K. It observes the total radiation of the Sun at a frequency of 11.2 GHz. The emission measured at 11.2 GHz originates from lower corona. The Quiet Sun Level (QSL) is around 12,000 K at 11.2 GHz. The radio telescope is used for observing solar radio bursts, as it acts as a detector of general solar activity. It also studies on solar oscillations have been done. High sampling rate (5 kHz) enables studying flare fine structure, including short periodic oscillation phenomena. The radio telescope has no protective radome, therefore it is vulnerable to prevailing weather conditions. Around 200 solar radio bursts have been detected since their launch in 2001. Full documentation of the Metsähovi RT-1.8 can be found in [1] . The telescope has a logarithmic output which can be utilized in the case of strong bursts in which case the linear output, that is used in this study, would saturate. The logarithmic output was not enabled during this research. The changing radio emission indicates variation of solar magnetic activity. The birth of radio emission is affected by all plasma parameters, for example, temperature and density. This signifies the importance of radio observations and introduces interesting information on the subject. Gyromotion of thermal electrons in a presence of a magnetic field causes thermal gyroresonance emission. In active regions the magnetic field may have the strength to render the corona optically thick to enable gyroresonance absorption at the frequency range of 1 - 18 GHz.
The first observation of a solar radio burst was measured in the 1940’s. Thus, there are only few observations and their time span is only about 70 years. Data from Metsähovi RT-1.8 have been used earlier, for example, by [2] who studied solar oscillations during a solar radio burst (flare). They found various oscillation periods between 1.9 and 12.8 minutes. They assumed that some of these periods corresponded to the signatures of largescale transverse oscillations of coronal loops. This study presents a new long-term time series of solar radio burst data which is compared to several existing time series. At MRO a similar time series has been produced at a frequency of 37 GHz [3] .
2. Classification of Solar Radio Bursts
In this study solar radio bursts were categorized in three different classes from I to III (I being the weakest and III being the strongest) on the basis of their strengths. Due to the fact that the data is not perfectly calibrated, we divided it into the three classes. In Figure 1 one can see an example of a typical measurement day (13.5.2013) with one Class III burst. Observations cover a time period from 1/2001 to 12/2013 excluding February, March and October each year due to satellite interference. Furthermore, some other months were excluded due to technical issues. A monthly average number for the bursts is calculated. In Figure 1 Quiet Sun Level (QSL) is the median of the data set (sunshine time) which in this case is a rough estimate. Its SFU can be calculated with Equation (1) in which f is the frequency, 11.2 GHz [4] :
 (1)
(1)
For measurement displayed in Figure 1, the result is 450 SFU. If a burst exceeds 500 SFU, the result will saturate. By choosing Class I to be as high as 1.2× QSL, it is ensured that no artifacts are introduced into the results.
At MRO long time series of solar observations are possible only during the summers due to the Northern location of the site. The biggest reason that causes problems is the weather, for example, wind and rain. As an example of such a weather effect can be seen in Figure 1, a dip on intensity curve at around 15:00. Furthermore, during winter the Sun is below the horizon for the most part of the day. From the beginning of 2014 a new calibration method, that exploits the use of a calibration noise diode, has been in use allowing a more accurate division of the solar radio bursts. Calibration is now performed daily.
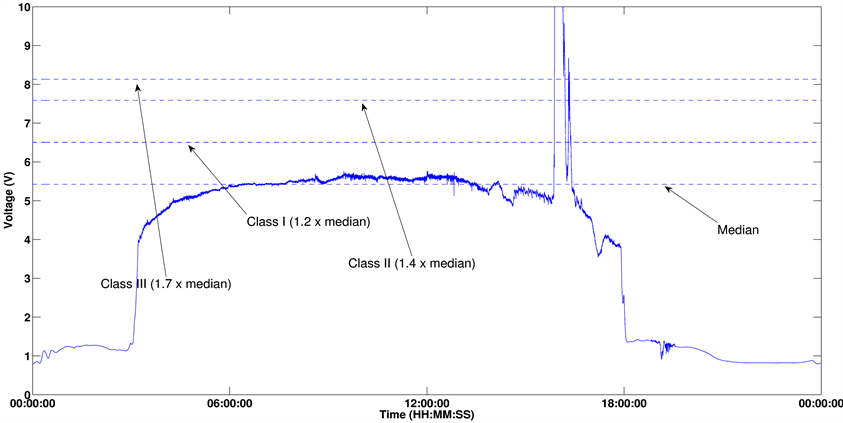
Figure 1. Example of a 24-hour measurement on 13.5.2013.
3. Results
A summary of solar radio bursts is listed in Table1 It is surprising that the number of events in Class II and III is about the same.
In Figure 2 and Table 2 a distribution of the solar radio bursts into different classes during 2001-2013 can be seen. Monthly averages of total number events are listed in Table3 Near the beginning and end of the data collection period the amount of Class III and II bursts are at their highest. Note, that in the middle of the data collection period no solar radio bursts were recorded (Table 3) or their strength was too low to be recorded. This also indicates a very quiet solar minimum. It can also be seen from Table 3 that solar cycle 24 is weaker than cycle 23 as the number of bursts is lower.
[5] has recorded a similar time series as in Figure 2, but the data is not comparable because it is from an earlier time period. Also in [6] and [7] similar solar radio burst time series have been introduced but they have too been measured at different frequencies and at a previous period in time and, thus, are not fully comparable.
When the data was compared to total solar radio flux at 2.8 GHz measured at Dominion Radio Astrophysical Observatory in Canada [8] , it was noticed that the solar events measured at Metsähovi at 11.2 GHz appear to correlate with the Dominion total solar radio flux curve quite accurately (Figure 3). It should also be noted that the observations at 2.8 GHz correlate accurately with sunspot numbers.
Due to the architecture of the telescope, for example, the lack of a radome, and thus the influence of changing weather to the results, a plausible total solar radio flux curve cannot be created and directly compared with Dominion Radio Astrophysical Observatory’s total solar radio flux (Figure 3).
When the MRO data was compared to data from two of the telescopes belonging to Radio Solar Telescope Network [9] Lear month, Australia and San Vito, Italy [10] , it could be concluded that again the data correlated even though the locations of the telescopes are rather far away from each other, which in turn explains why the number of the events at different locations differs (Figure 4). The size of the telescopes is about the same. Please also note that the instruments and their sensitivities differ from each other, which further explains the variation in the number of the solar events recorded at different observatories. Yet another explanation to the variation is the high QSL limit that was chosen for the MRO data. Details about the different observatories are listed in Table4
4. Conclusions
It can be concluded that the solar radio burst data observed with MRO’s RT-1.8 telescope at 11.2 GHz are comparable to the data observed at 2.8 GHz at Dominion, Canada, 15.4 GHz at Learmonth, Australia and 8.8 GHz at
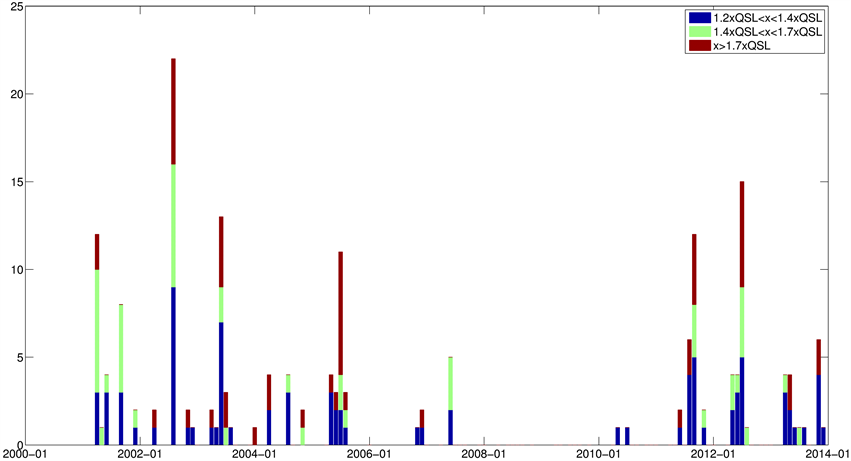
Figure 2. Classification of solar flares on basis of their intensity.

Table 1. Classification of solar radio bursts.
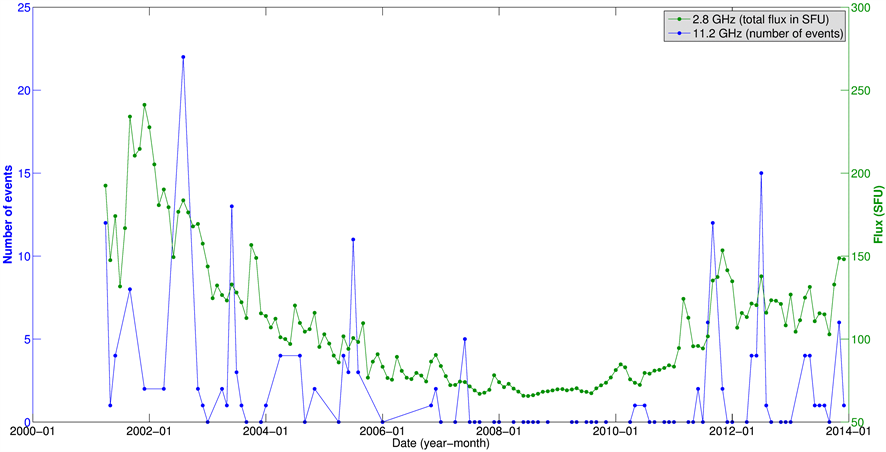
Figure 3. Comparison between number of the solar radio event at 11.2 GHz (blue) and total solar radio flux at 2.8 GHz from Dominion Radio Astrophysical Observatory, Canada (green).

Figure 4. Comparison of number solar flares between Metsähovi (blue), Learmonth (red) and San Vito (black) between 2001 and 2010.

Table 2. Solar radio bursts 2001-2013 per month.
Table 3. Monthly averages of measured solar radio bursts 2001-2013 for each class. Also total monthly averages are listed.
Table 4. Details about the observatories.
San Vito, Italy. About one half of the data recorded during 13 years belong to our Class I and the other half to Classes II and III, both of which have about the same number of events. In the future, similar analysis should also be performed to Lear month and San Vito data. It is rather remarkable that a low cost instrument that utilizes commercial components such as ones used in television satellite technique, like MRO’s RT-1.8, enables vast and scientifically significant observations. The instrument can be used for both cyclicity and single event analysis. However, only one 11-year period has been measured so far. In the future MRO will continue to prolong the time series even further to allow investigating solar cyclicity thoroughly.
From the beginning of year 2014 a new improved calibration method was introduced to allow a more accurate division of the solar radio bursts. The new calibration method enables the use of a realistic SFU values. In the future a new radome will be purchased, which will cancel out the most severe weather effects. The Northern location enables unique long-term monitoring during summertime.
Now new statistics are created, for example, with additional information of the shape for the burst. For example, in Figure 1 a double-peak structure is seen. Previously only the strength of the burst was taken into account even though double-peak structures were also measured. In the data measured in 2014 or prior a lot of bursts with a double-peak structure have been recorded. In the future these will be further studied. Solar radio bursts at 11.2 GHz will also be monitored and analyzed together with bursts measured with MRO Callisto equipment [11] , and also with RHESSI (Reuven Ramaty High Energy Solar Spectroscopic Imager) data [12] . In the near future 11.2 GHz data archive will be published for public use.
References
- Kallunki, J. (2009) Possibilities of the Mets?hovi Radiotelescopes for Solar Observations. Licentiate Thesis, Faculty of Information and Natural Sciences, Helsinki University of Technology, Espoo.�
- Khodachenko, M.L., Kislyakova, K.G., Zaqarashvili, T.V., et al. (2011) Possible Manifestation of Large-Scale Transverse Oscillations of Coronal Loops in Solar Microwave Emission. Astronomy and Astrophysics, 525, A105. http://dx.doi.org/10.1051/0004-6361/201014860
- Kallunki, J., Lavonen, N., Jarvela, E. and Uunila, M. (2012) A Study of Long-Term Solar Activity at 37 GHz. Baltic Astronomy, 21, 255-262.
- Benz, A.O. (2009) Quiet and Slowly Varying Radio Emissions of the Sun. The Landolt-Boernstein Database, LB VI/4B 4.1.1.6. http://dx.doi.org/10.1007/978-3-540-88055-4
- Gary, D.E. and Keller, C.U. (Eds.) (2004) Solar and Space Weather Radiophysics. Astrophysics and Space Science Library, XXIV, 400 p.
- Jiricka, K., Karlicky , M., Mészárosová, H. and Snízek, V. (2001) Global Statistics of 0.8-2.0 GHz Radio Bursts and Fine Structures Observed during 1992-2000 by the Ondrejov Radiospectrograph. Astronomy and Astrophysics, 375, 243-250. http://dx.doi.org/10.1051/0004-6361:20010782
- Nita, G.M. (2004) Statistical Study of Solar Radio Bursts. PhD Thesis, New Jersey Institute of Technology and Rutgers, The State University of New Jersey.
- Natural Resources Canada. http://www.spaceweather.gc.ca/solarflux/sx-eng.php
- US Air Force Weather Agency. http://www.afweather.af.mil/units/spaceweatheroperations.asp
- NOAA’s National Geophysical Data Center (NGDC). http://www.ngdc.noaa.gov/stp/space-weather/solar-data/solar-features/solar-radio/radio-bursts/reports/fixed-frequency-listings/
- Kallunki, J., Uunila, M. and Monstein, C. (2013) Callisto Radio Spectrometer for Observing the Sun—Metsahovi Radio Observatory Joins the Worldwide Observing Network. IEEE Aerospace and Electronic Systems Magazine, 28, 5-9. http://dx.doi.org/10.1109/MAES.2013.6575404
- RHESSI, Reuven Ramaty High Energy Solar Spectroscopic Imager. http://hesperia.gsfc.nasa.gov/rhessi2/