International Journal of Astronomy and Astrophysics
Vol. 2 No. 1 (2012) , Article ID: 18176 , 4 pages DOI:10.4236/ijaa.2012.21003
Two Parameters Analytical Solution for the Stellar Density in Globular Clusters
1Astronomy Department, Faculty of Science, King Abdul Aziz University, Jeddah, Saudi Arabia
2Department of Information Technology, Faculty of Computing and Information Technology, King Abdul Aziz University, Jeddah, Saudi Arabia
3Department of Mathematics, College of Science for Girls, King Abdulaziz University, Jeddah, Saudi Arabia
Email: *sharaf_adel@hotmail.com
Received December 21, 2011; revised January 31, 2012; accepted February 10, 2012
Keywords: Globular Clusters; Stellar Density; Integral Equations; Symbolic Representations
ABSTRACT
In this paper, two parameters analytical solution will be established for the stellar density in globular clusters. These two parameters can be obtained from star counts, and the solution could be used to fit any order of the outward decrease of the cluster density.
1. Introduction
A globular cluster is a spherical collection of stars that orbits a galactic core as a satellite. They are generally composed of hundreds of thousands of low-metal, old stars. The types of stars found in a globular cluster are similar to those in the bulge of a spiral galaxy but confined to a volume of only a few cubic parsecs. Observations of globular clusters show that these stellar formations arise primarily in regions of efficient star formation, and where the interstellar medium is at a higher density than in normal star-forming regions. Globular clusters are fairly common; there are about 158 [1] currently known globular clusters in the Milky Way, with perhaps 10 - 20 more undiscovered. Andromeda, for instance, may have as many as 500 [2]. Some giant elliptical galaxies, such as M87 [3], may have as many as 10,000 globular clusters. These globular clusters orbit the galaxy out to large radii, 40 kiloparsecs (approximately 131 thousand light-years) or more.
Galactic globular clusters, which are ancient building blocks of our Galaxy, represent a very interesting family of stellar systems in which some fundamental dynamical processes have taken place on time scale shorter than the age of the universe. For examples, horizontal branch (HB) stars in globular clusters offer a probe of the mass loss mechanisms taking place in red giants [4]. Moreover, it was propose to use the horizontal branch (HB) to infer which is today the relative number fraction of “normal” and anomalous stars in clusters [5]. In contrast with galaxies, it was known since the last twenty years that, globular clusters represent unique laboratories for learning about two-body relaxation, mass segregation from equipartition of energy [6], stellar collisions [7], stellar mergers, and core collapse From the photographs of a globular cluster, one can notice how the stars in this projection on a plane, are clustering in much closer packing near the center, while the outer parts are much looser. The distribution law, describing this clustering, is of highest interest for understanding of the internal dynamics of this system and of its origin. However, the distribution in space must be a function of the radius r, different from the distribution in projection on a plane.
In fact those numerical methods provide very accurate solutions in general. But certainly if full analytical formulae are utilized via symbol manipulating digital computer programs, they definitely become invaluable for obtaining solutions of any desired accuracy. Moreover, symbolic computing algorithms for scientific problems in general represent a new branch of numerical methods that we may call “algorithmization” of problems.
Copying with this line of recent researches and also due to the important role of the space distribution in understanding the dynamical evolution of globular clusters [8], the present paper is developed to: establish analytical solution for the space density distribution in globular clusters. This solution depends on two parameters that can be obtained from star counts, and can be used to fit any order of the outward decrease of the cluster density.
2. Basic Formulations
2.1. Assumptions
The distribution of stars in globular clusters is inferred from counts of stellar images on CCD Camera film. Although several of the clusters appear to be somewhat ellipsoidal in form [9] we consider only the case of spherical symmetry; the analytical results can then be applied to spherical clusters and those whose ellipticity is small. Through the departure from the spherical form is considerable, the general problem of stellar distribution in such clusters, in practice, almost intractable.
2.2. Relation between the Cluster Density and Plate Density Function
Take the origin of coordinates to be the center of cluster and the positive direction of the Z-axis in the line of sight and towards the observer. Owing to the assumed symmetry the X and Y-axes can be chosen arbitrary in the plane Z = 0. The positions of stellar images on the film will then be represented by the projections, parallel to the Zaxis, on XY plane.
Consider a cylinder of small rectangular cross-section with axis parallel to OZ. Take the X axis through B, the point of intersection of the axis of the cylinder with the plane Z = 0.
Let r denotes the distance from the center of an element of volume dx dy dz at A and let F (r) be the density function. Then F(r) dx dy dz is the number of stars in the volume element. On the CCD Camera film, these stars will to be within the area dx dy dz at B.
Let f(x) dx dy be the number of stars observed in the element of the film corresponding to dx dy; f(x) is the plate density of the stars at a distance x (ºOB) from the center of the cluster as shown on the plate. Let R be the radius of the sphere, then we have
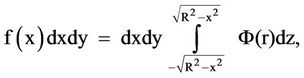 (1)
(1)
consequently
 (2.1)
(2.1)
This is the integral equation, involving the plate density and the cluster density function F (See Figure 1).
2.3. Determination of f(x) from Counts of Stars
Let s(x) denotes the number of images counted on the film within a circle of radius x, and let s (x + dx) the corresponding number within the circle of radius (x + dx). Since f is the number of images per unit area, then
 (2.2)
(2.2)
and
 (2.3)
(2.3)
The number of images in the ring defined by the radii x and x + dx is equal to the difference between s (x + dx) and s(x), then neglecting powers of (dx) greater or equal to two, we get
 (2.4)
(2.4)
Equation (2.4) will be used for obtaining f(x) from counts of stars on the film. [Note that, the negative sign is due to the fact that s(x) is monotonic decreasing function as discussed in Section 3].
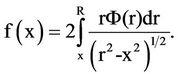
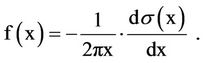
2.4. Solution of the Integral Equation (2.1)
Let
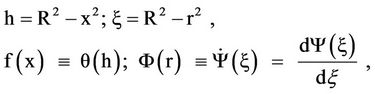
After calculations and from which the plate density vanishes at the periphery of the cluster corresponding to x = R, that is when h = 0, hence q(h) = 0 for h = 0. Also the boundary of the cluster, the star density is small, decreasing to zero at the boundary; hence we can write f(x) = 0 at x = R, then we have
 (2.5)
(2.5)
3. Empirical Formula for ((x)
Observations of globular clusters show very smooth spherical distribution of brightness. If we assume that the amount of light we measure is proportional to the number of stars giving rise to this light, we can determine the run of the star density as a function of distance from the cluster center. We can measure the brightness of globular cluster in successive rings concentric with the cluster
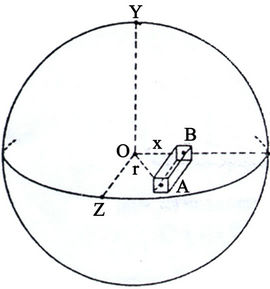
Figure 1. Relation between the cluster density and plate density function.
center. This may be done by direct star counts on a film, or by photographic photometry in which circular apertures of progressively large size are employed. The radius of the cluster image is taken as unity, then, what we can determine from such observations is the number of star images si º s(xi) counted on the film within circles of radii xi for some i = 1, 2,  , N(say) and xi £ 1.
Now, since the stars are clustering in much closer packing near the center, while the outer parts are much looser, that is, s(x) is monotonic decreasing function of x. The orders of the outward decrease differ from cluster to another and also differ from region to another of the same cluster. In order to account for these variations so as to suit many applications, we fit s(x) to the curve
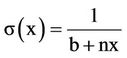 (3.1)
(3.1)
where b, and n are constants to be determined.
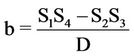
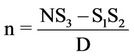
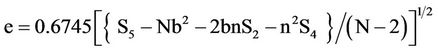
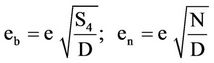
Determination of b, n, and Their Error Estimation
Before staring the analysis, it is convenient to summarize some of the basic definitions and properties of the leastsquares solution.
Basic Definitions and Properties
Let y represented by the general linear expression of the form  where j’s are linearly independent functions of x. Let c be the vector of the exact values of the c’s coefficients and
  the least-square estimators of c obtained from the solution of the normal equations of the form G
  = h. The coefficient matrix G (m, m) is symmetric positive definite, that is, all its eigenvalues li, i = 1, 2,
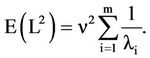
  , m, are positive. Let E(z) denotes the expectation of z and n2 the variance of the fit, defined as
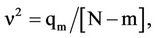 (3.2)
(3.2)
where
 (3.3)
(3.3)
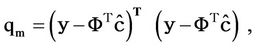
N is the number of the observations y is a vector with elements yk and F (m, N) has elements Fik = FI (xk). The transpose of a vector or a matrix is indicated by the superscript “T”. According to the least-squares criterion, it could be shown that [10]:
1) The estimators  given by the least-squares method gives the minimum of qm.
2) The estimators  of the coefficients c, obtained by the method of least-squares, are unbiased, i.e., E (
 ) = c.
3) The variance-covariance matrix Var ( ) of the unbiased estimators
  is given by
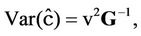 (3.4)
(3.4)
where G–1 is the inverse of G.
4) The average squared distance between  and c is
 (3.5)
(3.5)
According to the above equations, the following algorithm will be devoted for computing b and n from the star counts .
.
Conputational Algorithm 1
Purpose
To determine the constants b and n and their errors.
Input
Conputational sequence
 (1)
(1)
 (2)
(2)
 (3)
(3)
 (4)
(4)
 (5)
(5)
 (6)
(6)
 (7)
(7)
 (8)
(8)
The probable error of the fit e
 (9)
(9)
The probable errors of b and n
 (10)
(10)
The average squared distance between the exact, the least squares values Q
 (11)
(11)
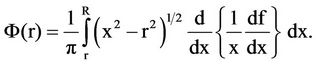
4. Analytical Expression of ((r)
Having obtained the empirical formula for s(x) as
 (12)
(12)
the cluster density function F(r) could then be obtained analytically from Equations (2.4) and (2.5) as listed in Appendix A.
In concluding the present paper, we stress that an efficient analytical solution was established for the solution of the stellar density distribution in globular clusters. The efficiency of the solution is due to its inclusion of only two parameters that can be obtained from star counts, and also due to its ability to fit any order of outward decrease of the cluster density.
REFERENCES
- H. Frommert, “Milky Way Globular Clusters,” SEDS, 2007, Retrieved on 26 February 2008. http://www.seds.org/~spider/spider/MWGC/mwgc.html
- P. Barmby and J. P. Huchra, “M31 Globular Clusters in the Hubble Space Telescope Archive. I. Cluster Detection and Completeness,” The Astronomical Journal, Vol. 122, No. 5, 2001, pp. 2458-2468. doi:10.1086/323457
- S. E. Strom, K. M. Strom, D. C. Wells, J. C. Forte, M. G. Smith and W. E. Harris, “The Halo Globular Clusters of the Giant Elliptical Galaxy Messier 87,” Astrophysical Journal, Vol. 245, No. 5457, 1981, pp. 416-453. doi:10.1086/158820
- A. A. R. Valcarce and M. Catelan, “A Semi-Empirical Study of the Mass Distribution of Horizontal Branch Stars in M 3 (NGC 5272),” A&A, Vol. 487, 2008, p. 185. doi:10.1051/0004-6361:20078231
- F. D’Antona and V. Fand Caloi, “The Fraction of Second Generation Stars in Globular Clusters from the Analysis of the Horizontal Branch,” Monthly Notices of the Royal Astronomical Society, Vol. 390, 2008, No. 2, pp. 693- 705.
- L. Spitzer, “Dynamical Evaluation of Globular Clusters,” Princeton University Press, Princeton, 1987.
- J. Binney and S. Tremaine, “Galactic Dynamics,” Princeton University Press, Princeton, 1987.
- J. Shin, S. S. Kim and K. Takahashi, “Dynamical Evolution of the Mass Function and Radial Profile of the Galactic Globular Cluster System,” Monthly Notices of the Royal Astronomical Society, Vol. 386, No. 1, 2008, pp. L67-L71. doi:10.1111/j.1745-3933.2008.00462.x
- S. van den Bergh, “The Flattening of Globular Clusters,” The Astronomical Journal, Vol. 135, No. 5, 2008, p. 1731. doi:10.1088/0004-6256/135/5/1731
- Z. Kopal and M. A. Sharaf, “Linear Analysis of the Light Curves of Clipsing Variables,” Astrophysics and Space Science, Vol. 70, No. 1, 1980, pp. 77-101. doi:10.1007/BF00641665
Appendix A
Analytically Expression of the Space Density Function of Globular Clusters

NOTES
*Corresponding author.