Journal of Diabetes Mellitus
Vol. 2 No. 1 (2012) , Article ID: 17292 , 7 pages DOI:10.4236/jdm.2012.21003
Changes in body composition of women at different age decades and its relation with to metabolic risks
![]()
1Nutrition and Dietetics Department, Samsun Health School, Ondokuz Mayis University, Samsun, Turkey; *Corresponding Author: aozenoglu@yahoo.com, alper.tokay@omu.edu.tr
2Internal Medicine Rheumatology Department, Cerrahpasa Medicine Faculty, Istanbul University, Istanbul, Turkey; serdalugurlu@gmail.com
3Public Health Department, Cerrahpasa Medicine Faculty, Istanbul University, Istanbul, Turkey; alpincan@yahoo.fr
Received 21 September 2011; revised 14 November 2011; accepted 30 November 2011
Keywords: Obesity; adolescent; body fat; Insulin; metabolic syndrom; age decades; female
ABSTRACT
Objective: Aim of this study was to investigate the changes in body composition and some biochemical parameters of women at different age and body mass index (BMI) groups and to evaluate their relations with to cardiometabolic risk factors. Methods: The study was created by retrospective research of the file records of total 800 women who got into nutritional counseling between 2002-2007 years at Cerrahpasa Medical Faculty. Participants were grouped as 10 - 19, 20 - 29, 30 - 39, 40 - 49, 50 - 59, ≥60 years according to ages and were divided into 4 groups as normal, overweight, obese and morbidly obese according to body mass index. Data were statistically analysed in SPSS for Windows computer program with ANOVA and Tukey HSD tests. Findings: There are significant differences between different age groups in weight, BMI, waist and hip circumferences, percentage of body water, fat and fat-free mass, basal metabolic rate and blood glucose, insulin, triglyceride, cholesterol, HDL, LDL levels and HOMA-IR values. HOMA-IR values were the highest at age group 1 and the lowest at age group 2. Although they were in the same BMI group; their waist circumference, basal metabolic rate and percent of body fat showed significant increases with advancing age. Conclusion: The findings of our study show that it will be useful to use standard values generated for each age group according to BMI levels in predicting increased cardiovascular and metabolic risks together with advancing age. While the lowest rate of obesity according to body fat percent (>30%) was found at the ages in between 20 - 29 (58.4%), it is noteworthy that the obesity rate with respect to their body fat percent has been noticed at the ages of 10 to 19 (2.3%). Comparing with the other groups, significantly higher body heights found at the ages in between 10 - 19, could possibly predicate that the new generations are having better nutrition and overhaul. On the other hand, it was known that as a result of eating bugs and/or over-nutrition, besides insertion of inactive life style, children have become more sensitive to obesity and related health problems. As seen in our study, the healthiest values are at the ages in between 20 - 29, the results were commentated as the women at those ages are showing more interest in their physical appearance and their health. In accordance with our study’s data, in order to cope with obesity and related illnesses, which are having an importance in public health, we concluded that generalizing continuous and effective trainings on nutrition concerning families even the educators starting from the childhood, can be usefull.
1. INTRODUCTION
With the increasing age, meaningful changes occur in body composition, especially an increase in the fat mass and decrease in lean body mass. These changes together with obesity contribute to increased risk for type II diabetes, cardiovascular disease and some types of cancer [1-3]. It is very well known that there is a relationship between body composition and morbidity and mortality [2,4,5]. Studies indicate the importance of the measurement of the body fat and lean mass, instead of BMI, in determining the clinical results and the mortality risk concerning with obesity and malnutrition.
Body composition shows variance according to age, sex, ethnicity, environmental conditions, menstrual cycle in women, various diseases and medical conditions. To commentate the results regarding body composition in different conditions, reference values performed at similar conditions are needed. However, at the present time, the data regarding the reference values of body composition that have been set up in different conditions are pretty limited [2,6].
Nowadays, progress in the field of medicine and technology have been contributing to the prolongation of human life expectancy; on the other hand it caused accessing to wide variety of foods easily and a reduction in physical activity. In many communities, rapid changes in life style in parallel with an increase in energy consumption but a decrease in physical activity, threaten the health of individuals in each age groups. As a result of this, the incidence of Type II Diabetes, hypertension, fatty liver and dyslipidemia in adolescents and even childhood age groups has gradually increased [7-10]. It’ll not be surprising to expect an increase in obesity and related illnesses in young people, whom are exposed to sedantery life style and unhealthy nutrition in their early ages.
In this study, we aimed to determine body compositions of women who were grouped as per age decades and BMI; and to explore the relations of cardiovascular and metabolic risks with alterations in body compositions and ages.
2. METHOD
This study has been created by retrospective research of the patient files (800 females) that have been sent to diet clinics to receive diet consultancy between 2002- 2007 years from various units of Istanbul University (IU) Cerrahpasa Medical Faculty (CMF) clinics, who didn’t have an identified medical history or any disease.
Patients having anthropometric measurements (height, weight, waist and hip circumference measurements, and body composition analyses through Bioelectrical Impedance Analyzer (Body stad 1500, England)) and some biochemical tests like blood glucose, insulin, tryglyceride, total cholesterol, HDL, LDL levels in their files had been included in the study. All patients were informed at the beginning of the interview and their oral concepts were taken to use their file records for this study.
Patients have been classified as per ages 10 - 19 (n:60), 20 - 29 (n:160), 30 - 39 (n:216), 40 - 49 (n:208), 50 - 59 (n:113), 60 and above (n:43) into 6 groups; as per BMI, normal (18.5 - 24.9 kg/m2), overweight (25.0 - 29.9 kg/m2), obese (30.0 - 39.9 kg/m2) and morbidly obese (≥40.0 kg/m2) into 4 groups. BMI, waist/hip ratio (WHR) and HOMA-IR has been calculated according to known formulas. Fasting blood glucose, triglyceride, total cholesterol, HDL and LDL cholesterol levels were measured with Abbott C8000 (Abbott, Japan), insulin levels were measured with Immulite 2000 (DPC; LosAngeles, USA) analysers with Kemiluminescent Immunometric method.
Women that are in the same BMI group at different ages, have been compared from the point of anthropometric measures and body compositions. The statistical analysis of the data have been made with the programme SPSS for Windows ANOVA and Turkey HSD tests.
3. FINDINGS
Number of women in age group 3 was the highest, and in age group 6 was the lowest (Table 1).
There were significant differences between age groups with respect to BMI, waist circumference, body fat percent, fasting blood glucose, insulin, triglyceride, total and HDL, LDL cholesterol levels and HOMA-IR indexes (Figure 1 and Table 2).
When people who have normal BMI in all age groups were compared, there have been significant differences in waist circumference (WC), waist/hip ratio (WHR) and BMR (p = 0.002, p = 0.001, p = 0.015 respectively). It’s been determined that the lowest values for waist circumference and WHR were in age group 2 (WC: 69.96 ± 4.94 cm, WHR: 0.73 ± 0.03), the highest values were seen in age group 6 (WC: 81.50 ± 4.95 cm, WHR: 0.89 ± 0.08); BMR has been determined as the highest at the age group 1, the lowest at the age group 6 (1451.89 ± 66.76 kcal and 1291.40 ± 61.78 kcal; p = 0.015 respectively).
When people who were overweight in different age groups were compared there have been significant differences in waist circumference. It was found that the lowest waist circumference was in age group 2 and the highest in age group 5 (80.95 ± 4.38 cm and 87.09 ± 5.50 cm, p = 0.022 respectively).
When obese women from different age groups were compared, there were significant differences in WC, WHR and body fat percent. It was found that the lowest waist circumference was at the age group 2, the highest
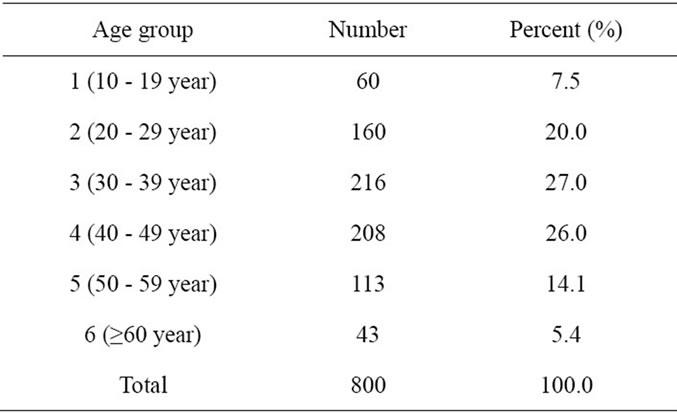
Table 1. Distribution of women with respect to age groups.
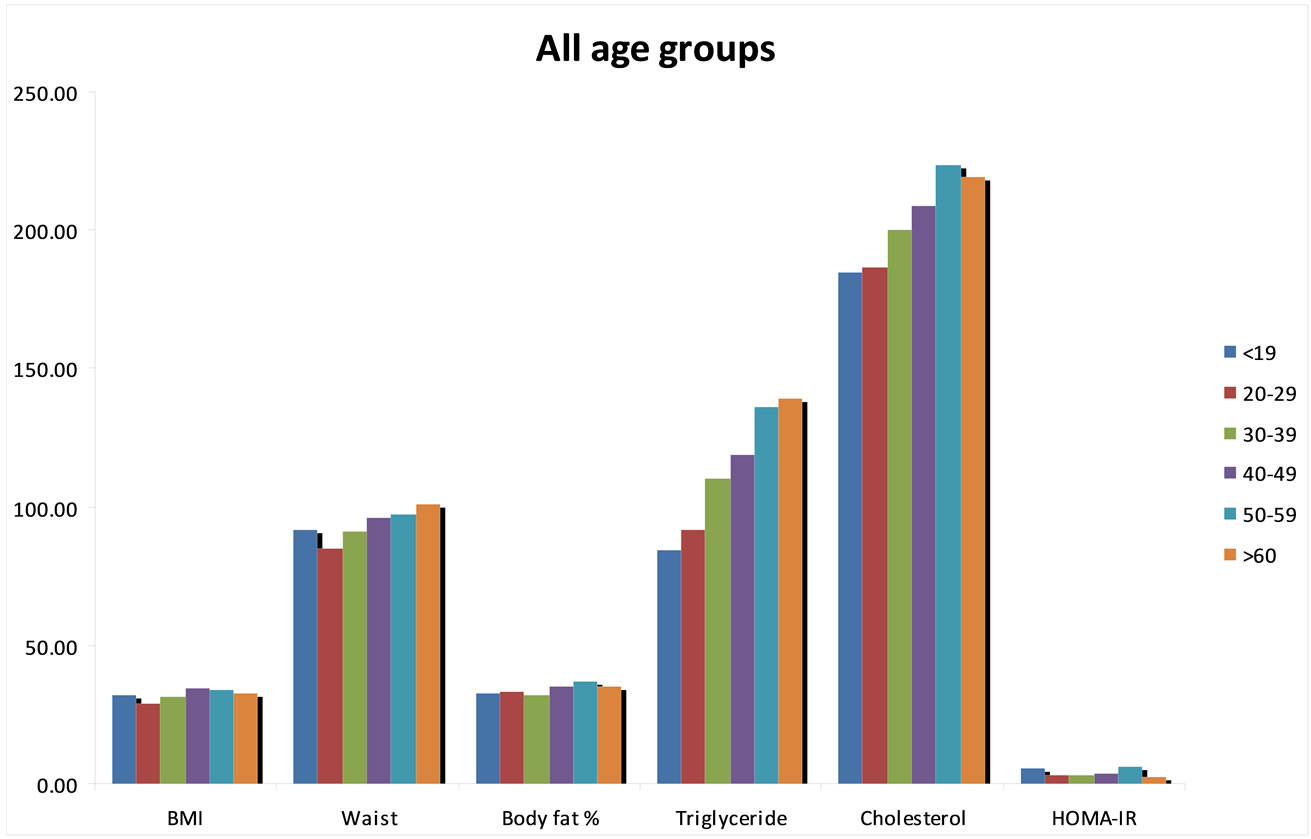
Figure 1. Comparision of some anthropometric measurements and biochemical parameters of age groups.
was at the age group 6 (94.13 ± 6.18 cm and 105.70 ± 7.53 cm, p = 0.001, respectively); WHR has been found the lowest at the age group 2 and the highest at the age group 6 (0.79 ± 0.04 and 0.91 ± 0.06, p = 0.001, respectivelly). The body fat percent has been found the lowest at the age group 3 and the highest at the age group 6 (34.51% ± 3.38% and 38.26% ± 6.25%, p = 0.017 respectively). Also, it was found that the average height in this group is decreasing significantly as the age is going on. The highest values were found (160.58 ± 4.64 cm) at the age group 10 - 20 years and the lowest values (152.45 ± 6.08 cm) were reached at ³60 years (p < 0.001).
When the individuals from all age groups were evaluated by dividing into 4 BMI groups, there have been significant increases in waist and hip circumference, body fat percent and BMR as BMI moves to morbid obesity from normal.
The people who exceed cut-off values for BMI and waist circumference of the metabolic syndrome diagnostic criteria that have been determined by WHO and IDF, were the lowest at the age group 20 - 29. While people having body fat >30% was the lowest at the age group 20 - 29, it was noticed that there has been many obese patients with respect to body fat percent at the age group 10 - 19 (Table 3).
4. DISCUSSIONS
The criteria which is mostly used to determine nutriational status, under and over nourished people is the weight that is adjusted according to height. However, BMI doesn’t give the right opinion about body fat, especially at very low BMI levels and at people who have high muscle mass than normal. On the other hand, the body composition measurements, give more valuable assesment about nutritional conditions [2,11].
Bioelectrical impedance analysis (BIA) is a safe, noninvasive and proper way to determine the body fat and lean mass which is easily applied. The individual’s age, sex, ethnic characteristics, hydration status, some medical conditions, environmental conditions, physical activity, personal characteristics are important factors that affect the results of BIA [2,11-13]. So that, it is important to follow the standart measuring protocols to achieve valid results when BIA is going to be used to determine the body compositions [12-14].
Obesity is defined as the accumulation of extreme body fat. It’s estimated that normal body fat level is the 12% - 20% of the body weight in men and is about 20% - 30% in women in young adults. It has been suggested that body fat percent exceeding 30% in women and 20% in men is accepted as obesity [2,6]. There may be people who are normal according to BMI but at the same time they may have high risk of metabolic and cardiovascular diseases (called normal weight, metabolicaly obese) and there may also be obese people but normal according to metabolic parameters. The prevalence and correlates of
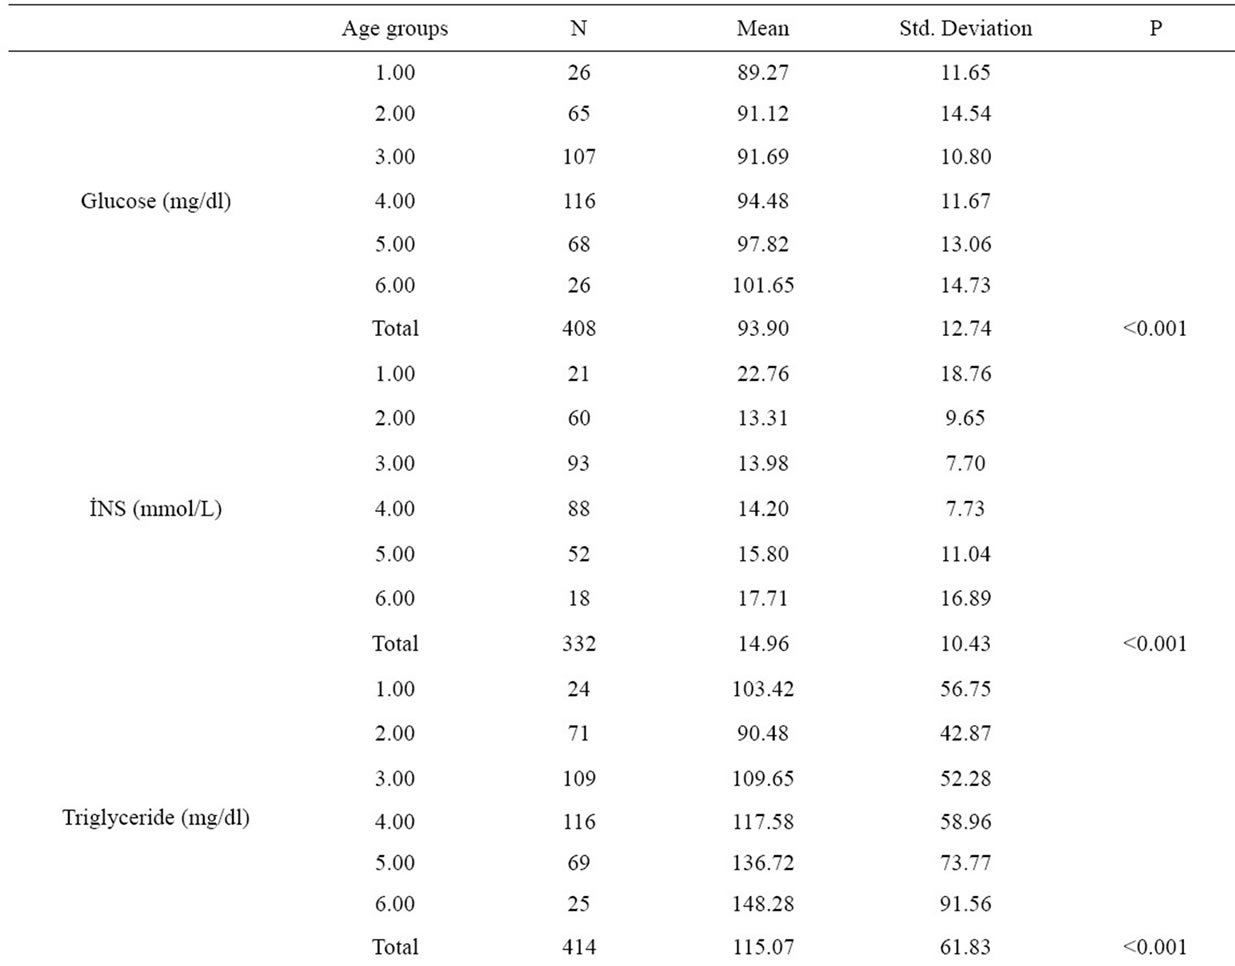
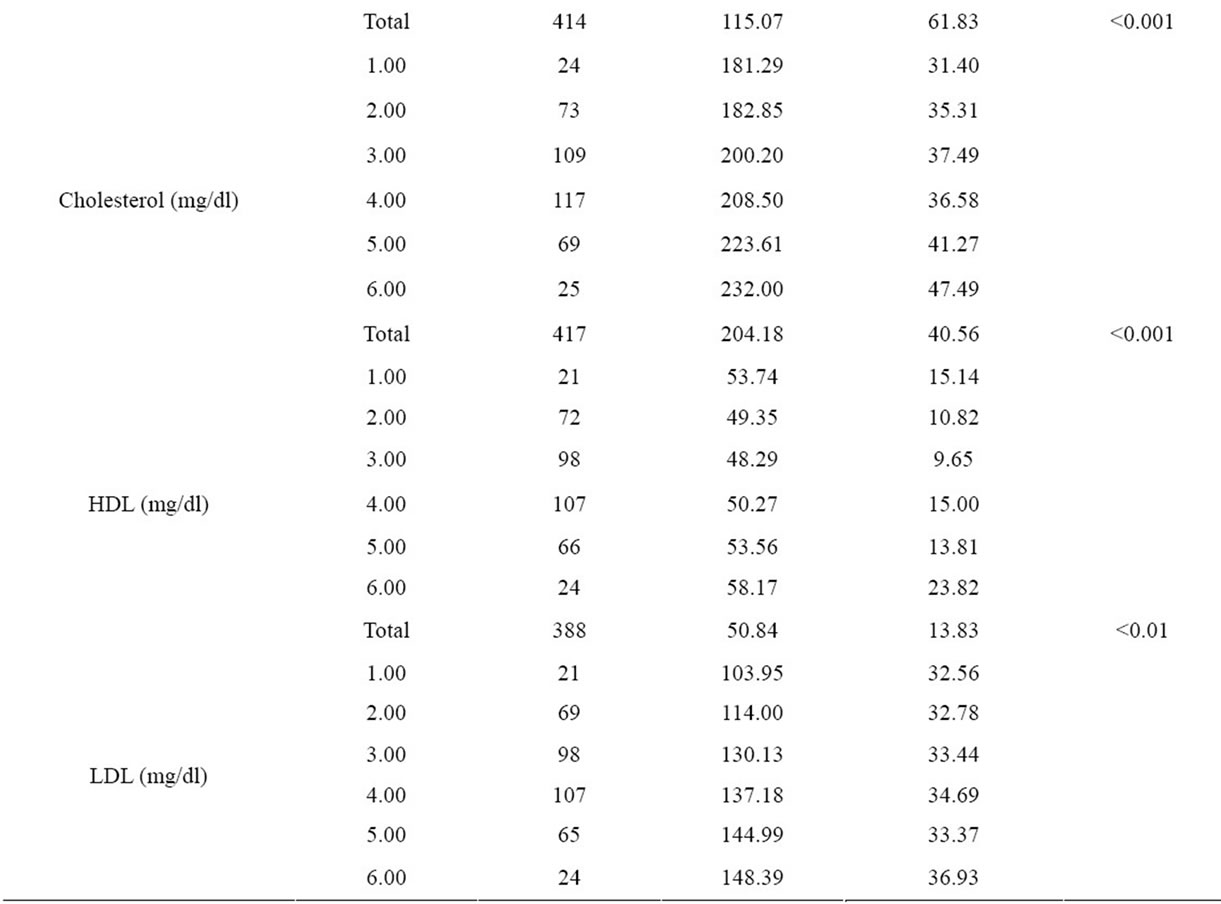
Table 2. Comparision of biochemical parameters of age groups.
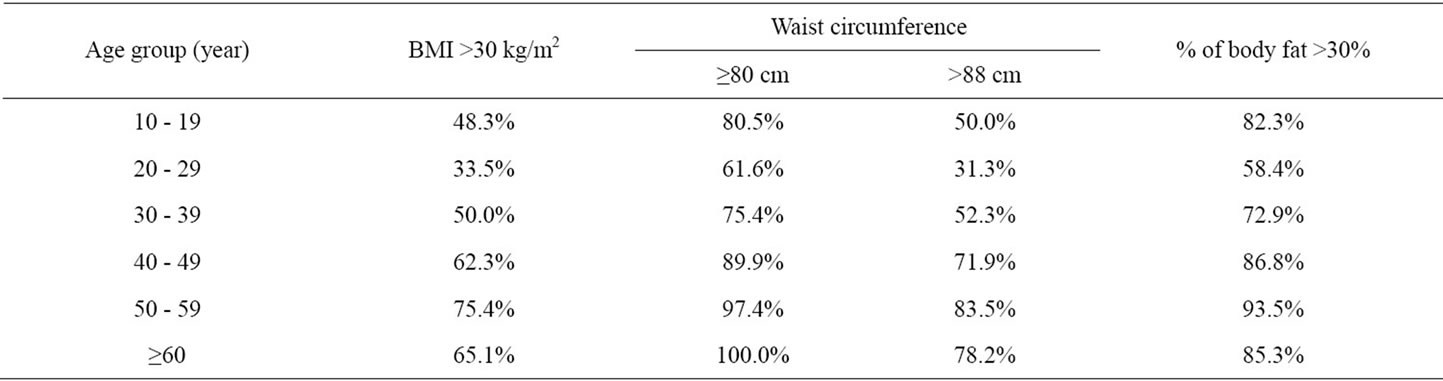
Table 3. Women whose BMI, waist circumference and body fat percent exceed cut-off values of the Metabolic Syndrom diagnostic criteria according to their age group.
obese individuals who are resistant to development of the adiposityassociated cardiometabolic abnormalities and normal-weight individuals who display cardiometabolic risk factor clustering are not well known. In a cross-sectional study among US adults, there is a high prevalence of clustering of cardiometabolic abnormalities among normal-weight individuals and a high prevalence of overweight and obese individuals who are healthy [15]. For this reason only BMI measurement seems not enough to estimate the cardiometabolic risks.
In defining obesity related health risks, not only the amount of total body fat mass but also the distribution of the fat in the body is important. Measurement of abdominal obesity is strongly associated with increased cardiometabolic risk, cardiovascular events, and mortality [2]. Although waist circumference is a crude measurement, it correlates with obesity and visceral fat amount, and is a surrogate marker for insulin resistance. One criterion for the diagnosis of the metabolic syndrome, according to different study groups, includes measurement of abdominal obesity (waist circumference or waist-to-hip ratio) because visceral adipose tissue is a key component of the syndrome [16]. For this reason, especially at epidemiologic studies, waist and hip circumferences are frequently used.
In our study, waist circumferences lower than 80 cm were only found in women having normal BMI in all age groups. WHR was over 0.85 cm in morbidly obese women in age groups 1, 3 and 6. It was noteworthy that the mean values of BMI and WC (30.62 ± 6.37 kg/m2 and 88.74 ± 3.27 cm, respectively) were found to be the highest in the age group of 10 - 19 (Figure 1).
In a study, it was found out that changes in BMI from 0 - 10 years were associated with greater fat-mass at age 15. Greater increases in BMI from age 8.5 - 10 years are most strongly associated with cardiovascular risk factors at age 15, with much of these associations mediated by fat-mass at this age. This study suggests that associations between early overweight and subsequent adverse cardiovascular health are largely due to overweight children tending to remain overweight [17].
The metabolic syndrome is characterized by abdominal obesity and clustering of other cardiovascular risk factors including impaired glucose regulation, raised triglicerides, decreased high density lipoprotein cholesterol (HDL-C), elevated blood pressure (BP) and hyperinsulinaemia with underlying insulin resistance [18]. Insulin resistance and abdominal obesity have received the most attention as the putative underlying features which may explain the frequently observed clustering of the other components.
Many institutions (WHO, NCEP ATP III, AHA/NHLBI, IDF) have published criteria for the diagnosis of MetS until today. IDF, which is one of these, has dropped the cut-off value for especially waist circumference and blood glucose levels to diagnose MetS [19]. According to this, for the women who have ³80 cm waist circumference, there are at least two more criteria needed to be diagnosed as MetS [20].
In our study, overweight [25.0 - 29.9 kg/m2] women in each age group had a mean WC greater than 80 cm, which has been interpreted as not only obese or morbidly obese but also people who are overweight can possess health risks.
Obesity and intra-abdominal adipose tissue (IAAT) accumulation are associated with increased vascular risk [21]. Different fat deposits exhibit varying metabolic activity, with IAAT being associated with insulin resistance [22]. There is a growing acceptance that for a given waist circumferenceregardless of overall body weightpeople have similar health risks; waist circumference is a useful surrogate marker of IAAT [23].
In our study the waist circumference has shown significant differences between age groups (p < 0.001); the lowest values were at the age group 20 - 30, the highest values were at 60 and over (Figure 1). It was also found that the body fat ratio showed significant differeences between age groups and increased together with the ages.
According to IDF criterion, intersection values for WC (80 cm) were exceeded only in women having normal BMI at the age group of over 60’s; where this intersection value is over 80 cm in other BMI groups at every age decades. And according to NCEP ATP III classification, WC was found over intersection value (88 cm) in women who were obese and morbidly obese at every age group. These data made us to predict that women over 60’s althought having normal BMI, are more susceptible to metabolic and cardiovascular risks because of an increase in their WC more than expected.
Burgeoning obesity, insulin resistance, diabetes and cardiovascular disease in children and adolescent is a major cause for concern. The prevalence of metabolic syndrome amongst 12 - 19 year olds has almost doubled in the last 10 years. The results of our study indicates important findings with respect to the secular trends at adolescence age group. It’s been determined that the height is the maximum at age group 10 - 19 and it is decreasing at the following age decades and is the lowest at the age group 60 - 69. On the other hand, blood insulin and HOMA-IR values have shown significant differences between the age groups, the highest value has been determined at the age group 10 - 19 (Table 2). A systematic review demonstrated that high body mass index (BMI) from age seven onwards is associated with an increased risk of coronary heart disease in adulthood [24]. Several cross-sectional studies have demonstrated that childhood obesity is associated with increased levels of cardiovascular risk factors [25-28]. So, we saw that findings of our study were consistent with other studies in this field.
In our study, we have detected significant differences in fasting blood glucose, insulin, triglyceride, total cholesterol, HDL and LDL cholesterol levels and HOMA-IR index in between every age group. On the other hand, it was determined that HOMA-IR index was over 4.0 in the age group of 10 - 19, 50 - 59 and over 60’s. HOMA-IR index is frequently used to point out insulin resistance at present days and when calculated values are over 4.0, it is accepted to be having insulin resistance [29,30].
We observed that the age group of 20 - 29 was having the minimum health risk in developing the illnesses related to obesity. This aspect was interpreted that women at those ages are showing more intrest in their physical appreance and their health. Women exceeding intersection points of metabolic syndrom diagnosis criteria increased gradually from the age of 30’s (Table 3). Besides, the number of people who are exceeding those intersection points in the group of 10 - 19, was noteworthy. These results showed us that not only the women who are in the age of 50’s and more but also the youths in adolescence are having the health risks related to obesity.
To our knowledge, no other studies have demonstrated associations between adiposity changes of age decades and cardiometabolic risk factors in females; further studies are needed to validate this result. According to the data of our study, we arrived at a final conclusion that generalizing perpetual and effective education, concerning families and even the educators, starting from the childhood, can be useful.

REFERENCES
- Sakurai, T., Iimuro, S., Araki, A., Umegaki, H., Ohashi, Y., Yokono, K. and Ito, H. (2010) Age-associated increase in abdominal obesity and insulin resistance, and usefulness of AHA/NHLBI definition of metabolic syndrome for predicting cardiovascular disease in Japanese elderly with type 2 diabetes mellitus. Gerontology, 56, 141-149. doi:10.1159/000246970
- Saltzman, E. and McCrory, M.A. (2008) Phsical assessment of nutritional status. In: Coulston, A.M. and Boushey, C.J., Eds., Nutrition in the Prevention and Treatment of Disease, 2nd Edition, Elsevier Academic Press, California, 57-73.
- Kutlutürk, F., Öztürk, B., Yıldırım, B., Özuğurlu, F., Çetin, İ., Etikan, İ. and ve ark. Sazlıdere, H (2011) Obezite prevalansı ve metabolik risk faktorleri ile ilişkisi: Tokat ili prevalans calışması. Turkiye Klinikleri, 31, 156- 163. doi:10.5336/medsci.2009-14563
- Lahmann, P.H., Lissner, L., Gullberg, B. and Breglund, G. (2002) A prospective study of adiposity and all cause mortality: The malmo diet and cancer study. Obesity Research, 10, 361-369. doi:10.1038/oby.2002.50
- Heitmann, B.L., Erikson, H., Ellsinger, B.M., et al. (2000) Mortality associated with body fat, fat-free mass and body mass index among 60-year old Swedish man—A 22-year follow-up. The study of man born in 1913. International Journal of Obesity, 24, 33-37. doi:10.1038/sj.ijo.0801082
- Ozenoglu, A., Ugurlu, S., Can, G. and Hatemi, H. (2009) Reference values of body composition for adult females who are classified as normal weight, overweight and obese according to body mass index. Endocrine Regulations, 43, 29-37. doi:10.4149/endo_2009_01_29
- Must, A. and Anderson, S.E. (2003) Effects of obesity on morbidity in children and adolescents. Nutrition in Clinical Care, 6, 4-12.
- Johnson, L., Mander, A.P., Jones, L.R., Emmett, P.M. and Jebb, S.A. (2008) Energy-dense, low-fiber, high-fat dietary pattern is associated with increased fatness in childhood. American Journal of Clinical Nutrition, 87, 846-854.
- Reedy, J. and Krebs-Smith, S.M. (2010) Dietary sources of energy, solid fats, and added sugars among children and adolescents in the United States. Journal of the American Dietetic Association, 110, 1477-1484. doi:10.1016/j.jada.2010.07.010
- Vartanian, L.R., Schwartz, M.B. and Brownell, K.D. (2007) Effects of soft drink consumption on nutrition and health: A systematic review and meta-analysis. American Journal of Public Health, 97, 667-675. doi:10.2105/AJPH.2005.083782
- Kyle, U.G., Piccoli, A. and Pichard, C. (2003) Body composition measurements: Interpretation finally made easy for clinical use. Current Opinion in Clinical Nutrition & Metabolic Care, 6, 387-393. doi:10.1097/01.mco.0000078988.18774.3d
- Dehghan, M. and Merchant, A.T. (2008) Is bioelectrical impedance accurate for use in large epidemiological studies. Nutrition Journal, 7, 26. doi:10.1186/1475-2891-7-26
- Coppini, L.Z., Waitzberg, D.L. and Campos, A.C.L. (2005) Limitations and validation of bioelectrical impedance analysis in morbidly obese patients. Current Opinion in Clinical Nutrition & Metabolic Care, 8, 329-332. doi:10.1097/01.mco.0000165013.54696.64
- Shafer, K.J., Siders, W.A., Johnson, L.K. and Lukaski, H.C. (2009) Validity of segmental multiple-frequency bioelectrical impedance analysis to estimate body composition of adults across a range of body mass indexes. Nutrition, 25, 25-32. doi:10.1016/j.nut.2008.07.004
- Wildman, R.P., Munter, P., Reynold, K., McGinn, A.P., Rajpathak, S., Wylie-Rosett, J. and Sowers, M.R. (2008) The obese without cardiometabolic risk factor clustering and normal weight with cardiometabolic risk factor clustering. Archives of Internal Medicine, 168, 1617-1624. doi:10.1001/archinte.168.15.1617
- Ness-Abramof, R. and Apovian, C.M. (2008) Waist circumference measurement in clinical practice. Nutrition in Clinical Practice, 23, 397-404. doi:10.1177/0884533608321700
- Howe, L.D., Tilling, K., Benfield, L., Logue, J., Sattar, N., et al. (2010) Changes in ponderal ındex and body mass ındex across childhood and their associations with fat mass and cardiovascular risk factors at age 15. PLoS One, 5, e15186. doi:10.1371/journal.pone.0015186
- Eckel, R.H., Alberti, K.G., Grundy, S.M. and Zimmet, P.Z. (2010) The metabolic syndrome. Lancet, 375, 181-183. doi:10.1016/S0140-6736(09)61794-3
- Alberti, K.G., Zimmet, P. and Shaw, J. (2006) The metabolic syndrome—A new worldwide definition. A consensus statement from the international diabetes federation. Diabetic Medicine, 23, 469-480. doi:10.1111/j.1464-5491.2006.01858.x
- Saely, C.H., Rein, P. and Drexel, H. (2007) The metabolic syndrome and risk of cardiovascular disease and diabetes: Experiences with the new diagnostic criteria from the international diabetes federation. Hormone and Metabolic Research, 39, 642-650. doi:10.1055/s-2007-985822
- Goodpaster, B.H., Krishnaswami, S., Haris, T.B., Katsiaras, A., Kritchevsky, S.B., Simonsick, E.M., Nevitt, M., Holvoet, P. and Newman, A.B. (2005) Obesity, regional body fat distribution, and the metabolic syndrome in older men and women. Archives of Internal Medicine, 165, 777-783. doi:10.1001/archinte.165.7.777
- Wajchenberg, B.L. (2000) Subcutaneous and visceral adipose tissue: Their relation to the metabolic syndrome. Endocrine Reviews, 21, 697-738. doi:10.1210/er.21.6.697
- Day, C. (2007) Metabolic syndrome, or what you will: Definitions and epidemiology. Diabetes & Vascular Disease Research, 4, 32-38. doi:10.3132/dvdr.2007.003
- Owen, C.G., Whincup, P.H., Orfei, L., Chou, Q.-A., Rudnicka, A.R., et al. (2009) Is body mass index before middle age related to coronary heart disease risk in later life? Evidence from observational studies. International Journal of Obesity, 33, 866-877. doi:10.1038/ijo.2009.102
- Must, A. and Strauss, R.S. (1999) Risks and consequences of childhood and adolescent obesity. International Journal of Obesity, 23, S2-S11. doi:10.1038/sj.ijo.0800852
- Sinha, R., Fisch, G., Teague, B., Tamborlane, W.V., Banyas, B., et al. (2002) Prevalence of ımpaired glucose tolerance among children and adolescents with marked obesity. New England Journal of Medicine, 346, 802-810. doi:10.1056/NEJMoa012578
- Fraser, A., Longnecker, M.P. and Lawlor, D.A. (2007) Prevalence of elevated alanine aminotransferase among us adolescents and associated factors: NHANES 1999- 2004. Gastroenterology, 133, 1814-1820. doi:10.1053/j.gastro.2007.08.077
- Freedman, D.S., Dietz, W.H., Srinivasan, S.R. and Berenson, G.S. (1999) The relation of overweight to cardiovascular risk factors among children and adolescents: The Bogalusa Heart Study. Pediatrics, 103, 1175-1182. doi:10.1542/peds.103.6.1175
- Magliano, D.J., Shaw, J.E. and Zimmet, P.Z. (2006) How to best define the metabolic syndrome. Annals of Medicine, 38, 34-41.
- Reaven, G.M. (2005) Insulin resistance, the insulin resistance syndrome, and cardiovascular disease. Panminerva Medica, 47, 201-210.