Journal of Sensor Technology
Vol.2 No.3(2012), Article ID:22869,7 pages DOI:10.4236/jst.2012.23016
Discrimination between Chinese Jing Wine and Counterfeit Using Different Signal Features of an Electronic Nose
School of Food & Bioengineering, Henan University of Science & Technology, Luoyang, China
Email: *yinyong@mail.haust.edu.cn
Received June 28, 2012; revised July 29, 2012; accepted August 31, 2012
Keywords: Electronic Nose; Feature Extraction; Health Drink Discrimination; Discrimination Capability
ABSTRACT
Because sensory analysis and chromatographic analysis were not well suitable for the discrimination between Chinese Jing wines and counterfeits, an electronic nose (in short, eNose) was employed to carry out the task. In the investigation three kinds of features of eNose signals were extracted and as input data of principal component analysis (PCA). These features are named as mean-differential coefficient value (MDCV), energy value of wavelet packet decomposition (WE) and relative steady-state response value (RSV), respectively. The results demonstrated that the discrimination based on these features data could all be performed by PCA, and the RSV was the best. At the same time, an evaluation method was proposed to evaluate the discrimination capability of these features quantitatively, and the evaluation results are basically in accord with PCA discrimination results. This showed the evaluation method was appropriate for evaluating the discrimination capability of different features. In conclusion, the investigation indicated that the eNose coupled with PCA was absolutely competent for the discrimination tasks, and especially the feature RSV was simple and reliable.
1. Introduction
Chinese Jing wine is a kind of health drink, besides quality white liquor and pure water. Its components include a lot of traditional Chinese medicines, such as root of membranous milk vetch, ginseng, Chinese yam, Chinese wolfberry fruit, cinnamon, prepared rhizome of rehmannia, Chinese angelica, seed of Chinese dodder and pilose antler. In recent years, Chinese Jing Wine has become gradually a kind of favorite drink because of its benefit to people’s health. For the urge of economic profit some forged Jing wines are already on the market, so the discrimination between Jing wines and counterfeits is very required and necessary. In general, there are two basic test techniques available to be used to discriminate different drinks. The first is the sensory analysis, but sensory analysis is not suitable for counterfeits testing because of its harm to the panel’s health. The second method is instrumental analytical techniques such as gas chromatography (GC) which has higher reliability, but there are much more compounds especially traditional Chinese medicine ingredients in Jing wines, so it is very complicated and expensive to detect these compounds by GC, and we don’t know which kinds of compounds between Jing wine and counterfeits are contributive to perform the discrimination task, either. Therefore, there is a need for new reliable methods to discriminate Jing wines from counterfeits.
The popular devices known as eNose have generated much interest since they appeared on the market at the beginning of the 1990s [1], and over the past years, a lot of attempts using the eNoses for classification wines or alcoholic beverages have been reported [2-7]. The eNose seems to be a very promising solution, because it can overcome the disadvantages of sensory analysis and GC techniques. So, an eNose will be employed to carry out the discrimination task in this work. In terms of the eNose response signals, transient or dynamic responses are often selected as feature signals, because this kind of response signal is a very important part of sensor signals, and contained abundant features of communication [8,9]. However, typical dynamic data of each sensor are more and it will be a big and complex dataset. Therefore feature-extraction is frequently required from these datasets in order to improve the performance of subsequent pattern recognition algorithms and facilitate the discrimination task.
Of late years, many feature extraction methods have been put forward [8-14]. But these methods are limited to some applications and do not always meet the multifarious purposes, because the types of sensors and practical applications are different to some extent [14]. In this paper, in order to discriminate Chinese Jing wines from counterfeits, three types of feature vectors were attempted to discriminate Chinese Jing Wines from counterfeits, and their discrimination capabilities were also investigated. At the same time, the discrimination feasibility was clearly pointed out using eNose, too.
2. Experimental
2.1. Materials and Gas Sensor Array
Two kinds of Chinese Jing wines and five kinds of counterfeits are provided by Chinese Jing Brand Ltd. (in Hubei province, China). The alcohol contents of two kinds of Chinese Jing wines are 38 vol% and 35 vol%, and they are labeled JJ38 and JJ35, respectively. The five kinds of counterfeits are labeled JJ1, JJ2, JJ3, JJ4 and JJ5, respectively.
An eNose mainly consists of an array of gas sensors with different selectivity and pattern recognition software, and the array is a crucial component which responds to volatile compounds of analyte. Aiming at the task, we tried to select a gas sensor array given by Yin et al. [14]. The gas sensor array was composed of 13 TGS sensors made in Japan (Figaro Engineering Inc.), they were TGS-800, TGS-812, TGS-813, TGS-821, TGS-822, TGS-824, TGS-825, TGS-826, TGS-830, TGS-831, TGS-832, TGS-842 and TGS-880. The gas sensor array was placed in a stainless steel test chamber, the size of which was 21 volume and 20 cm diameter. A 16-channel and 12-bit high precision data acquisition system (DAS) was employed for 13 TGS sensors, a humidity sensor and a temperature sensor. The humidity sensor and temperature sensor were employed to test the humidity and temperature of environment, so as to compensate their effects on the gas sensors. Heater voltage of each sensor was 5 ± 0.05 V, the circuit voltage was 10 ± 0.01 V, and the circuit voltages of a humidity sensor and a temperature sensor were also 10 ± 0.1 V.
2.2. Sampling
Two sampling modes, which are 1) purge and trap (PT) and 2) solid-phase micro-extraction (SPME), were considered to be suitable for extracting volatile compounds of wine samples [1]. However, PT cannot be regarded as a rapid sampling method and its sampling time usually requires 1 - 2 h [15], so we did not adopt this sampling method. As far as SPME, because of no configuration connecting with SPME fiber in our experimental setup, we did not adopt the sampling method either.
Accurate quantity of samples is the foundation of analysis during measurement. But the volatile of Jing wines and counterfeits is compressible gas, and it has diffusion activity, so that it is quite difficult to sample accurately for the volatile of Jing wines and counterfeits. According to the literature [13], fixed amounts of Chinese Jing wines or counterfeits were sampled directly and contained in an evaporating dish of 10.0 cm diameter, then the evaporating dish was put in the test chamber; the amount of each testing sample was 5 mL. This method is not only simple but also appropriate.
2.3. Testing Method and Test Results
For each kind of wine (two kinds of Jing wines, five kinds of counterfeits), 10 samples were prepared, thus, a total of 70 samples were tested in the experiment. All samples were tested in random so as to avoid chained analysis corresponding to these kinds. During the measurement, the testing time of the sensor array was 900 s, and the interval between two neighboring response signals was 1 s. The total number of responses of a sensor to one sample was 900 (i.e. 900 data). Moreover, one data was the mean of triplicate response values captured in rapid succession by DAS, which would partially reduce the effect of white noise. The response data of each sensor in 900 s can reflect basically its process of dynamic response. Figure 1 shows the responses of a sensor to sample JJ38. In addition, it took 15 min or so to recuperate these sensors before the next measurement.
In order to reduce the effects of temperature and humidity on the gas sensor responses, two steps were adopted. Firstly, the response of each sensor to the air of the lab was also measured on the condition of temperature and humidity of lab before testing the volatile samples, so the baseline value corresponding the temperature and humidity of the lab would be obtained. Then, the baseline value was subtracted from the corresponding 900 data of each sensor to one sample, and 900 difference values were obtained. The one difference value was as one test result of each sensor to one sample in one second. This treatment method is named “baseline-
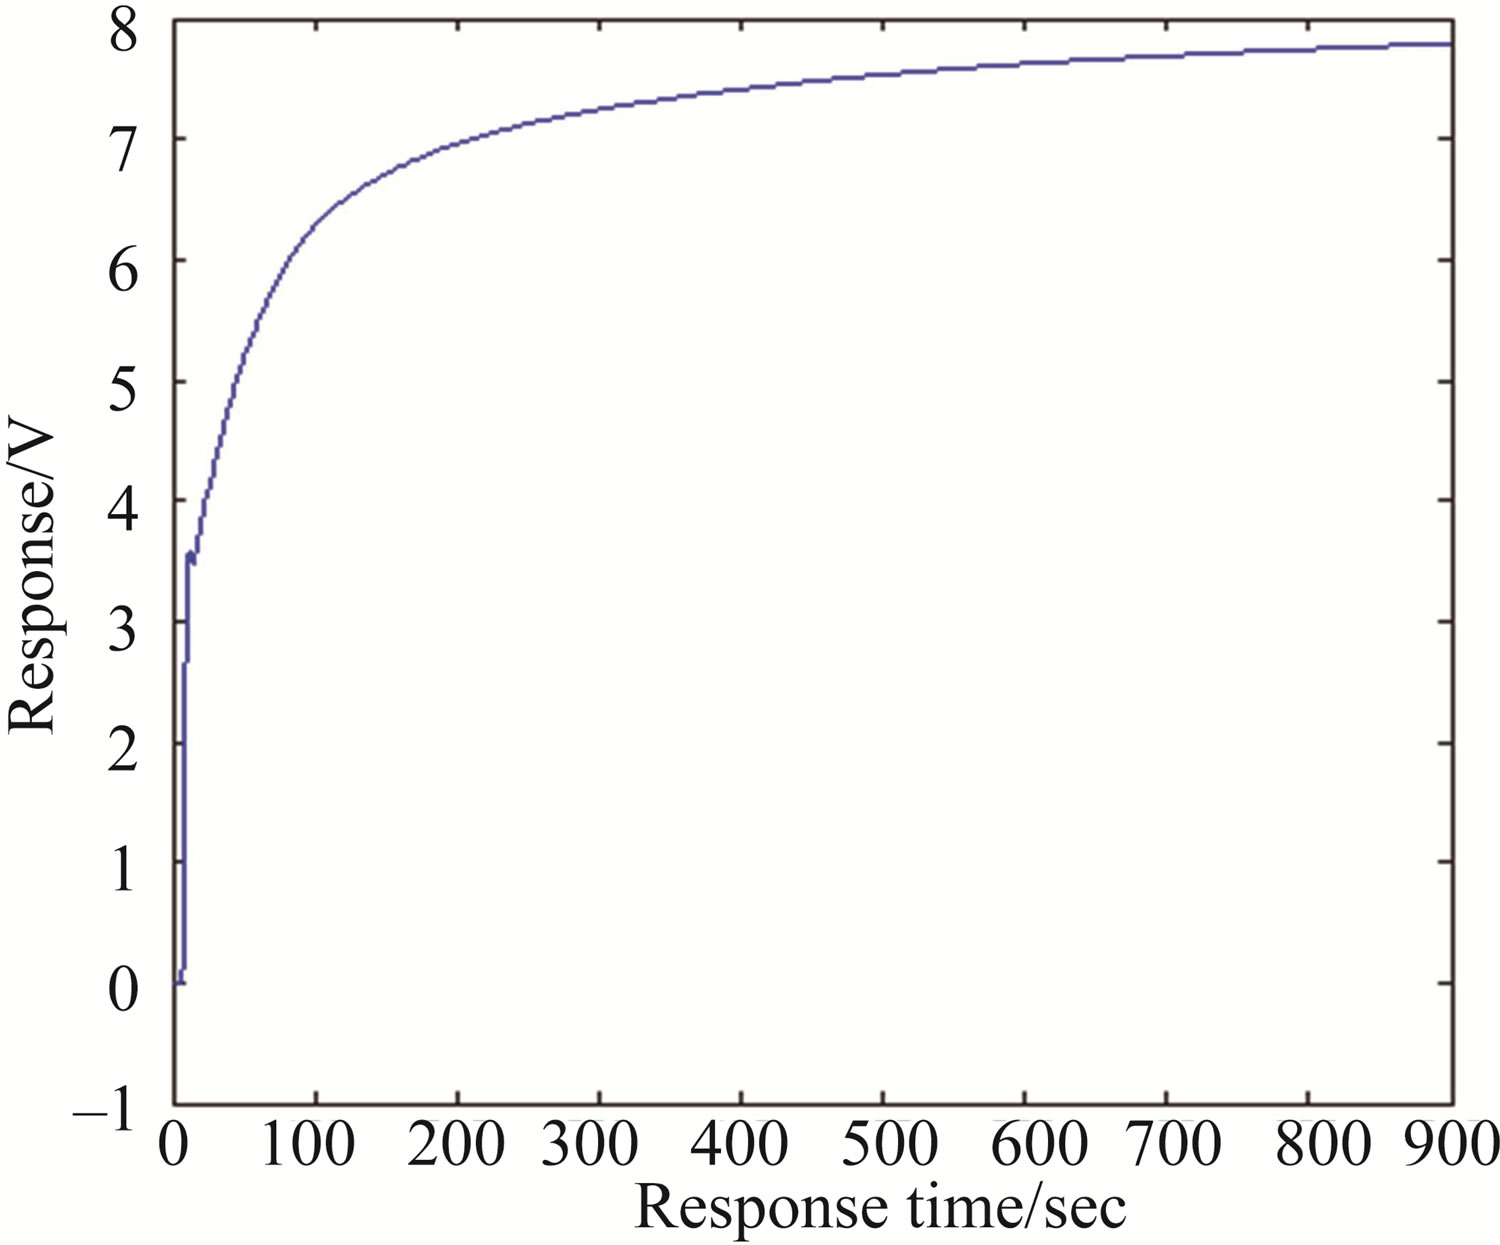
Figure 1. Response curve of TGS813 to sample JJ38.
removing pretreatment”. Secondly, the values of temperature and humidity were simultaneously measured so as to further compensate their effects. The details will be discussed later.
3. Feature Extraction and Discussion
3.1. Features Selection and Pattern Recognition
A feature called mean-differential coefficient value (in short, MDCV) was pointed out that this feature could reflect the average velocity of sensor responses and represent its mainstream traits [13], thus, the MDCV was selected as a feature extraction in this paper. In [14], Yin et al. used a kind of energy values of approximation coefficient set based on wavelet packet decomposition to discriminate successfully three kinds of Chinese vinegars, so we considered this feature extraction method with very interest as the second selection, and we called this method as WE. Figure 1 shows that the change of the response signal in range of 700 to 900 s is rather slow, which is relative steady-state response. Enlightened by the idea that steady-state signal was frequently taken as feature value, some response values situated in relative steady-state portion of the response curve were selected as features for discrimination. In practice, in our examination the steady-state response was not absolute constant, and was relatively affected by the airproof capability of the test chamber, so we selected relative steadystate response instead of steady-state response as analysis data. This feature extraction method was named as RSV, namely, the third feature selection method.
Pattern recognition technique is a very important part of eNose [4]. PCA is one of the most popular pattern recognition algorithms. It is useful for a graphic visualization of some different kinds of classes, and can well reduce the dimensionality of the sample data matrix while it captures the underlying variations and relationship among the variables [16]. PCA is also a very useful classification technique widely used in the gas-sensing area [17]. So, PCA was selected as a pattern recognition algorithm in our investigation. In addition, all analysis data matrixes corresponding to each kind of feature were treated with normalization, and we regarded Jing wines and counterfeits as two classes.
3.2. Features Extraction Based on MDCV and PCA Discrimination
The MDCV of a response curve of a sensor is defined by the following expression [13]:
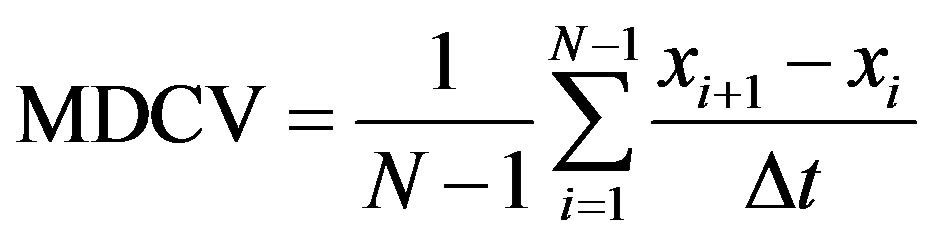 (1)
(1)
where N is the total number of the test results (N = 900) of a sensor to a sample, xi the i-th test result of the sample, xi + 1 the (i + 1)-th test result of the sample, and Dt is a time interval (Dt = 1 s) of two neighborhood test results.
Therefore, 70 feature vectors corresponding to 70 samples could be obtained, and each feature vector was consisted of 13 MDCV of 13 sensors response curve. In order to further compensate the effects of temperature and humidity on the gas sensor responses, humidity and temperature values corresponded to each sample were considered as input parameters of PCA (the same below). This compensation is called as the compensation method based on learning of humidity and temperature [13]. So, an input vector of PCA consisted of 13 MDCV feature values, one temperature value and one humidity value, the analysis matrix was 70 × 15 dimensions.
In order to carry out the discrimination tasks, we adopt a selection method of principal component (PC) given by [13], i.e. the PC selection method based on Wilks L-statistic, and the L-statistic value is defined by:
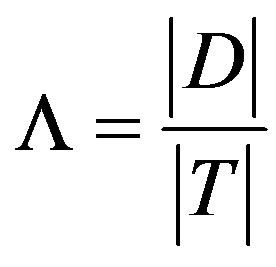 (2)
(2)
where L is Wilks L-statistic value, D the matrix of sum squares of deviations within classes, and T is the matrix of total sum squares of deviations for classes.
According to the idea of Wilks distribution, the less the value of  and the bigger the value of
 , the more significant difference between classes, and it is used to classify these classes. The details see in the literature [13].
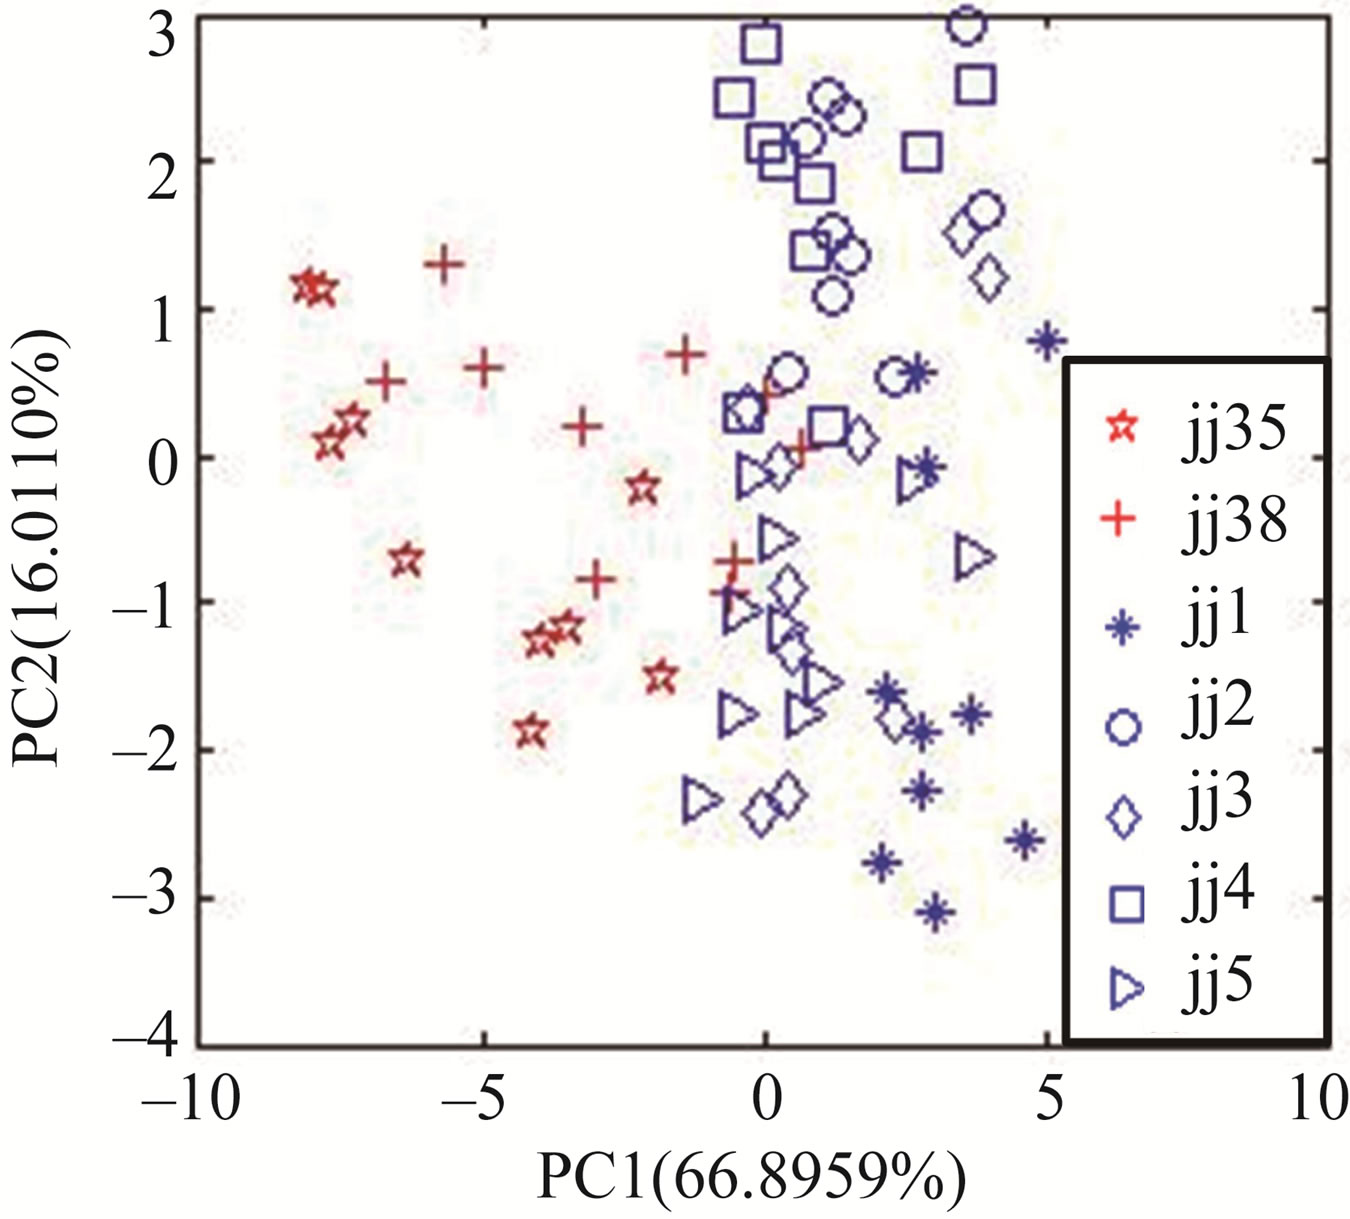
Using expression (2), the L-statistic value corresponding PC1 and PC2 is 0.1139, the L-statistic value corresponding PC1 and PC3 is 0.0620 that is the least in all two-PC chosen in PC analysis matrix. So, PC1 and PC3 are selected for PCA diagram, as shown in Figure 2. Figure 2(a) shows the Jing wines and counterfeits can not be accurately discriminated by PC1 and PC2 at all, but the Jing wines can be correctly discriminated from counterfeits by PC1 and PC3 (see Figure 2(b)). This indicates that principal component selected by Wilks L-statistic value is effective for PCA, and the feature extraction method is also effective for the discrimination tasks.
3.3. Features Extraction Based on WE and PCA Discrimination
According to the method of wavelet packet decomposition described by [14], we selected Daubechies wavelet of the 3rd order by comparing and computing different wavelet bases. The energy value corresponding to every coefficient set or frequency band under the s-scale wavelet packet decomposition is defined by:
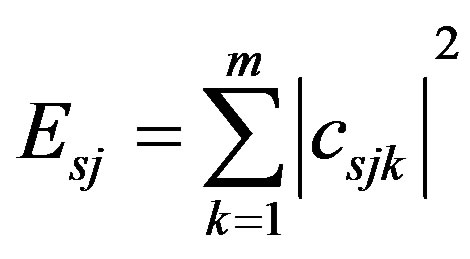 j = 0, 1, 2, ···, 2s – 1, (3)
 (a)
(a)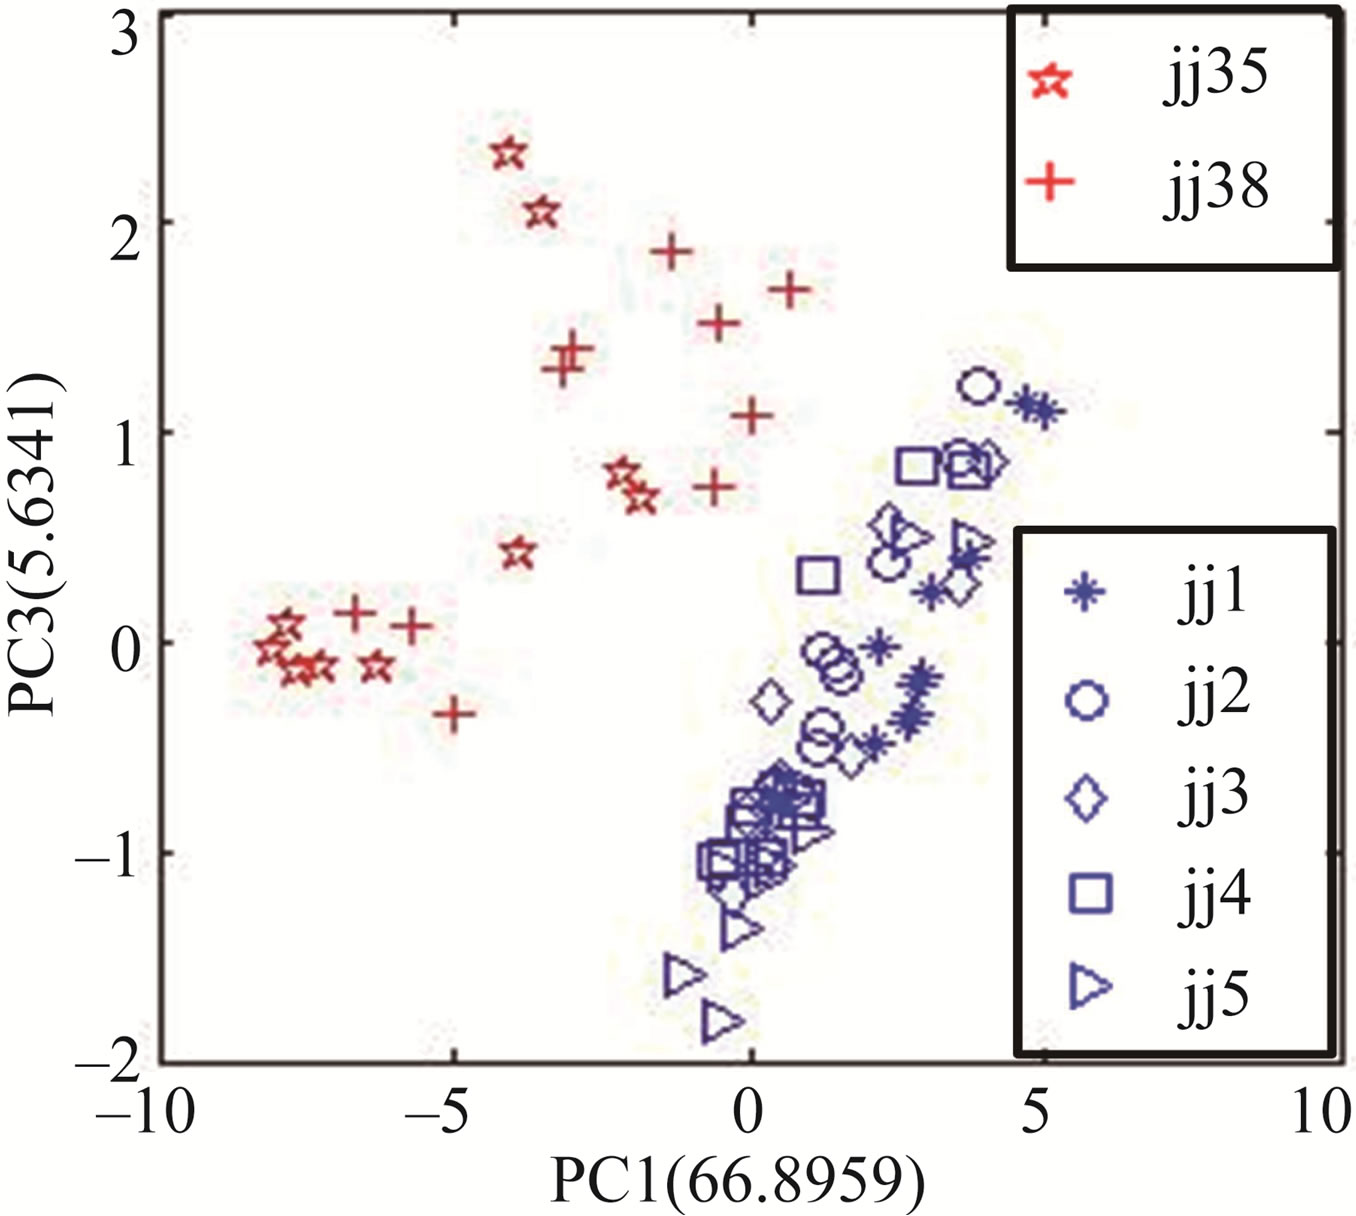 (b)
(b)
Figure 2. The PCA results between Jing wines and counterfeits based on MDCV. (a) The discrimination based on PC1 and PC2; (b) The discrimination based on PC1 and PC3.
where Esj is the energy value corresponding to the j-th coefficient set under the s-scale wavelet packet decomposition, s the scale of wavelet packet decomposition, m the number of coefficients, csjk the k-th coefficient of the j-th coefficient set.
By analyzing all signals (70 × 13 = 910) of 13 sensors to 70 samples, we found that the 910 energy values of approximation coefficient set (j = 0) under five-scale wavelet packet decomposition corresponding 910 signals were the largest than other detail coefficient sets (j ≠ 0), i.e. all 910 E50 were the largest, and every E50 were more than 99% of total energy corresponding the signal. Thus, the 910 E50 corresponding to 910 signals were selected as feature values for the discrimination tasks. Considering the humidity and temperature values, the analysis matrix of PCA was also 70 × 15 dimensions.
With the help of PCA and expression (2), the L-statistic value corresponding PC1 and PC2 was 0.0203 and the least in PC analysis matrix, so PC1 and PC2 were selected for PCA plot. Figure 3 shows clearly the Jing wines can be more accurately discriminated from the counterfeits. This indicates the type of feature can be used to fulfill the discrimination tasks.
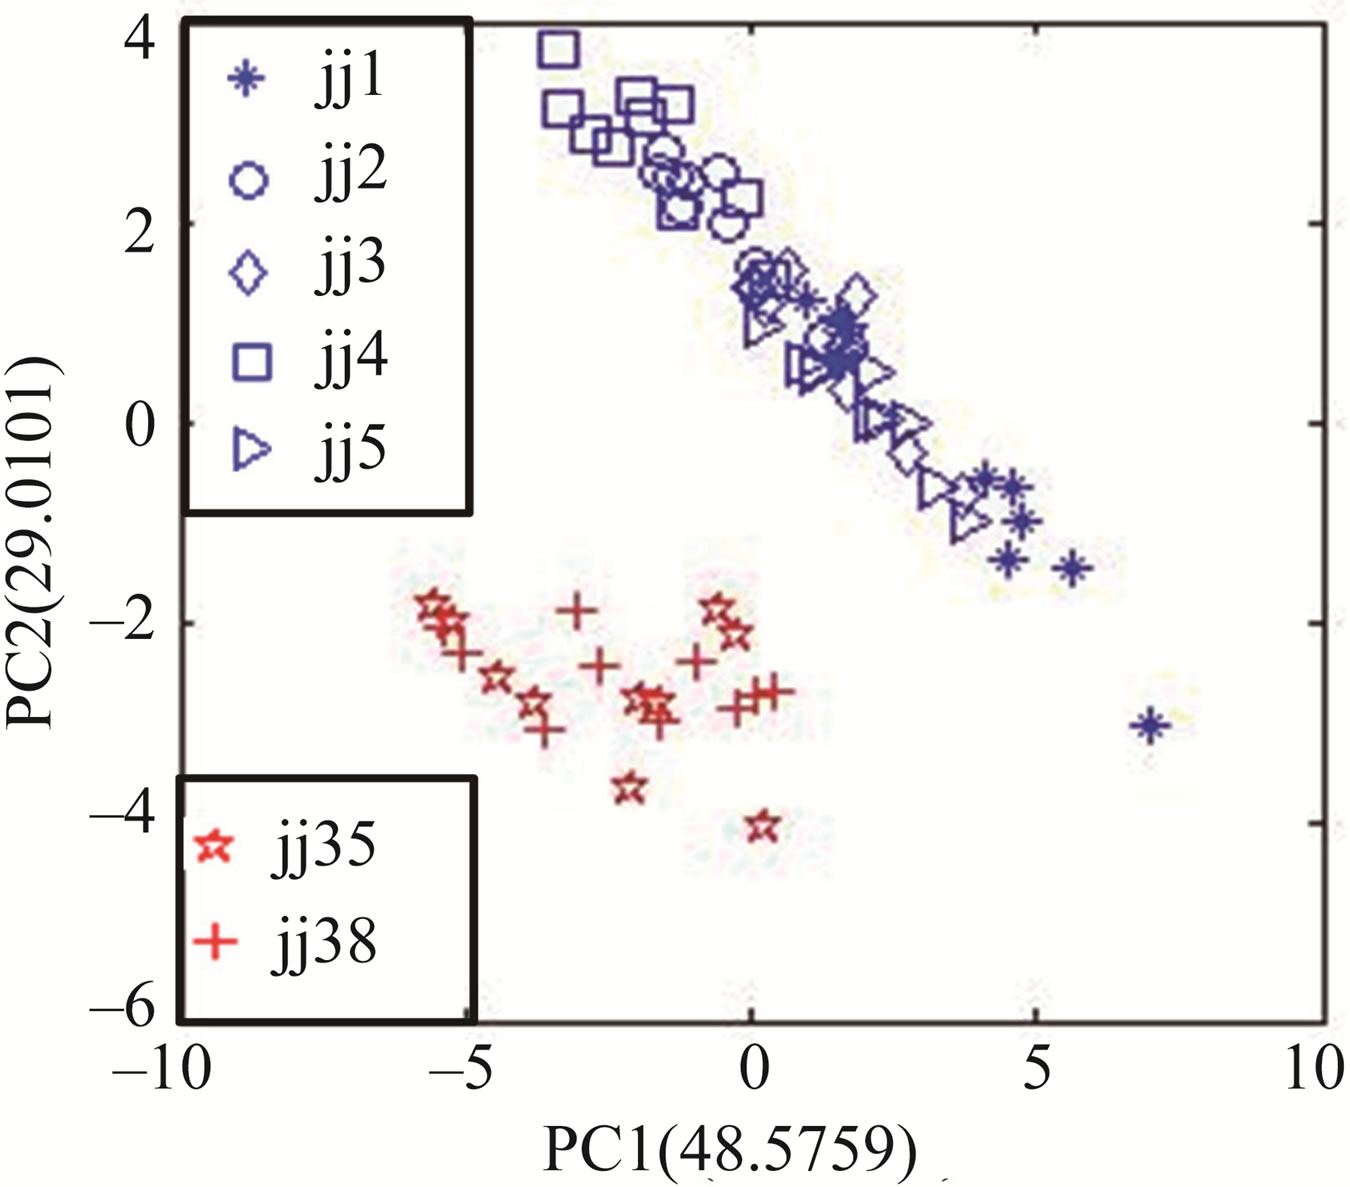
Figure 3. The PCA results between Jing wines and counterfeits based on WE.
3.4. Features Extraction Based on RSV and PCA Discrimination
According to aforementioned the third feature extraction method and Figure 1, response values of each sensor at 700, 800 and 900 s were picked out as features and analyzed respectively. Three analysis matrixes were all 70 × 15 dimensions.
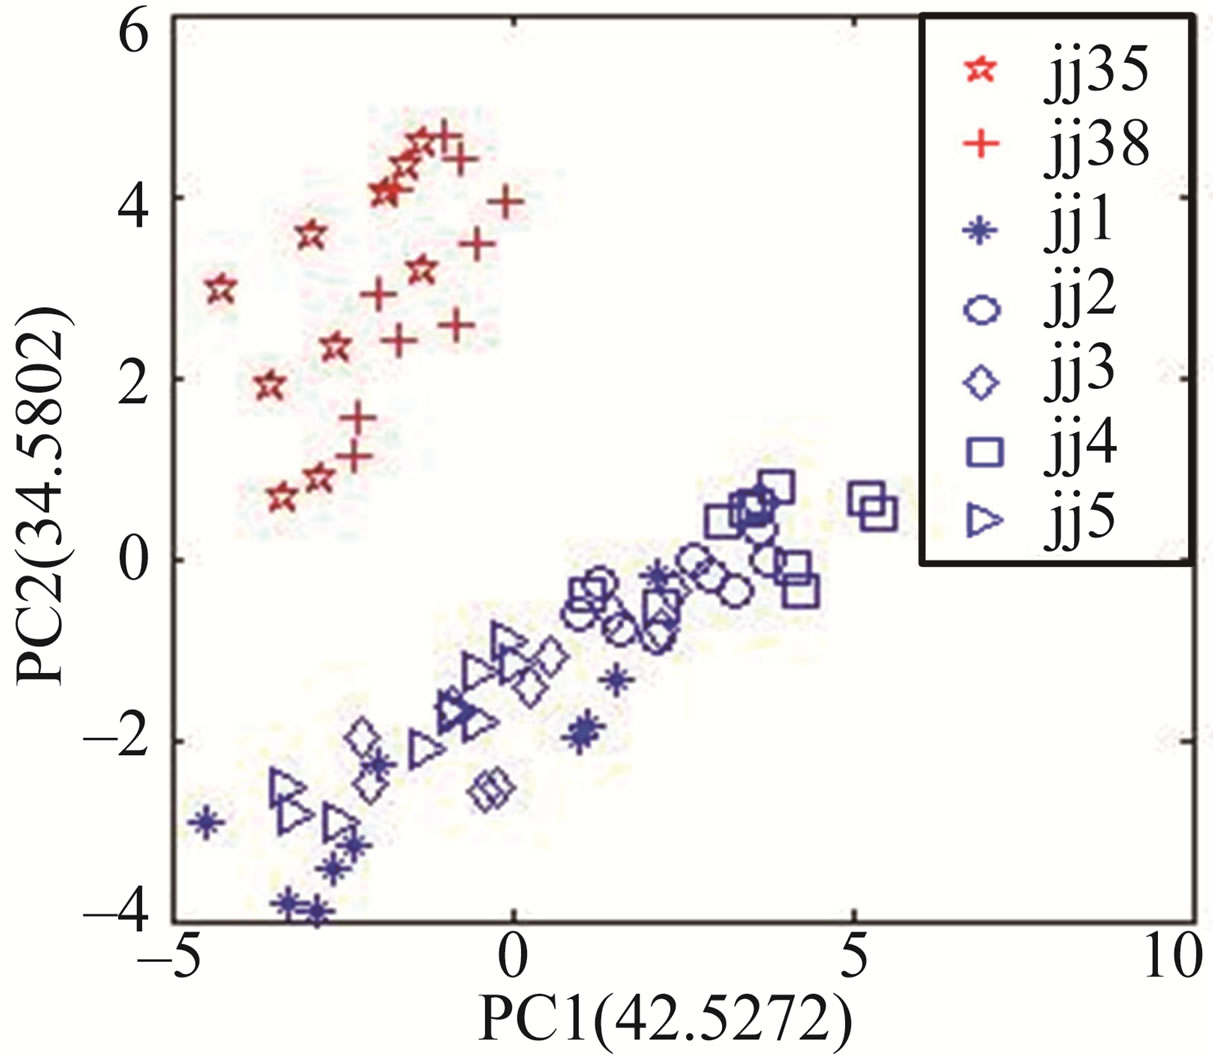
Figure 4 shows the result of PCA corresponding to the response signals at 700, 800 and 900 s. The L-statistic values corresponding PC1 and PC2 are respective 0.0247 (for 700 s), 0.0248 (for 800 s) and 0.0250 (for 900 s), and these values are respective the least in their corresponding PC analysis matrix.
From Figure 4, the three PCA diagrams can be find almost same, this shows the response signal in range of 700 to 900 s is in relative steady state. In order to explain the range of 700 to 900 s being relative steady state, the PCA based on the response signals at 600 s is carried out, as seen in Figure 5. Comparing with Figure 4, there is obvious difference. This shows the response at 600 s is different from that of 700, 800 and 900 s, so the range of 700 to 900 s is relative steady state section.
In addition, using the response values at 600 s as features the discrimination between Jing wines and counterfeits was also carried out well, and the discrimination tasks were performed well using the response values at 400 and 500 s, respectively, too. This indicates that the tasks are simple and easy, and the eNose is competent for the discrimination tasks. The reason for this case is that there are essential differences between Jing wines and counterfeits, and the response value at different time can directly reflect the characteristics of their quality and difference between the two classes. In opposition to these features, a portion of difference information is likely to be removed in the process of extracting features by MDCV and WE, therefore the methods of MDCV and WE do not excel the response values as features in aspect of discrimination effect. This will be explained in Section 3.5.
 (a)
(a)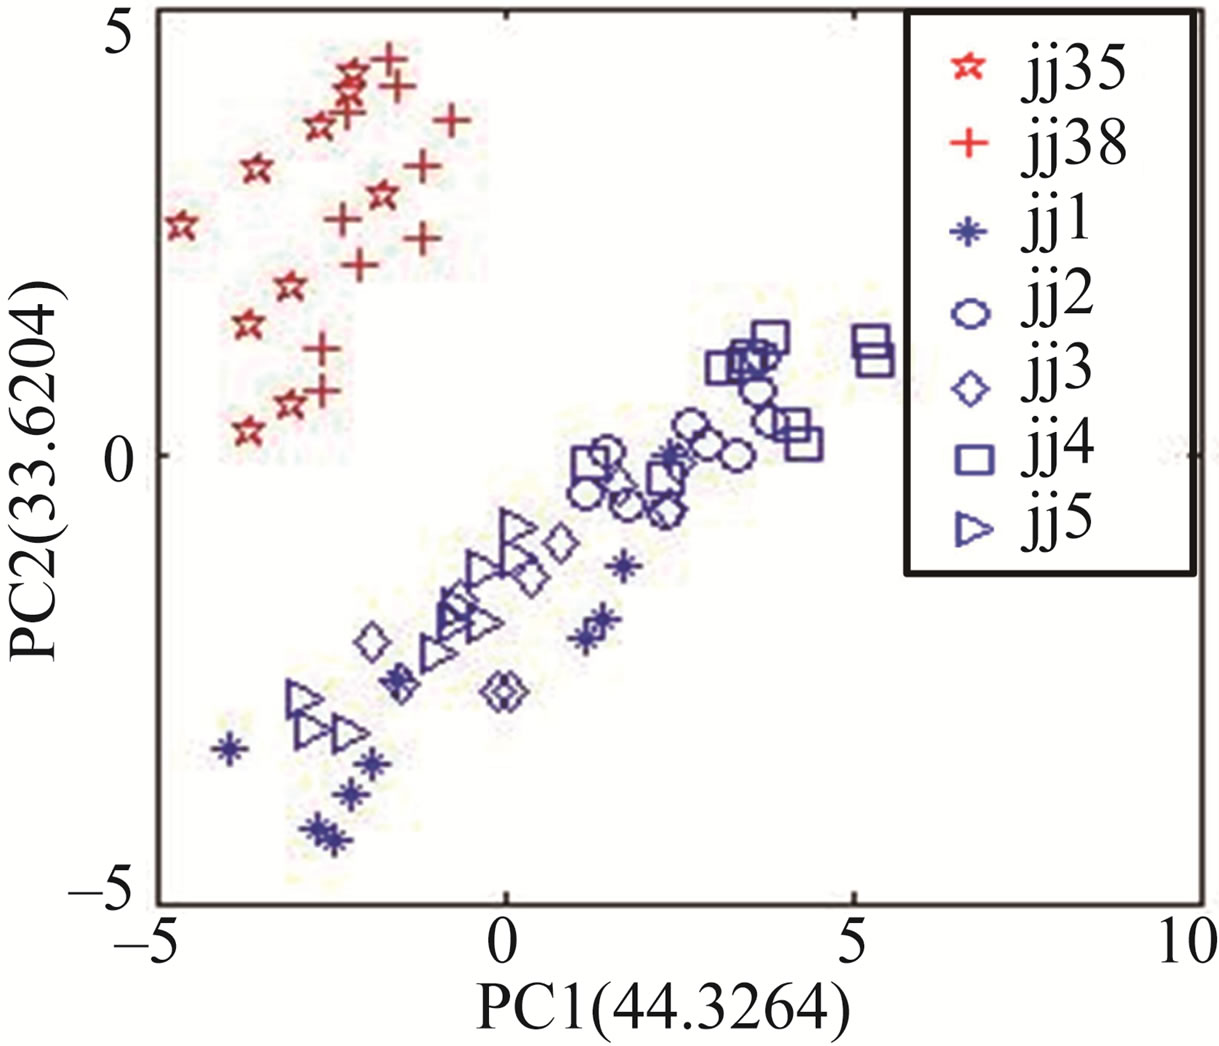 (b)
(b)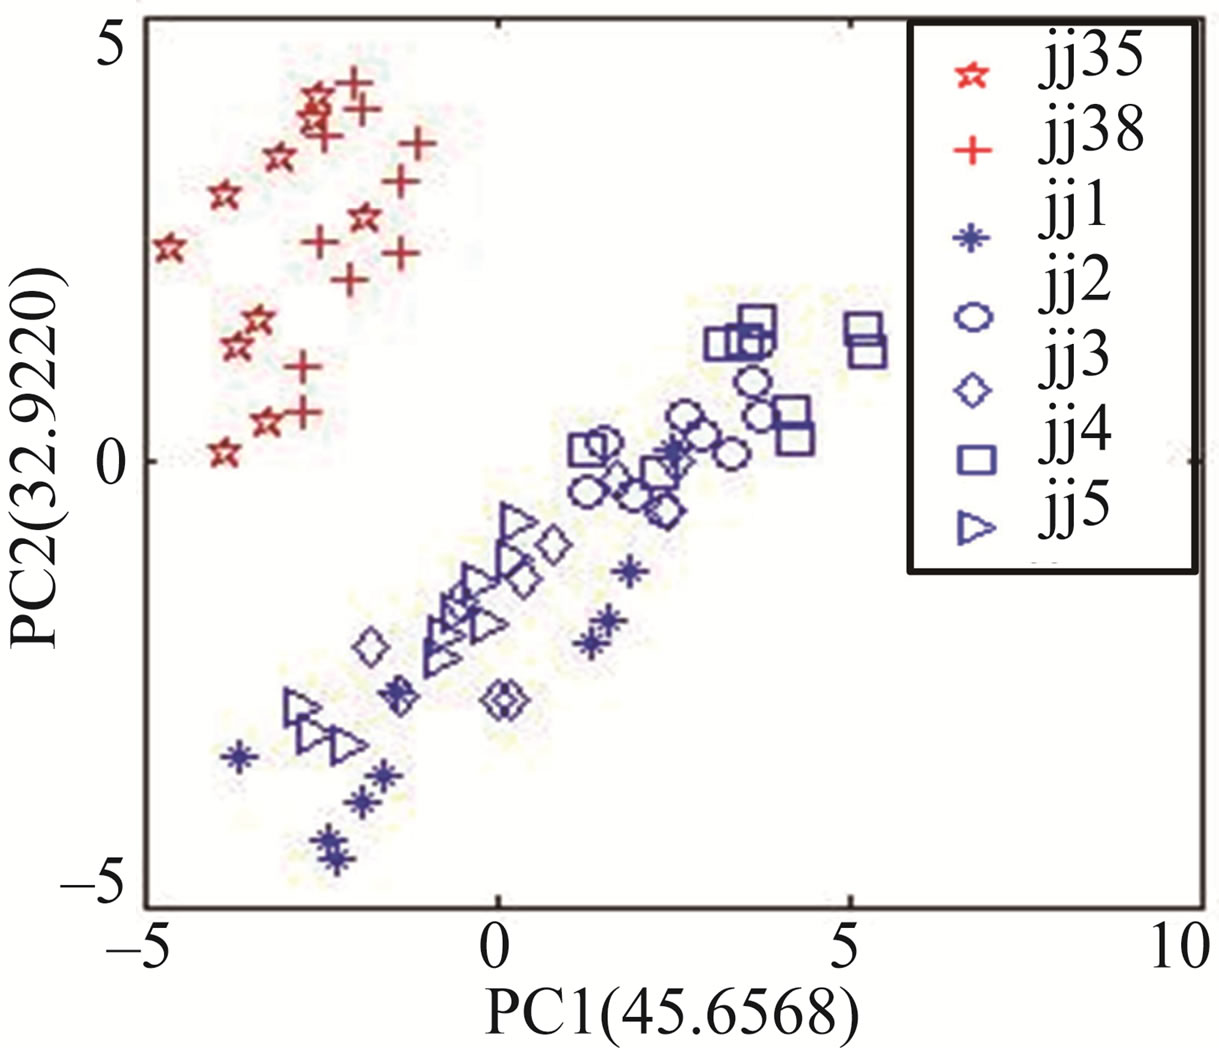 (c)
(c)
Figure 4. The PCA results between Jing wines and counterfeits corresponding 700, 800 and 900 s. (a) The discrimination corresponding 700 s; (b) The discrimination corresponding 800 s; (c) The discrimination corresponding 900 s.
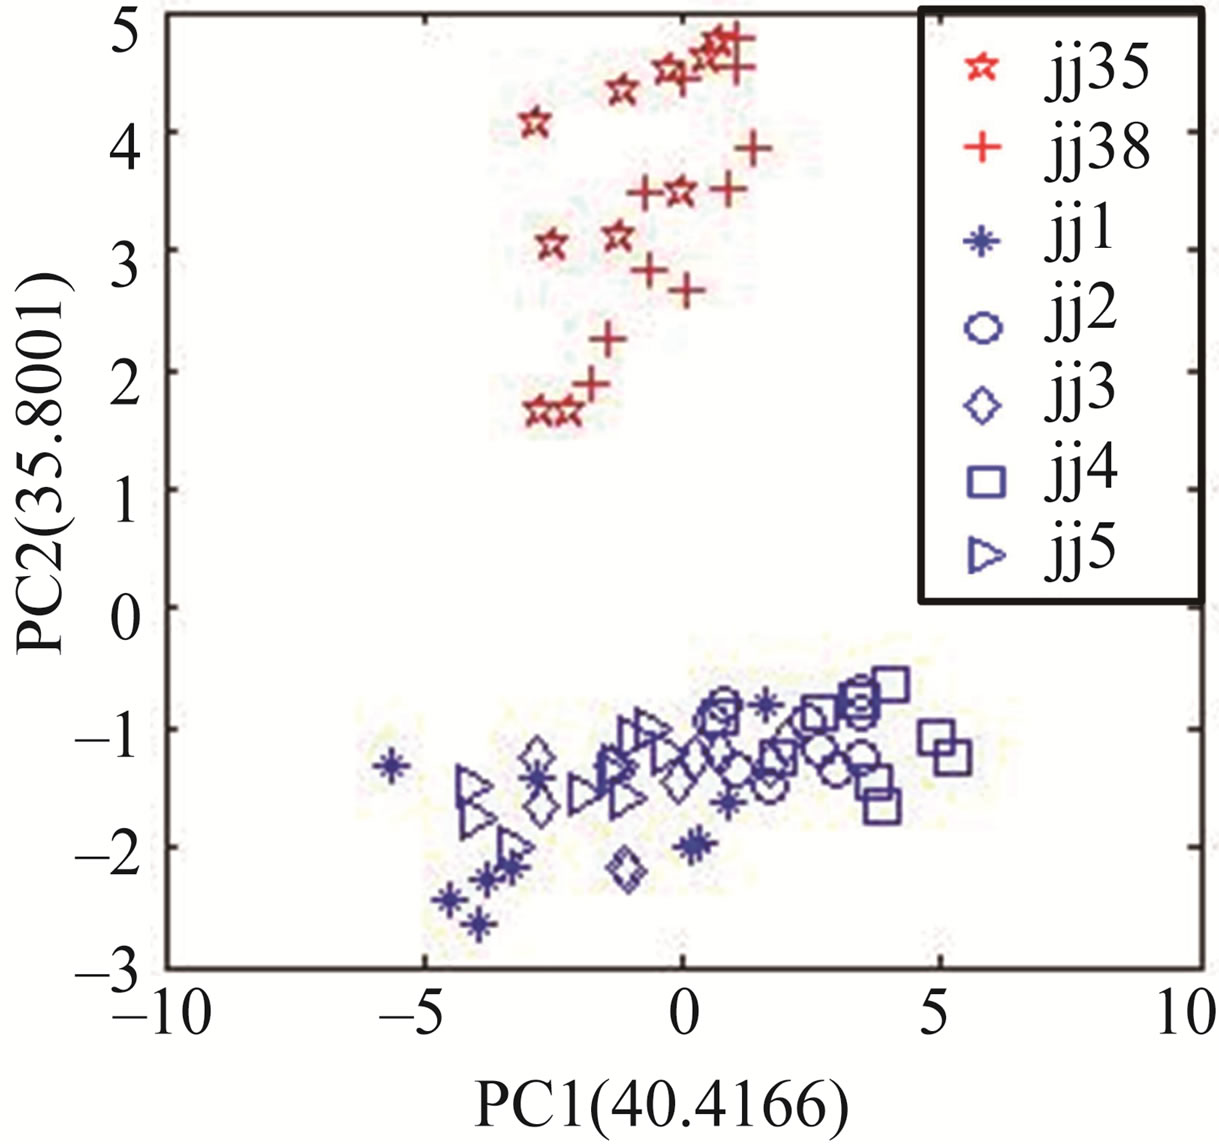
Figure 5. The PCA results between Jing wines and counterfeits corresponding 600 s.
The relative steady-state response can reflect the samples characteristics very well under a certain examination condition, and guarantee the analysis results to be stable and reliable comparing with other response values, the similarity of the discrimination results based on the response signals at 700 s, 800 s and 900 s is a better illustration. Therefore, we would rather choose these response values in range of 700 to 900 s as features for the discrimination tasks.
Because the response of each sensor in range of 700 to 900 s is relative stable, and the average response value in the range can more represent its overall characteristic, the average response value of each sensor in the range is more supposed to be as feature for the discrimination tasks. Figure 6 shows the result of PCA based on the average response values. From Figure 6, the discrimination is successful and similar to Figure 4 in intuition, this shows again the response values of each sensor in range of 700 to 900 s are relative stable. When the RSV and average response values are taken as features, higher reliability and simplicity are obtained for the discrimination tasks.
3.5. Evaluation of Discrimination Capability to Every Kind of Feature
Except MDCV the other features meet well the demand of discrimination between Jing wines and counterfeits, and after PC selected by L-statistic the MDCV feature was also used to carry out the discrimination tasks. Inspired by the criterion of separability between classes introduced by [18], an idea is proposed about how to evaluate the discrimination capabilities of these features. The reason the Jing wines can be discriminated from counterfeits is that they locate two different areas in the feature space. At the same time the distance between the areas is the larger the discrimination is the easier, so the distance may be selected as an evaluation parameter. In the feature space how to calculate the distance between the two areas is a key step. Because Mahalanobis dis-
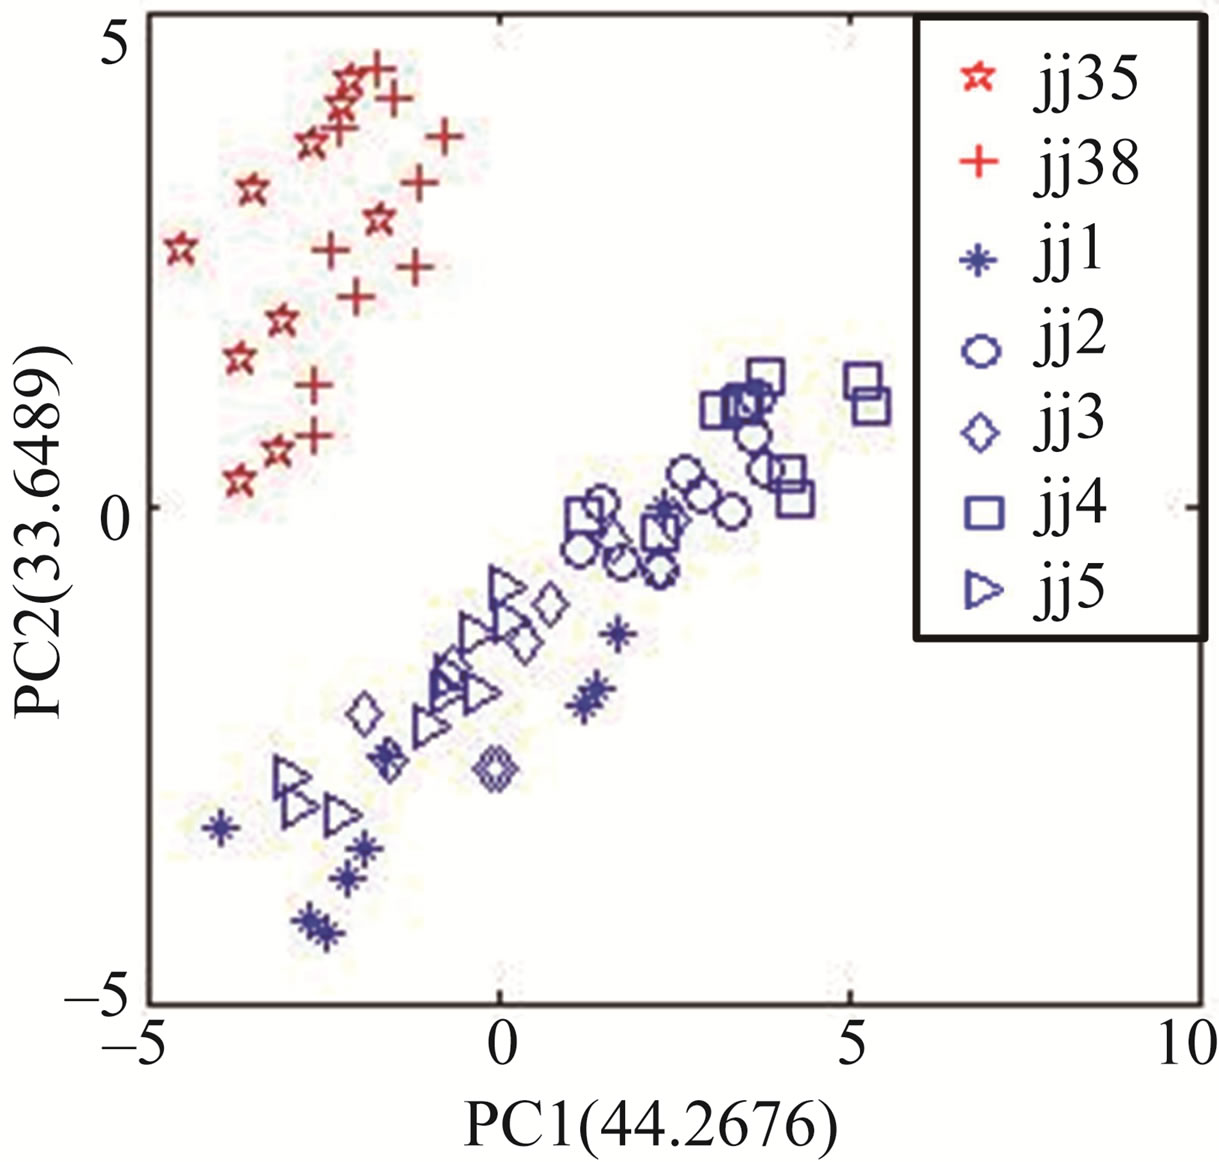
Figure 6. The PCA results between Jing wines and counterfeits based on average value.
tance is a popular method in aspect of distance analysis, and can eliminate the disturbance of correlation between variables and effect of dimensions, the distance was selected as an evaluation parameter. There were a lot of samples in an area of the feature space, and every distance between two samples which located the two areas respectively was not equal, so the mean of Mahalanobis distance was selected as a representing measure of the distance between the two areas. By the expression of Mahalanobis distance [18], we can give the concrete calculation for the mean distance, that is
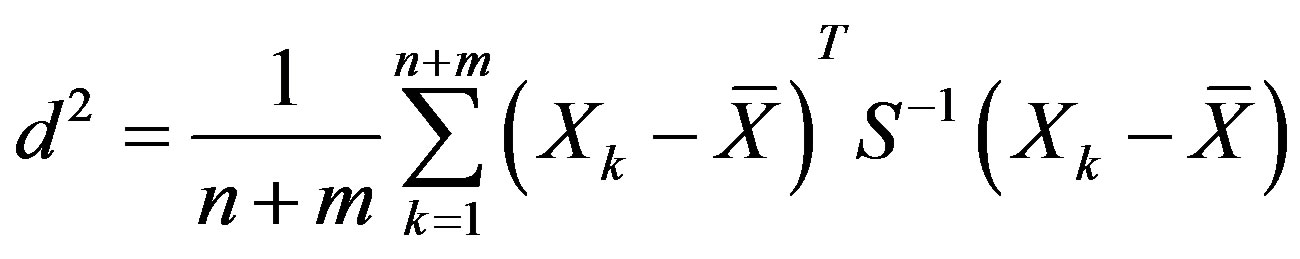 (4)
(4)
where d is mean distance between the two classes in feature space, Xk the k-th sample feature vector,  the feature mean vector corresponding total samples, n the sample number of the Jing wines, m the sample number of the counterfeits, n + m the number of total samples, S the feature covariance matrix corresponding total samples.
According to the expression (4), the means of Mahalanobis distances in different feature space were calculated and are shown in Table 1. From Table 1, there are some results as follows:
1) The discrimination capability of the feature MDCV, WE and RSV is lower, medium and better, respectively, this result is basically in accord with the result of PCA.
2) For the feature MDCV, due to the Mahalanobis distance of PC1 and PC2 being the least, the discrimination result is the poorest, Jing Wines and counterfeits cannot be discriminated, but the distance corresponding PC1 and PC3 is bigger than that of PC1 and PC2, so the discrimination result is better than that of the PC1 and PC2, this is in accord with the result of Figure 2.
3) About the feature WE, the corresponding distance is bigger than that of MDCV, thus the feature WE excels MDCV in discrimination effect, and this result may elicit by comparing Figure 3 with Figure 2.
4) The distances corresponding to all RSV are all bigger than that of other features, and there is a little and
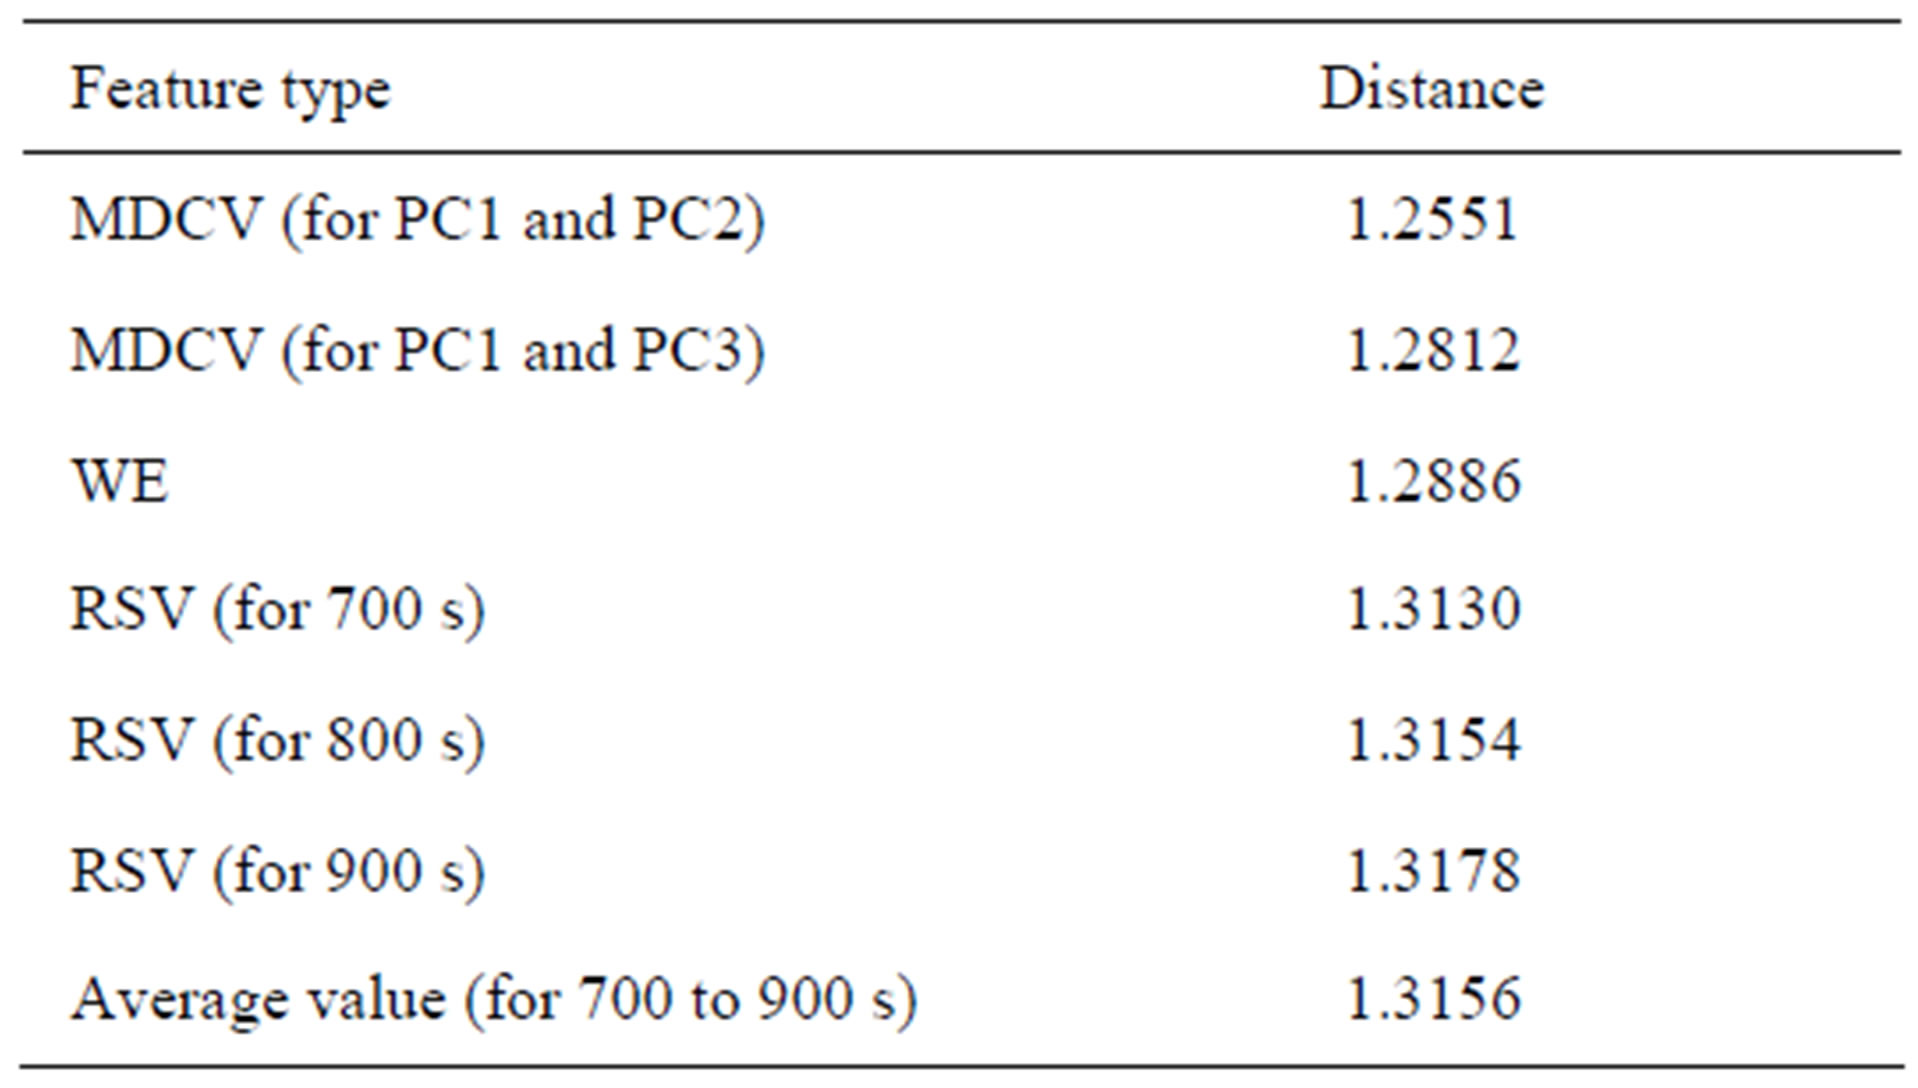
Table 1. The distances of different features.
uniform change in distances among these RSV, so the distance corresponding to average value is almost same as the distance corresponding to response value at 800 s. This is a second reason that RSV or average values were selected as features for the discrimination tasks.
The above results illuminate clearly that the bigger the mean distance the higher the discrimination capability of feature, and the mean distance is employed to evaluate discrimination capability of feature is effective.
4. Conclusions
The discrimination tasks between Chinese Jing wines and counterfeits were all accomplished well using the three kinds of feature extraction methods, the RSV is the best and the MDCV the poorest in respect of discrimination effect. For the MDCV, the discrimination can only be carried out with the help of Wilks L-statistic, and the PC1 and PC3 were selected for the discrimination tasks. For the WE, the discrimination can well carry out, but it is more complicated method and its discrimination capability is lower than that of RSV. For the RSV, the discrimination capability and the simplicity are best than those of others, and absolutely competent for the discrimination between Chinese Jing wines and counterfeits. In addition, the evaluation method of discrimination capability for these features based on Mahalanobis distance is proved to be appropriate, may be employed to evaluate the discrimination capability of different features.
Because these different features were all used to execute the discrimination tasks, this demonstrates that the eNose could be indeed used to discriminate Chinese Jing wines from counterfeits. A new attempt concerning the discrimination between Chinese Jing wine and counterfeits was given in this investigation.
5. Acknowledgements
This work is supported by the National Natural Science Foundation of China (NSFC) under Grant No. 31171685. At the same time, the authors would like to thank the Chinese Jing Brand Ltd. for the providing samples.
REFERENCES
- J. Lozano, J. P. Santos and M. C. Horrillo, “Enrichment Sampling Methods for Wine Discrimination with Gas Sensors,” Journal of Food Composition and Analysis, Vol. 21, No. 8, 2008, pp. 716-723.
- I. M. Apetrei, M. L. Rodríguez-Méndez, C. Apetrei, I. Nevares, M. Del Alamo and J. A. De Saja, “Monitoring of Evolution during Red Wine Aging in Oak Barrels and Alternative Method by Means of an Electronic Panel Test,” Food Research International, Vol. 45, No. 1, 2012, pp. 244-249. doi: 10.1016/j.foodres.2011.10.034
- I. Concina, M. Bornšek, S. Baccelliere, M. Falasconi, E. Gobbi and G. Sberveglieri, “Alicyclobacillus spp.: Detection in Soft Drinks by Electronic Nose,” Food Research International, Vol. 43, No. 8, 2010, pp. 2108-2114. doi: 10.1016/j.foodres.2010.07.012
- J. Lozano, J. P. Santos and M. C. Horrillo, “Classification of White Wine Aromas with an Electronic Nose,” Talanta, Vol. 67, No. 3, 2005, pp. 610-616.
- H. Qin, D. Huo, L. Zhang, L. Yang, S. Zhang, M. Yang, C. Shen and C. Hou, “Colorimetric Artificial Nose for Identification of Chinese Liquor with Different Geographic Origins,” Food Research International, Vol. 45, No. 1, 2012, pp. 45-51. doi: 10.1016/j.foodres.2011.09.008
- J. A. Ragazzo-Sanchez, P. Chalier, D. Chevalier, M. Calderon-Santoyo and C. Ghommidh, “Identification of Different Alcoholic Beverages by Electronic Nose Coupled to GC,” Sensors and Actuators B, Vol. 134, No. 1, 2008, pp. 43-48. doi: 10.1016/j.snb.2008.04.006
- J. P. Santos, M. J. Fernandez, J. L. Fontecha, J. Lozano, M. Aleixandre, M. García, J. Gutiérrez and M. C. Horrillo, “SAW Sensor Array for Wine Discrimination,” Sensors and Actuators B, Vol. 107, No. 1, 2005, pp. 291-295.
- L. Carmel, S. Levy, D. Lancet and D. Harel, “A Feature Extraction Method for Chemical Sensors in Electronic Nose,” Sensors and Actuators B, Vol. 93, No. 1-3, 2003, pp. 67-76. doi: 10.1016/S0925-4005(03)00247-8
- M. Padilla, I. Montoliu, A. Pardo, A. Perera and S. Marco, “Feature Extraction on Three Way Enose Signals,” Sensors and Actuators B, Vol. 116, No. 1-2, 2006, pp. 145- 150. doi: 10.1016/j.snb.2006.03.011
- R. Haddad, L. Carmel and D. Harel, “A Feature Extraction Algorithm for Multi-Peak Signals in Electronic Noses,” Sensors and Actuators B, Vol. 120, No. 2, 2007, pp. 467-472. doi:10.1016/j.snb.2006.02.048
- A. Leone, C. Distante, N. Ancona, K. C. Persaud, E. Stella and P. Siciliano, “A Powerful Method for Feature Extraction and Compression of Electronic Nose Responses,” Sensors and Actuators B, Vol. 105, No. 2, 2005, pp. 378-392. doi: 10.1016/j.snb.2004.06.026
- S. Panigrahi, S. Balasubramanian, H. Gu, C. Logue and M. Marchello, “Neural-Network-Integrated Electronic Nose System for Identification of Spoiled Beef,” LWT—Food Science and Technology, Vol. 39, No. 2, 2006, pp. 135- 145. doi: 10.1016/j.lwt.2005.01.002
- Y. Yin and X. Tian, “Classification of Chinese Drinks by a Gas Sensors Array and Combination of the PCA with Wilks Distribution,” Sensors and Actuators B, Vol. 124, No. 2, 2007, pp. 393-397.
- Y. Yin, H. Yu and H. Zhang, “A Feature Extraction Method Based on Wavelet Packet Analysis for Discrimination of Chinese Vinegars Using a Gas Sensors Array,” Sensors and Actuators B, Vol. 134, No. 2, 2008, pp. 1005-1009.
- L. Pillonel, J. O. Bosset and R. Tabacchi, “Rapid Preconcentration and Enrichment Techniques for the Analysis of Food Volatile. A Review,” LWT—Food Science and Technology, Vol. 35, No. 1, 2002, pp. 1-14.
- F. Doymaz, J. A. Romagnoli and A. Palazoglu, “A Strategy for Detection and Isolation of Sensor Failures and Process Upsets,” Chemometrics and Intelligent Laboratory Systtems, Vol. 55, No. 1-2, 2001, pp. 109-123. doi: 10.1016/S0169-7439(00)00126-X
- S. Capone, P. Siciliano, F. Quaranta, R. Rella, M. Epifani and L. Vasanelli, “Analysis of Vapours and Foods by Means of an Electronic Nose Based on a Sol-Gel Metal Oxide Sensors Array,” Sensors and Actuators B, Vol. 69, No. 3, 2000, pp. 230-235. doi: 10.1016/S0925-4005(00)00496-2
- Z. Bian and X. Zhang, “Pattern Recognition,” 2nd Edition, Publishing House of Tsinghua University, Beijing, 2000, pp. 178-179.
NOTES
*Corresponding author.