Advances in Chemical Engineering and Science
Vol.3 No.1(2013), Article ID:26469,20 pages DOI:10.4236/aces.2013.31003
Bifurcation Analysis of a Coupled Acetylcholinesterase/Choline Acetyltransferase Enzymes Neurocycle
1Department of Mathematics, College of Science, Salman Bin Abdualziz University, Al-Kharj, KSA
2Department of Basic Engineering Science, Faculty of Engineering, Menoufia University, Shebin El-Kom, Egypt
Email: *o_saleh15@yahoo.com
Received August 4, 2012; revised September 6, 2012; accepted September 15, 2012
Keywords: Neurocycle Modelling; Acetylcholinesterase/Choline Acetyltransferase; Bifurcation; Enzyme; Nonlinear Dynamics
ABSTRACT
A diffusion-reaction, two-compartment model was used to explore the bifurcation and chaotic behavior of acetylcholinesterase (AChE) and cholineacetyltransferase (ChAT) coupled enzymes system. The effects of hydrogen ion feed concentrations, choline (Ch) and acetylcholine (ACh) feed concentrations, as bifurcation parameters on the system performance are studied. It is found that hydrogen ions play an important role in creating potential differences through the plasma membranes. Detailed bifurcation analysis over a wide range of parameters is carried out in order to uncover some of the qualitative changes of the system such as hysteresis, multiplicity, Hopf bifurcation, boundary crises bifurcation, periodic transient, and other complex dynamics. Some of the obtained results relate to the phenomena occurring in the physiological experiments like periodic stimulation of neural cells and irregular functioning of acetylcholine receptors. The model depends on real kinetics expressions and parameters obtained from the literature, so the results can be used to direct more systematic research on cholinergic disorder.
1. Introduction
Acetylcholine (ACh) serves as the transmitter of nerve impulses at cholinergic synapses. In humans and homoeothermic animals, it affects transmission from motor nerves to skeletal muscles, from preganglionic parasympathetic and sympathetic fibers to neurons in the autonomic ganglia. ACh is also the transmitter at some synapses in the ventral neural system, as shown in Figure 1.
The released ACh diffuses in the synaptic gap and reacts with the cholinergic receptor protein, located in the post-synaptic membrane. The reaction with the receptor starts the chain of events resulting in the excitation or inhibition of postganglionic cell [1,2]. The substrates for the bio-synthesis of ACh are acetyl coenzyme A (acetylCoA) and choline. The synthesis is catalyzed by cholineacetyltransferase (ChAT).
Acetylcholine (ACh) plays a well recognized role in the nerve excitation [1,3-5]. It is found in cholinergic synapses that provide a stimulatory transmission in the nervous system. Its complete neurocycle constitutes a coupled two-enzyme system with the following two simultaneous events:
Activation Event: ACh is synthesized from choline and acetyl coenzyme A (Acetyl-CoA) biocatalyzed by the enzyme choline acetyltransferase (ChAT) and immediately stored in small vesicular compartments closely attached to the cytoplasmic side of the presynaptic membranes [2,3].
Degradation Event: Once ACh has completed its activation duty; the synaptic cleft degradation begins for removing the remaining ACh. This occurs when the ACh is consumed biocatalyzed by the acetylcholinesterase (AchE) to form choline and acetic acid [2,4,6,7].
In enzyme membrane systems, the pH decreases due to the local production of hydrogen ions. Because of the amphoteric properties of the proteinaceous membrane; the lower the pH the lower the density of the negative fixed charges in the membrane [8]. Artificial AChE membrane exhibits a potential difference electrical response similar to excitable membranes when ACh is injected on one side [9]. The steady state potential due to the enzyme activity for increasing and decreasing substrate concentrations exhibits a hysteresis behavior. Due to the auto-catalytic effect resulting from the production
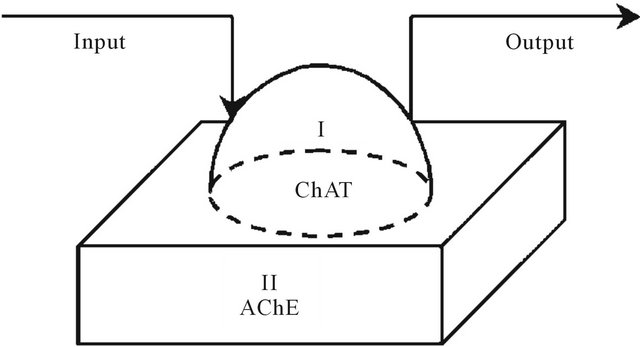
Figure 1. Two-enzymes/two-compartment model.
of hydrogen ions and the existence of diffusional resistances, hysteresis phenomenon develops in a definite range of parameters. The amphoteric properties of the membrane help to transfer the hysteresis of the internal pH into a hysteresis in membrane potential [9].
The two-enzymes/two-compartments model used in this investigation differs from other membrane excitation models such as of Rose-Hindmarsh model for action potential [10,11] which is a modification of Fitzhugh model [12]. This later model was developed to simulate the repetitive, patterned and irregular activity seen in molluscan neurons. Holden and Fan [13-15] and Fan and Holden [16] investigated the dynamic behavior of membrane excitation using a three-variable model of action potential which showed clearly the existence of different dynamic modes like simple periodic, bursting periodic and chaotic behavior.
Ibrahim and co-workers [17,18] investigated one half of the neurocycle in a two-compartment model using AChE as the only enzyme. The model unveiled bifurcation, instability, chaos and hyperchaos.
Moustafa et al. [19-21] investigated the complete neurocycle with special emphases on the choline recycling.
Parag et al. [22] investigated the bifurcation, stability and chaotic behavior of a two compartment model describing the complete neurocycle (AChE/ChAT) using general kinetic expressions. In this paper a more realistic kinetic expressions and parameters were implemented in order to further our insight into such important neurocycle.
2. The Simplified Diffusion-Reaction Two-Enzymes/Two-Compartment Model
A simplified model for the AChE/ChAT enzymes system inside the neural synaptic cleft is shown in Figure 1. The complete neurocycle of the acetylcholine, as a neurotransmitter, is simulated as a simplified two-enzymes/ two-compartment model. Each compartment is modeled as a constant flow, constant volume, isothermal, continuously stirred tank reactor (CSTR). The two compartments are separated by a nonselective, permeable membrane as shown in Figures 2 and 3.
Assuming that all the events are homogeneous in all vesicles, and by using the appropriate dimensionless state variables and parameters, we consider the behavior for a single synaptic vesicle as described by this simple two compartment model, where I and II denote compartments 1 and 2 respectively.
It is assumed that acetylcholine is synthesized in the presynaptic cell by the enzyme choline acetyltransferase due to an activation reaction. The stimulatory neurotransmitter acetylcholine is synthesized through the reaction R(1) as follows:

Acetylcholine is hydrolyzed (destroyed) in the postsynaptic cell by the acetylcholinesterase enzyme through a degradation reaction R(2) (where the stimulatory neurotransmitter acetylcholine is degraded) as follows:
• 
• Both reactions are considered substrate inhibited and hydrogen ion rate dependent. This leads to a nonmonotonic behavior of the reaction rates on both the substrate and pH.
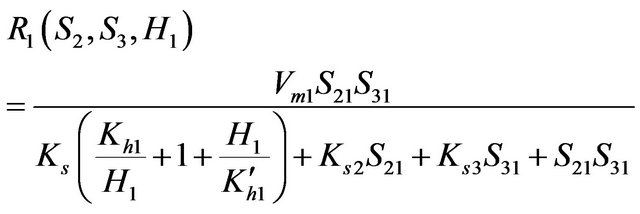
• From an enzyme kinetics point of view, the kinetic expression evaluated by Louis B. Hersh et al. (1977) [23] was used. This expression describes the cholineacetyltransferase reaction. It relates the speed of reaction by the two reactants (Choline and acetate). The saturation constant ks for this reaction is assumed to be dependent on H+ ions concentration The proposed rate expressions are as follows:
 (1)
(1)
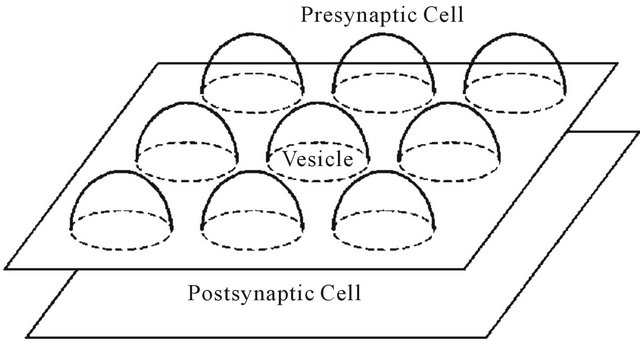
Figure 2. Schematic representation of synaptic cleft.
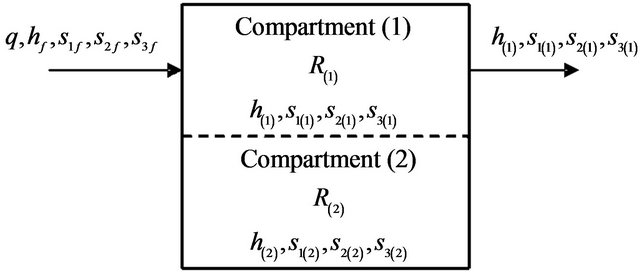
Figure 3. Two-enzymes/two-compartment model.
 (2)
(2)
The rate expressions R1 and R2 in a dimensionless form are
 (3)
(3)
 (4)
(4)
where

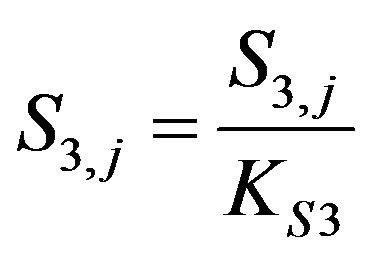
And S1j, S2j, S3j and Hj stand for acetylcholine, choline, acetate and hydrogen ions respectively.
The material balance equations for the two compartments are summarized in the dimensionless form as follows:
1) For Hydrogen Ions [H+]
a) For compartment (1)
 (5)
(5)
b) For compartment (2)
 (6)
(6)
where hj is the dimensionless hydrogen ions concentration, 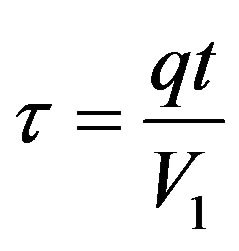 is the dimensionless time,
 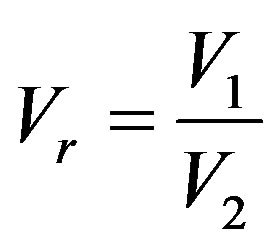 is the dimensionless volume relating the two compartments;
 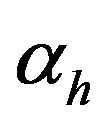 is the dimensionless membrane permeability for hydrogen ions,
 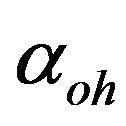 is the dimensionless membrane permeability for hydroxyl ions;
 .
.
2) For Acetylcholine ACh [S1]
a) For compartment (1)
 (7)
(7)
b) For compartment (2)
 (8)
(8)
where

3) For Choline [S2]
a) For compartment (1)
 (9)
(9)
b) For compartment (2)
 (10)
(10)
where

4) For Acetate [S3]
a) For compartment (1)
 (11)
(11)
b) For compartment (2)
 (12)
(12)
where

The relatively simple two-enzyme/two-compartment model is thus represented by the set of Equations (3) through (12) which represents the nonlinear system of equations having eight state variables
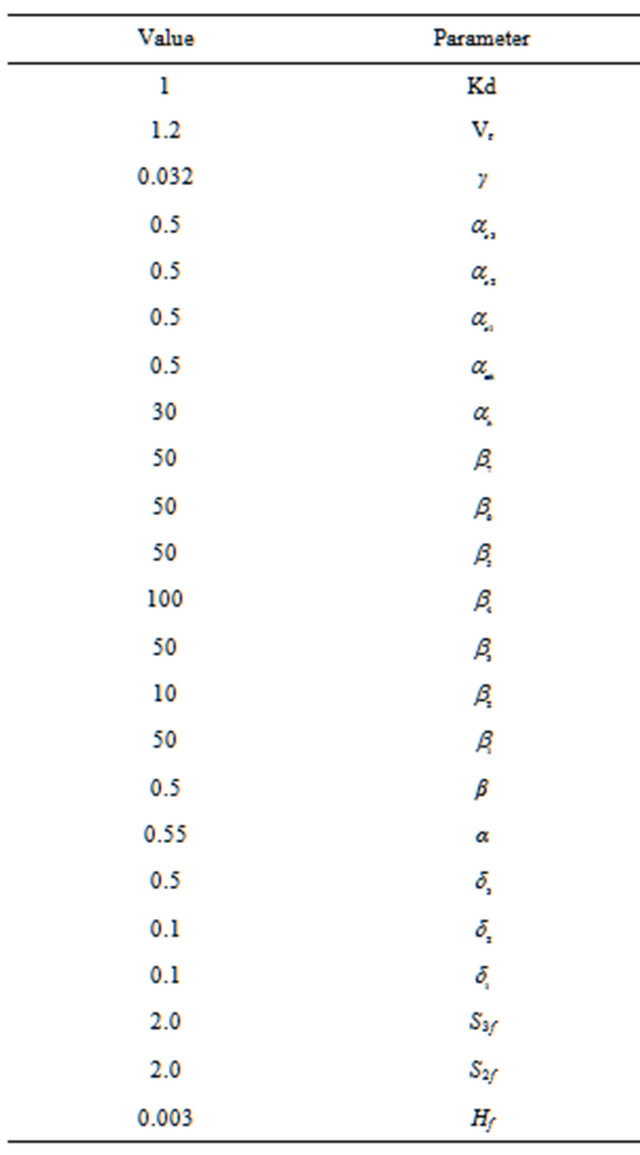
 . The system parameters values are given in Table 1.
Table 1. System parameters evaluation.
3. Numerical Tools, Presentation Techniques and Computational Resources
The static and dynamic bifurcation analysis was performed. The feed concentrations of acetylcholine and hydrogen ions S1f and pHf was taken as the bifurcation parameter. The bifurcation diagrams are obtained using the software package AUTO 97 of Doedel et al. [24]. This package is able to perform both steady state and dynamic bifurcation analysis, including the determination of entire periodic branches. In some cases where multiplicity of steady-state was found in a very narrow range of the bifurcation parameter or where catastrophic changes in periodic branches occurred, the AUTO 97 package failed to capture the complete periodic branches. In these cases, simulation techniques were used to complete the whole picture of the bifurcation diagrams.
Poincare’ presentation techniques were also used. The discrete points (return points) were obtained by intersecting the trajectories and a hyper surface (Poincare’ surface). These discrete points of intersection were taken so that the trajectories intersected the hyper surface transversally and crossed it in the same direction.
The DGEAR subroutine available in the IMSL Libraries for FORTRAN with automatic step size was used to ensure accuracy for stiff differential equations for numerical simulation of periodic and chaotic attractors. The program employed by Elnashaie et al. [25] was also used to plot the Poincare’ diagram. The routine enjoys high accuracy. In many cases, a bound on the allowable error as small as 10−15 was necessary to obtain accurate results.
4. Results and Discussion
Hydrogen (H+) ion is a very simple element because it contains only one proton and its size is very small. H+ ions play an extremely vital role in all metabolic processes, and transport of ions such as Na+, K+, and Ca2+ occurring in the living organisms. For example, the function of protein components can be altered from hydrophobicity to hydrophilicity because of its ability to release or bind H+ ions [26]. It is observed that most pathological environments and ions diffusion are accompanied by observed pH changes [27,28].
During exocytosis the synaptic vesicle fuses with the surface membrane and undergoes a pH jump. When the synaptic vesicles is inside the presynaptic nerve terminal its internal pH ranges from 5.2 to 5.5 [29,30], and after fusion, the inside of the vesicle comes in contact with the extracellular median with a pH of about 7.25 this jump on pH affects the opening of non-specific ion channels [31].
Stanley M. Parsons [32] states that the value of transmembrane pH and electrical gradient (ΔpH and Δψ respectively) are about 1.4 pH units and 39 m volt respectively for filled cholinergic and monoaminorgic secretory vesicles.
The plasma membrane extrudes hydrogen ions from the cell to generate a proton (H ion) motive force with a membrane potential of −120 to −160 m volt (negative inside). This process takes place via H+-ATPase mechanism of transport [33].
In enzyme membrane systems, the pH decreases due to the local production of hydrogen ions or to the active transport of protons. And because of the amphoteric properties of the plasma membrane the lower the pH value the lower the value of the negative fixed charges located at the membrane surface [34]. Artificial AChE membrane exhibits potential differences similar to excitable membrane when ACh is injected on one side [9]. The last article shows that the steady state potential due to the enzyme activity exhibits a hysteresis and oscillatory behavior. Due to the auto-catalytic effects resulting from the production of hydrogen ions and the existence of diffusional resistances, hysteresis phenomenon develops in finite range of parameters. The amphoteric properties of the membrane help to transfer the hysteresis of the internal pH into a hysteresis in membrane potential [9].
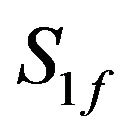
The bifurcation analysis is concerned with the way that steady state solutions of the system model vary with one of the system parameters. The feed concentration of acetylcholine (S1f) and pHf feed were chosen as the main bifurcation parameters through this investigation. Static and some dynamic characteristics of this biosystem are investigated using the software AUTO 97 [24] and dynamic simulation techniques. For each case, all the parameters (other than the bifurcation parameter S1f, pHf feed) were kept constant at the values in Table 1. The default values of Table 1 are used, unless the contrary is mentioned. At each region of bifurcation analysis, a sample of the possible correspondence with real physiological values is given. Although some of the parameters were obtained from direct experimental results, but chosen in a heuristic way from plausible alternatives, it is interesting to notice that the state variables are similar to the physiological expected values.
An extensive literature review leads us to the values for different parameters in the model.
• pH in the range of 6.95 - 7.15 was measured in human brain [35].
• pH in the range of 6.95 - 7.35 was reported in a feline model [36].
• ACh in a rat brain was found to be in the range of 0.22 × 10⁻⁵ kmol/m3. (Free ACh) to 1.77 × 10⁻⁵ (total ACh) [2]. While, in guinea pig cerebral cortex the range was 0.31 × 10⁻⁵ (free ACh) to 1.67 × 10⁻⁵ kmol/m3 (total ACh) [2].
• ACh concentration in human placenta is reported to be in the range of 3.0 × 10⁻⁵ - 55.5 × 10⁻⁵ kmol/m3 [37].
• ACh in the isolated rings of rat pulmonary artery was measured to be in the range of 0.001 × 10⁻⁵ - 3.0 × 10⁻⁵ kmol/m3 [38].
• Choline concentration in mouse rat brain is about 1.15 × 10⁻⁴ kmol/m3 [2].
• Choline concentration in human plasma is in the range of 0.01×10⁻⁴ - 0.7 × 10⁻⁴ kmol/m3 [39].
In the following, the investigation will be emphasized on the autonomous periodic and aperiodic behavior of the biosystem under consideration, in addition to the behavior when considering the quantal nature of the neurotransmitter releases.
4.1. System Behavior in Response to Constant Fixed Input
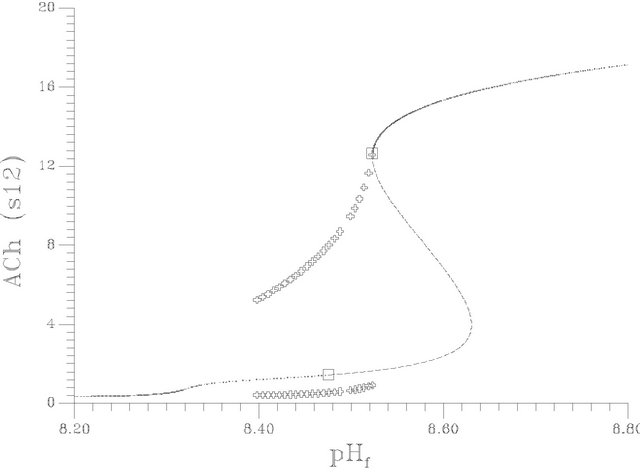
Figures 4(a)-(c) show the bifurcation diagram at the set of system parameters listed in Table 1, the bifurcation diagram is shown for a wide range of the bifurcation parameter (8.2 > pHf > 8.8).
With respect to Figures 4(a) and (b), the S shape behavior exhibits a transfer of the system behavior from high conversion of ACh hydrolysis (in terms of ACh concentration in compartment 2 and membrane potential) to low conversion states with pH increase. The bifurcation diagram characterized by the existence of two Hopf bifurcation points (at pHf = 8.4754 and 8.5232) and two static limit points. The bifurcation behavior is characterized by the following features:
• At : Unique steady state solutions on the high conversion steady state branch exist.
• At : Bistability between steady state and periodic or aperiodic solutions exist.
• At : Unique periodic or aperiodic solutions exist.
• At : Unique steady state solutions on the low conversion steady state branch exist.
The first Hopf bifurcation point (at pHf = 8.4754) is a subcritical one where a set of unstable periodic solutions emerging in its neighborhood and this organization of the state space make it possible to exhibit a bistability.
Figure 4(c) shows the bifurcation diagram in terms of pH changes in the two compartments, the results show that the pH differences between the two compartments changed dramatically corresponding to the variation of the resultant hydrolysis process of ACh that is represented by Figure 4(b). The pH difference changes from a value close to 0.8 at pHf = 8.2 to a value close to 1.2 at the first Hopf bifurcation points (pHf = 8.4754). The pH difference deceases dramatically at the solution sets of low conversion domain (close to 0.1 in pH units). These results are close to the experimental results reported by Stanley M. Parsons [32].
The membrane potential was estimated (assuming hydrogen ions were the only charged ions in the system) using the following formula [40]:
 Thus the positive value (see Figure 4(a)) of the membrane potential means that the negative charges are localized on the membrane surface of compartment I. It is noticed that the membrane potential exhibit the same behavior as pH difference [the membrane potential increases with the increase of pH difference and vice versa]. The region of high conversion shows high membrane potentials [changes from a value close to 42 m volts up to a value of 76 m volt as a maximum value in the periodic region]. The average values of membrane potential at the periodic region are represented by the star symbols in Figure 4(a), these values are estimated as follows:
 (a)
(a)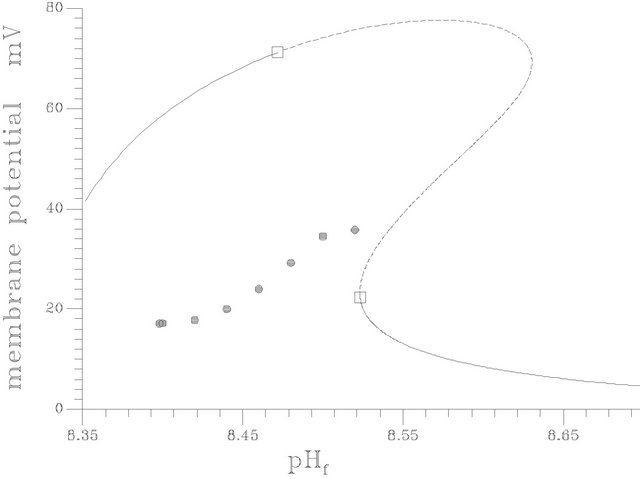 (b)
(b)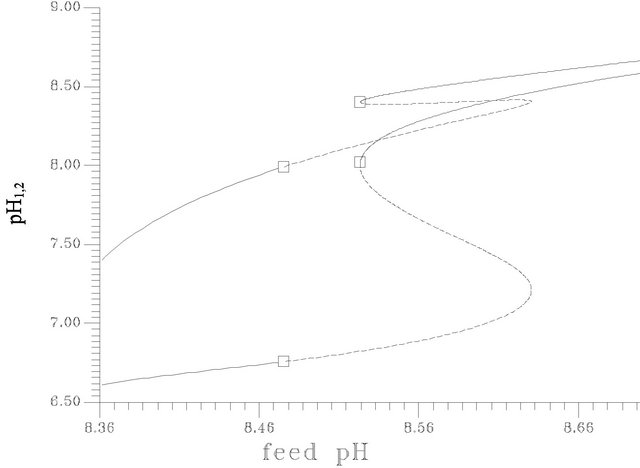 (c)
(c)
Figure 4. (a) Bifurcation diagram [pHf vs membrane potential], produced at s1f = 20 and the rest of system parameters as listed in Table 1], [solid circles represents the average value of the stable periodic branch, … unstable stationary branch, ____ stable stationary branch]; (b) Bifurcation diagram [pHf vs ACh concentration in compartment 2; s12], produced at s1f = 20 and the rest of system parameters as listed in Table 1. [The symbols indicates the stable periodic branches, solid line indicates the stable stationary branch, dashed line indicates the unstable branch]; (c) The lower curve [w.r.t pH1,2] represents compartment 2 and the other curve for compartment 1.
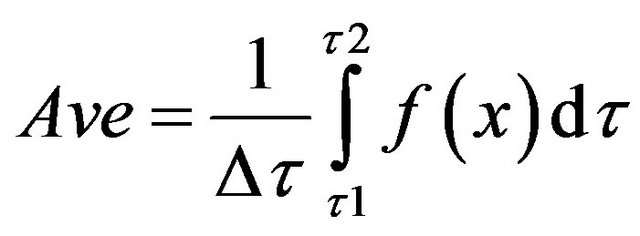 where, x represents the state variable of the system.
It is noticed that the average membrane potentials at the periodic and bistable (where two kind of attractors exist: the stationary and the periodic one) regions are less than that of the high conversion region. At the low conversion region the membrane potential decreases dramatically to values less than 20 m volts (near the second Hopf bifurcation point).
However a value of membrane potentials which occurs due to hydrogen ions concentration difference of the same range has been recorded by Heven Sze et al. [33].
Generally, ions in body fluids can be classified into two categories: the first one is buffer ions such as bicarbonates, and the second one is non buffer ions which are either strong ions or electrolytes [41]. These strong ions have no effect on buffering capacity as they are completely ionized at normal pH [41]. In this work, the effect of bicarbonate on pH is ignored. This assumption is supported and validated by Constable et al. [41]. Furthermore bicarbonate ions do not contribute to cholinergic ACh reactions that lead to the net synthesis or degradation of ACh [41,42]. In addition, bicarbonate can be effective through alterations in respiratory activity not in ACh cholinergic neurons [41,42]. Our model considers that ionic charges contributed by [CO3]2− and [HCO3]− are quantitatively unimportant.
It is noticed that the variation in pH and consequentially the membrane potential are a little bigger than those recorded in actual physiological situations, this is due to the fact that the model ignores any effects of other ions (generation and transport) but hydrogen ions, and the assumption of fully ionization of the acetic acid. These effects may play a basic role in controlling and regulating of charges on both membrane sides. On the other side, the use of an artificial membrane like the proposed one for this model or like the membrane which was used by Friboulet et al. [9] and eliminating any charged molecules but hydrogen ions may give closer results to that illustrated by Figure 4(a). Friboulet et al. [9] used an artificial membrane which was injected by acetylcholine from one side and the hydrolysis reaction takes place in the other side found a hysteresis and oscillations in pH values and a pH variation close to the model results.
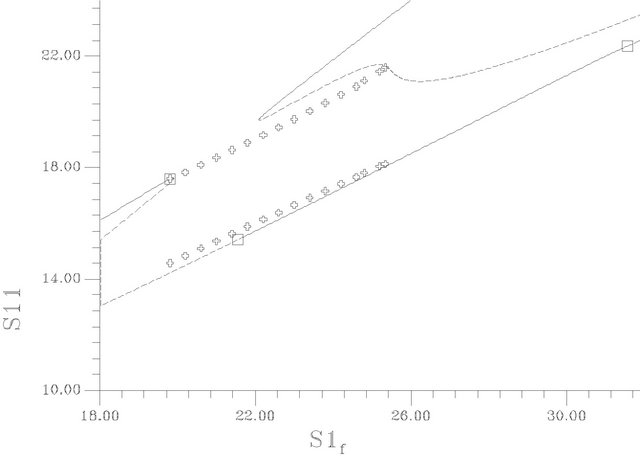
Figures 5(a)-(c) show the bifurcation diagrams where the ACh feed concentration is the bifurcation parameter. This diagrams are constructed using the same set of parameters as Figure 4 and pHf = 8.5287874. The bifurcation diagrams are characterized by the existence of four Hopf bifurcation points and four static limit points: the first HB1 (from the left) occurs at S1f = 19.80467, the second HB2 at S1f = 21.55055, the third one occurs at s1f = 31.5689 and the fourth HB4 at S1f = 31.86253.
The AUTO 97 package failed to capture the periodic branch that emerging from these Hopf bifurcation points, so simulation techniques are used to estimate these branches (see Figure 5(b), an elongation of Figure 5(a)). The Hopf bifurcation points are of the subcritical type where a set of unstable periodic solutions emerging in its neighborhood and this organization of the state space make it is possible to exhibit bistability.
The steady-state branches have two regions of multiplicity of steady-states separated by a high conversion steady-state branch. The first region of multiplicity, from the left-hand side of Figure 5(a), lies between the two
 (a)
(a)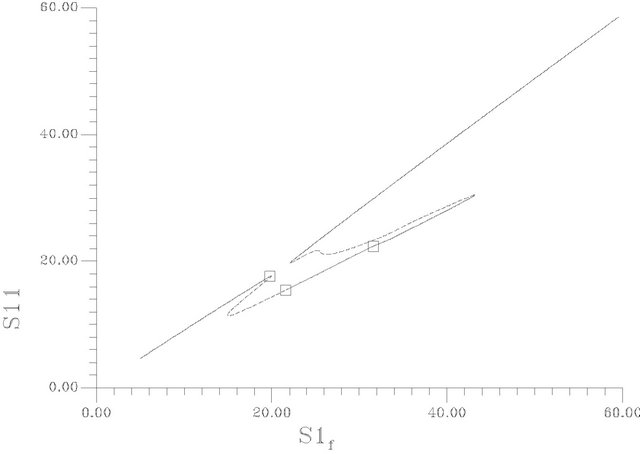 (b)
(b) (c)
(c)
Figure 5. (a) Bifurcation diagram [S1f vs S11]-[This diagrams are constructed using the same set of parameters as Figure 4 and pHf = 8.5287874]; (b) An enlargement of (a); (c) Bifurcation diagram [S1f vs membrane potential].
static limit points SLP1 [s1f = 19.90996] and SLP2 [s1f = 14.96821], the second region of multiplicity lies between the third SLP3 [s1f = 43.18598] and SLP4 [s1f = 22.08557]. On the right of the Hopf bifurcation point HB1 at this point, the steady-state branch loses its stability to unstable steady-state of saddle-focus type, where six of the eigenvalues are of negative sign (the other two are complex conjugates of positive real values). The negative sign of the eigenvalues of these saddle-focus type steady-states correspond to a six-dimensional stable manifold Ws that enter the saddle point called the separatrix, while the positive eigenvalues corresponds to the two-dimensional unstable manifold Wu. The same type of saddle-focus unstable steady-states are born directly before gaining stability at HB2 (s1f = 21.55055). There is a range between the two Hopf bifurcation points HB1, HB2 where S1f  (19.80467, 21.55055) have three unstable static branches, this range occurs at s1f
  (19.80467, 19.90996). Two of these unstable steady states are of saddle-focus type and the third of saddle node type, where six out of the eight eigenvalues are real and negative and the rest are of real positive value.
The reinjection of Ws into Wu gives rise to homoclinic connections. The reinjection of unstable manifold Wu of one of the three unstable steady-states to another gives rise to heteroclinic connections also. On the other side, the transversal intersections between immersed manifolds (stable or unstable manifolds cannot intersect in the state space but immersed manifolds can) should create homoclinic points. Absence of blackholes in this region makes such connections easily formed in state space. The points on the two saddle-focus branches were found to satisfy the Sil’nikov’s conditions [43]. These conditions with the expected homoclinic orbits existing in the state space generate a complex situation. Therefore two major expectations should be considered in this region between HB1 and HB2 within the range of multiple unstable steady states:
• The existence of three static points of the saddle type with their possible manifolds connections may create more than one basin of attraction and bistability of cyclic attractors should be expected.
• In the neighborhood of the homoclinical points chaos should be expected based on Sil’nikov’s theorem and the generalization of Rossler et al. [44] as discussed in Ibrahim and Elnashaie [18]. The cyclic behavior in this region should be influenced by the spiralling-out effect of the saddle-focus which will play a recognized role in organizing the system dynamics.
However, the results show the following bifurcation characteristics as Figures 5(a)-(c) indicate:
• At  unique stationary steady states characterize this region.
• At  bistability between stationary steady states and cyclic attractors exists.
• At  unique cyclic attractors dominate this region.
• At  bistability between cyclic and stationary steady states attractors exists.
• At  three stable solutions exist in the state space. One of them is cyclic attractor.
• At  two stable stationary states exist.
• At  bistability between cyclic and stationary steady states attractors exists.
• At  two stable stationary states exist.
• At s1f > 43.18598 a unique stationary state exists.
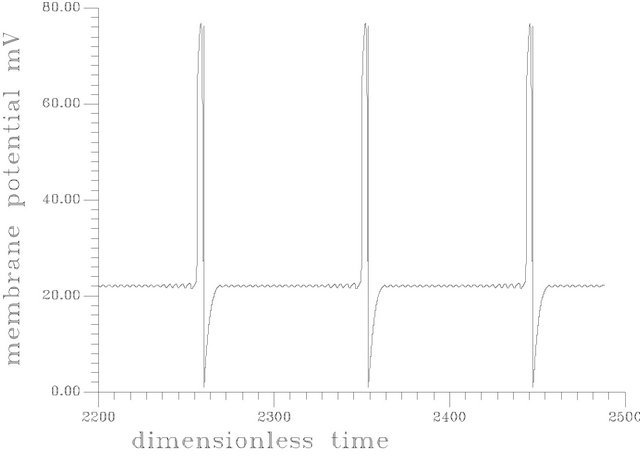
Figure 6 shows a periodic burst in a time trace representation at s1f = 20. [the region of unique cyclic attractors], each cycle of this burst involved one smooth big cycle and one spike, this kind of complex oscillations is of course a casual event in the dangerous boundaries discussed before.
The branch of periodic bursts continues with increasing s1f [s1f > 20] without remarkable changes in its shape until it dies out homoclinically at the second multiplicity region as illustrated by Figure 5(b). The range where  shows a burst bifurcation to chaos, a one-dimensional Poincare’ map is constructed for this range, see Figure 7, where the Poincare’ hyperplane is carefully chosen. According to Javier et al. [45], the Poincare’ plane must be transverse to the bi-dimensional stable manifold of the corresponding saddle-focus. Therefore the Poincare’ plane used crosses through the central hole of the attractors. On this basis, the Poincare’ plane in this case is taken at a value of s12 = 12.4974075. Because of the expected bi-stability phenomenon and to avoid the attraction of any other attracting sets that may exist in the same state space, the initial conditions necessary to obtain the trajectories intersections with the Poincare’ plane are changed automatically every step of the s1f state space to insure that the trajectories are retained in the same domain of attraction in the state space. It is clear from the Poincare’ map of Figure 7 that the burst oscillations go through an inverse period adding sequence with the increase of s1f until it bifurcates to chaos which terminates suddenly as the causality of crises bifurcations. Figure 6(b) shows a time trace representation to a complex periodic attractor selected near the point of chaos appearance at s1f = 19.80462. Comparing to Figure 6(a), the selected attractor have a period close to ten times of the period characterizing the attractor of Figure 6(a). This means that the selected attractors are very close to dangerous boundaries creating crises conditions (i.e. homoclinicity conditions and/or heteroclinicty conditions).
Figures 8(a)-(c) show time trace representation of
 (a)
(a)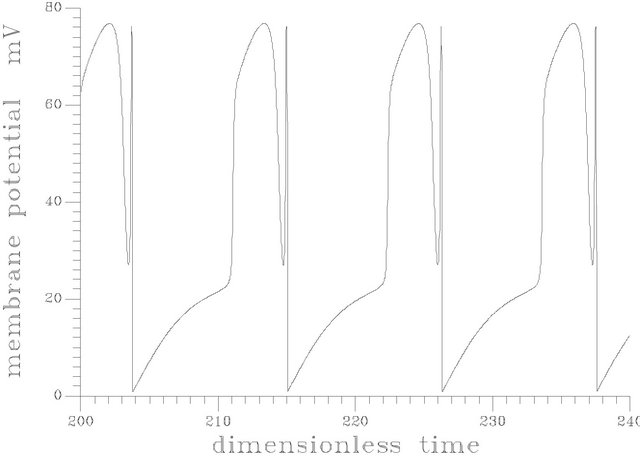 (b)
(b)
Figure 6. (a) Periodic bursts of one spike at s1f = 20 and the rest of the system parameters as Figure 5; (b) Complex periodic attractor at s1f = 19.84062.
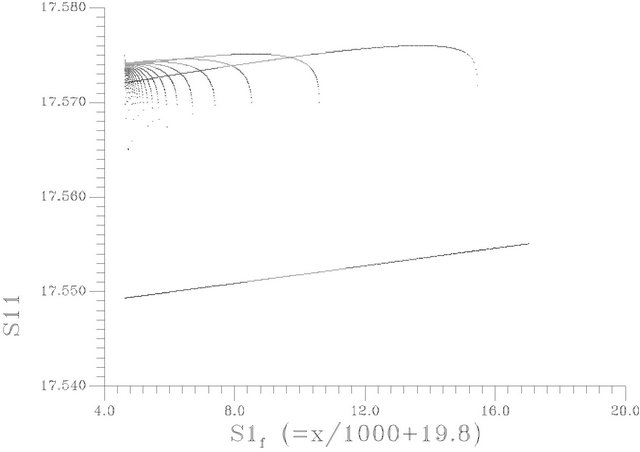
Figure 7. One dimension pioncare map: the hyper plan surface taken at S12 = 12.4974075.
three sets of attractors:
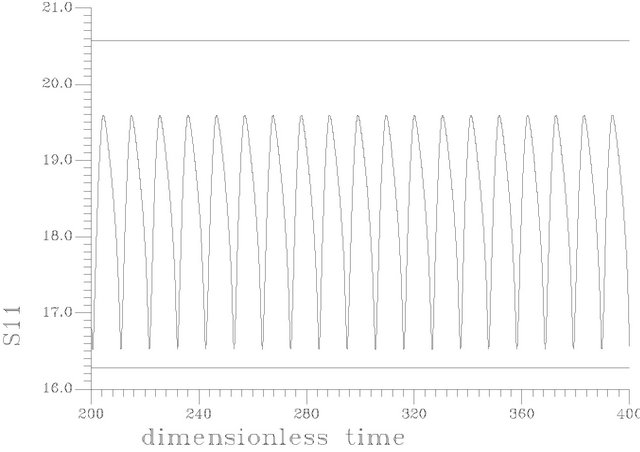
• Figure 8(a) shows the bistability evolved at s1f = 21.8 where a periodic attractor coexist with a stationary state attractor at the same state space. The biosystem alternate between the two attractors according to initial conditions.
• Figure 8(b) shows the time trace at s1f = 22.8, where three stable attractors coexist at the same state space dividing it into three domains of attraction: one for the bursts type of attractors and the other two attractors are of stationary type.
• Figure 8(c) shows the time trace at s1f = 31.7, where two attractors coexist at the same state space: one of smooth and low amplitude oscillations type and the other is of stationary state type.
It is known from bifurcation theory [46,47] that interactions between a SLP and HB point may lead to a variety of behavior ranging from simple periodicity to complex periodic behavior. In the beginning of this analysis it is helpful to build an overall picture of the possible bifurcation mechanisms that the system may exhibit. This task is best achieved by showing both the loci of the static limit points and the Hopf points in a two-parameter continuation diagram.
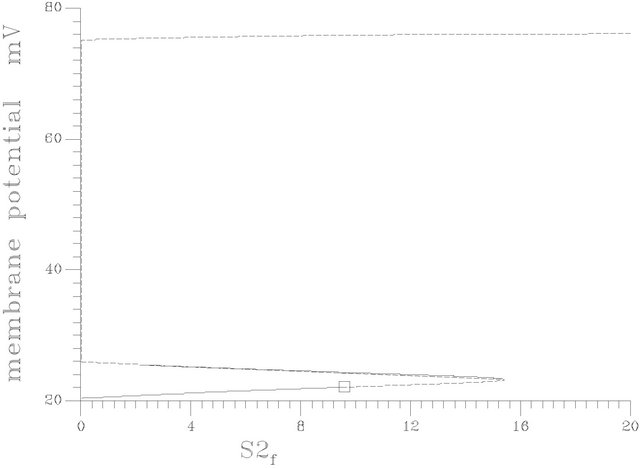
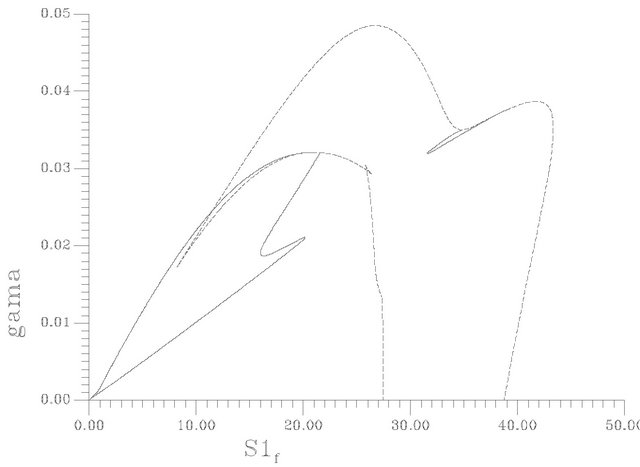
Figures 9(a)-(c) show the SLP curve (dashed line) and the HB curve (solid line) for instance in the parameter space (s1f, pHf), (s1f, gama) and (s1f, s2f) respectively. It can be seen from Figure 9(a), that the loci of the HB points consist of two curves that form two minima at pHf = 7.8591 and 8.5217. An oscillatory behavior should be expected then in the model for any value of the pHf larger than these values up to a value of pHf = 8.524 for the first minimum and a value of 8.5936 for the second minimum. It can be also seen from the shape of the HB curves that no oscillatory behavior occurs below pHf = 7.8591. Similarly to the HB curve the loci of the static limit points (SLP curve) shown by dashed lines consist of two maxima, two minima and a small cusp, the two
 (a)
(a)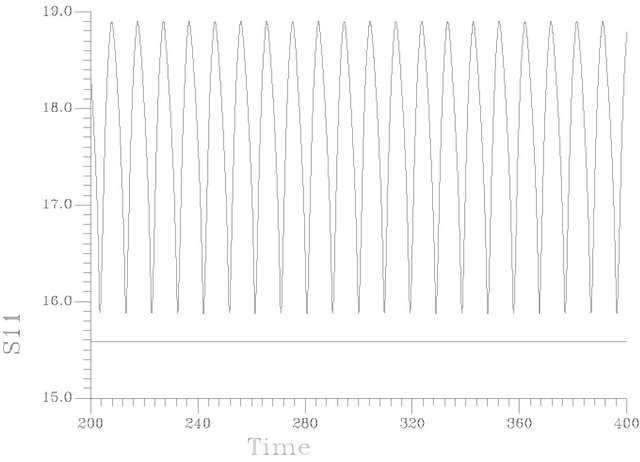 (b)
(b)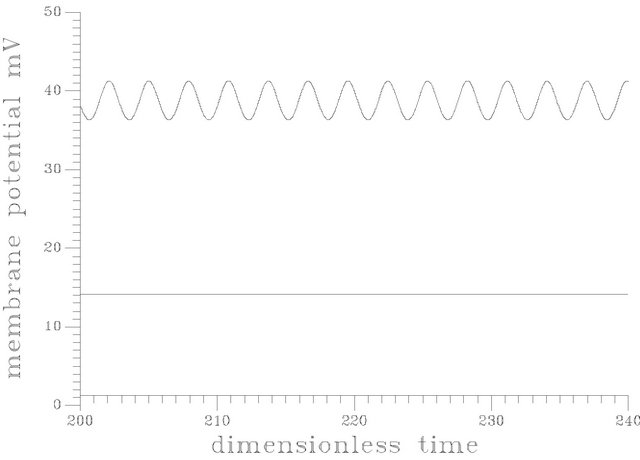 (c)
(c)
Figure 8. (a) Shows the time trace at s1f = 21.8 [initial conditions for periodic attractor: y1 = 0.008, y2 = 0.005, y3 = 2, y4 = 1.5, y5 = 0.4, y6 = 2, y7 = 2, y8 = 1] [initial conditions for stationary solution: y1 = 0.0087, y2 = 0.184, y3 = 15.6, y4 = 1.58, y5 = 1.15, y6 = 15.17, y7 = 1.15, y8 = 15.2]; (b) Shows the time trace at s1f = 22.8 [initial conditions for periodic attractor: y1 = 0.008, y2 = 0.005, y3 = 2, y4 = 1.5, y5 = 0.4, y6 = 2, y7 = 2. y8 = 1] [initial conditions for low conversion stationary solution: y1 = 0.0087, y2 = 0.184, y3 = 15.6, y4 = 1.58, y5 = 1.15, y6 = 15.17, y7 = 1.15, y8 = 15.2], [initial conditions for high conversion stationary solution: y1 = 0.00394, y2 = 0.00947, y3 = 20.58, y4 = 15.5, y5 = 1.44, y6 = 6.522, y7 = 15.5, y8 = 6.5]; (c) Shows the bistability evolved at s1f = 31.7 initial conditions of periodic solution: y1 = 0.0938, y2 = 0.4365, y3 = 22.387, y4 = 1.554, y7 = 2, y8 = 1, y5 = 0.412, y6 = 21.244, initial conditions for stationary solution: y1 = 0.008, y2 = 0.005, y3 = 2, y4 = 1.5, y5 = 0.4, y6 = 2, y7 = 2, y8 = 1.
minima occur at pHf = 8.4287 and 8.5217, the two maxima occur at pHf = 8.6052 and 8.6973. Static limit points are then expected in the model for any values of feed pH lower than 8.6973 and the rest of the system parameters are kept constant as in Table 1.
It should be noted that points of maximum and minimum of SLP and HB curves are special points since they are considered as degenerate points. Interesting dynamic behavior can be found at the vicinity of these degenerate points in addition to qualitative changes in bifurcation behavior are excepted when passing these points.
The diagram of Figure 9(a) also shows that the HB curve crosses the SLP curve, respectively, at some point. These points are also degenerate points since they create the so-called type Fl degeneracy [46,47]. The two curves can also be seen to collapse in one line along the right branch of the diagram. This gives birth to another kind of degeneracy, i.e., the so-called Fz degeneracy [46,47].
From practical point of view, one can expect close to these degenerate points some interesting dynamic behavior ranging from periodic solutions, quasiperiodic solutions to other global bifurcation phenomena. The two-parameter continuation diagrams of Figures 9(a)-(c) were, therefore, helpful in providing a “big picture” of the potential bifurcation mechanisms in the system. In this regard, the continuity diagram of Figure 4(a) ob-
 (a)
(a)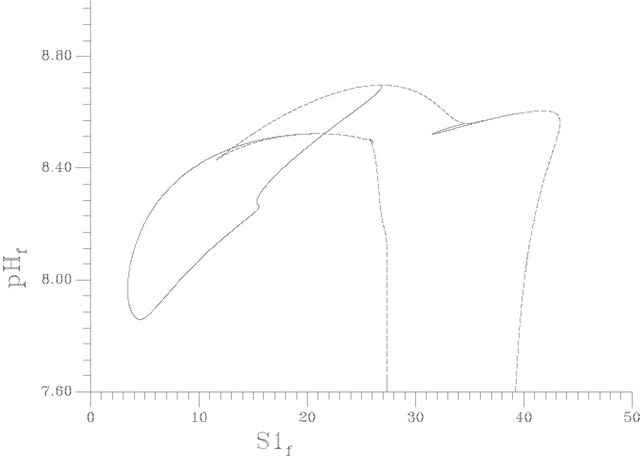 (b)
(b)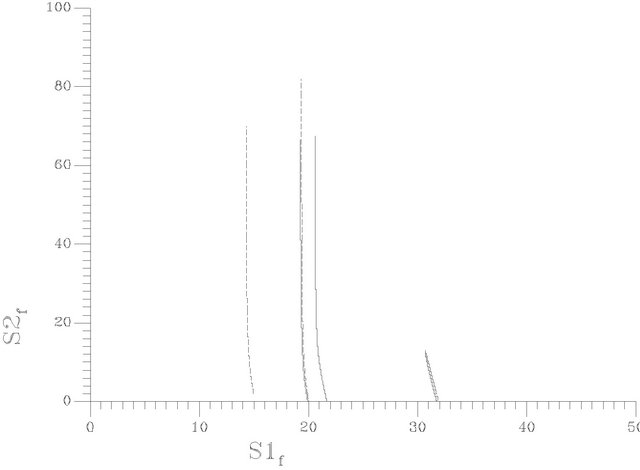 (c)
(c)
Figure 9. (a) Two parameter continuation [S1f vs pHf]; (b) Two parameter continuation [S1f vs γ(gama)]; (c) Two parameter continuation [S1f vs S2f].
tained for s1f = 20 should be considered as only the tip of the iceberg as far as the richness of the system is concerned. To have a better understanding of the different bifurcation mechanisms in the system, the diagram of Figure 9(a), is divided into different regions and the static and dynamic bifurcation for each region is investigated:
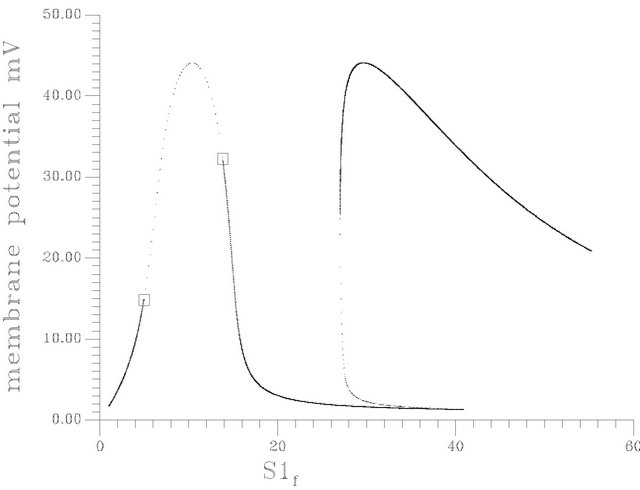
• pHf < 7.8591, this region characterized by the existence of two limit points creating a range of multiplicity of stationary states as represented by Figure 10(a).
•  , this region characterized by the existence of two HB bifurcation points and two SLP, a sample result representing this region is shown by Figure 10(b) at pHf = 8.2. The bifurcation diagram shows the emerging of a range of unique periodic or non-periodic solutions in addition to the multiplicity range.
•  , this region is characterized by the existence of two HB bifurcation points and four SLP. A sample result representing this region is shown by Figure 10(c) at pHf = 8.452. The bifurcation diagram shows the emerging of a second region of multiple stationary states in addition to the bifurcation behavior noticed at pHf = 8.2 of Figure 10(b).
•  , this region is characterized by the existence of four HB bifurcation points in addition to four SLP. A sample result representing this region was illustrated early by Figure 10(d).
•  this region is characterized by the existence of three HB bifurcation points and four SLP. A sample result representing this region is illustrated by Figure 10(e), at pHf = 8.55. The bifurcation diagram shows the emerging of isolated stationary solution (ISOLA).
•  , this region is characterized by the disappearance of the second region of multiplicity and a shrinkage isolated solution as repre-
 (a)
(a)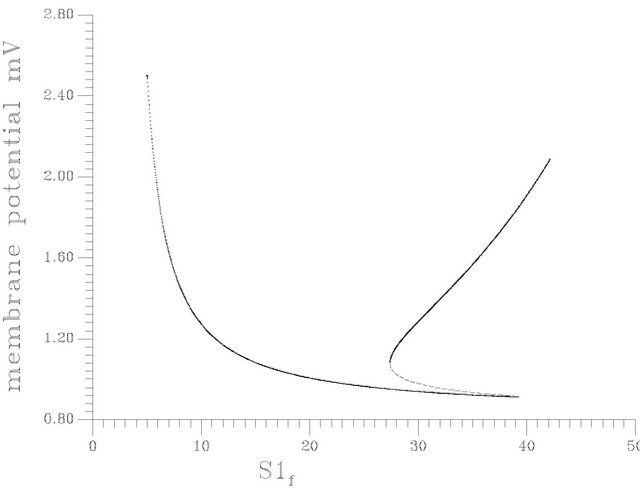 (b)
(b)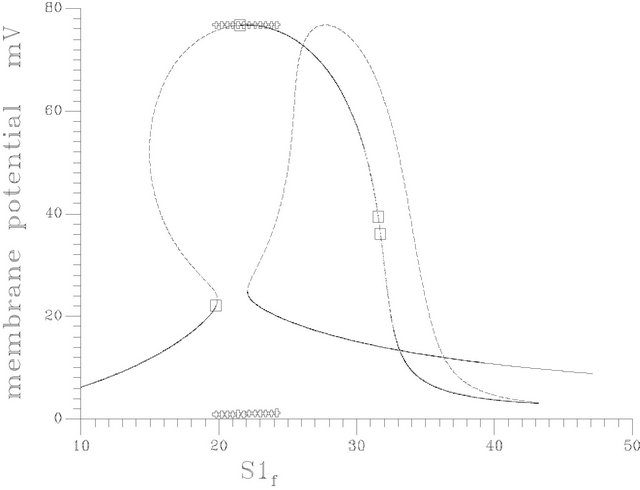 (c)
(c)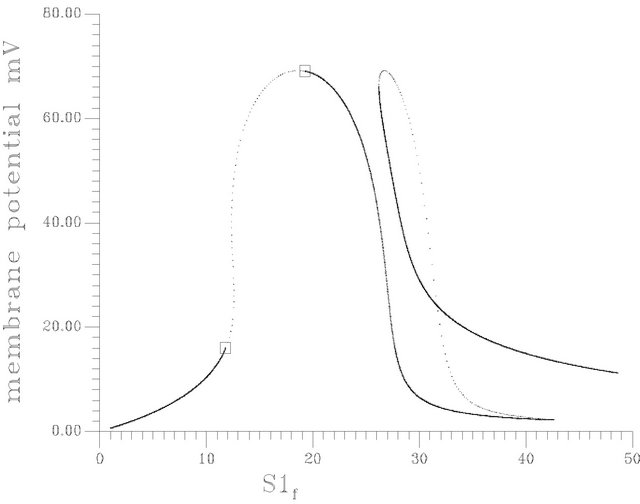 (d)
(d)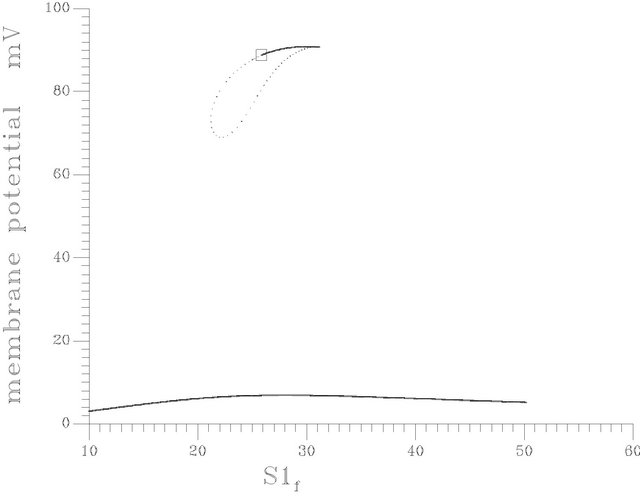 (e)
(e)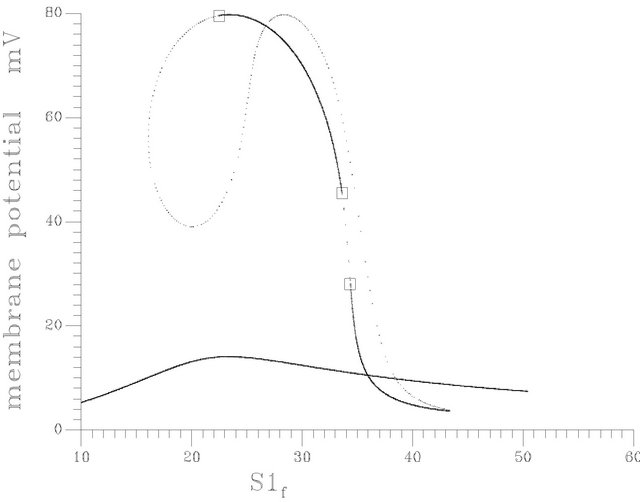 (f)
(f)
Figure 10. (a) Bifurcation diagram at pHf = 7.6 [one region of multiple steady states]; (b) Bifurcation diagram at pHf = 8.2; (c) Bifurcation diagram at pHf = 8.452; (d) Bifurcation diagram at pHf = 8.5287874; (e) Bifurcation diagram at pHf = 8.55; (f) Bifurcation diagram at pHf = 8.65.
sented by Figure 10(f).
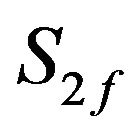
Figures 9(b) and (c) show the two-parameter continuation diagrams: (s1f vs gama) and (s1f vs s2f) respectively. Variety of different one-parameter bifurcation may be obtained. Figure 11 shows a special one-parameter bifurcation diagram, where periodic or non-periodic attractors dominate the system behavior for any value of s2f (feed concentration of choline) greater than the value of the bifurcation parameter at the HB point.
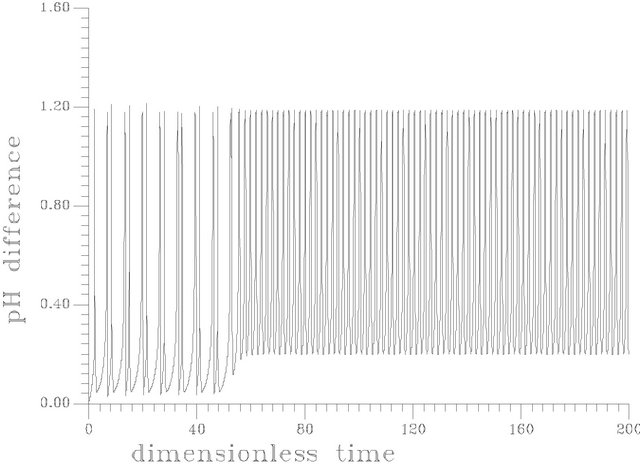
One of the interesting dynamic bifurcation phenomenon obtained is the so-called periodic transient: An orbit in a dissipative system can show transient periodic behavior, i.e. before the orbit falls down onto the final attractor it seems periodic for a long, but finite, time. Figures 12(a)-(c) show this interesting bifurcation phenolmenon. However in dangerous boundaries of the bifurcation parameter, just before the saddle-node bifurcation, the situation is as follows: an exponentially fast attraction along the contracting direction and slow linear drift along the other. These different two time scales cause this phenomenon. Trajectories starting from a given neighborhood are initially attracted to this point which will become a normal attractor as the bifurcation parameter passes through a critical point, then they spend a certain time in the close vicinity of this point, and finally they all leave this region and never return to it [47].
4.2. Response to Quantal Releases of Acetylcholine
Acetylcholine in rat brain was found to be in the range of 2.2 micromole/lit up to 17.7 micromole/lit. while in the guinea pig cerebral cortex the range is 3.1 micromole/lit (free ACh) to 16.7 micromole/lit (total ACh) [37]. ACh in human plancenta is reported to be in the range of 3 micromole/lit to 555 micromole/lit [37].
The quantal nature of acetylcholine release was discovered at the neuromuscular junction and the demonstrated in a variety of central and peripheral synapses [49, 50]. At the neuromuscular and nerve-electro-plaque synapses, the size of evoked ACh quanta is fairly constant (8000 - 10000 ACH molecules). Quantal secretion causes the change in membrane potential that excite the postsynaptic cell, and transmission at a synapse is critically dependent upon this mechanism of release [32,51]. ACh concentrations depend on the volumes of both compartments. For in vitro experiments it is easy to control each compartment volume and consequently controlling of ACh concentration for both the two compartments. With respect to physiological situations, the synaptic clefts have variable constructions and volumes according to its locations and functions. Volume of synaptic clefts could be less than 0.1 femtoliter (10−15 liter) and could be greater than 150 femtoliter as shown by [52-55]. Releases of 1 quanta (10,000 molecules) correspond to the release of 0.1661 × 10⁻¹³ micromole of ACH taking Avogadro’s number in consideration (6.02 × 10²³ molecule/mole). So ACh concentrations may take very low values in micromole/lit units up to values of hundred micromole/lit according to the nature and size of the cleft.
In general, excitability means that the response of a system on external perturbations is “all” or “none” depending on whether the strength of the stimulus is above or below a critical threshold. Prominent examples of excitable systems are the spiking of neurons [56], the cardiac muscle [57], the dynamics of life populations [58], or nonlinear chemical reactions [59,60].
Two different forcing mechanisms have been investigated in this work:
1) Continuous oscillating ACh feeding which obeys the function  where (am) is the amplitude of forcing oscillations and ω is the
 (a)
(a)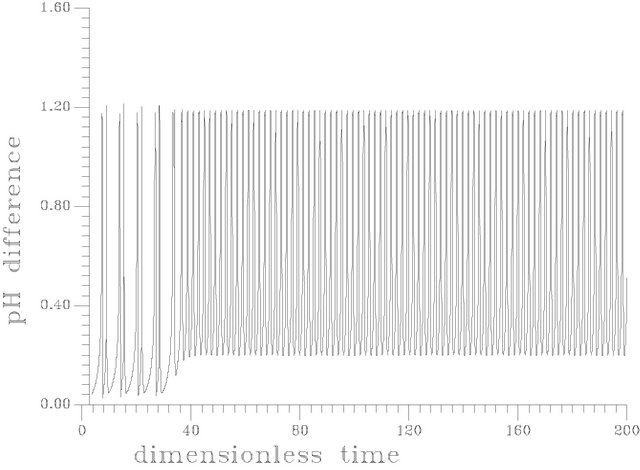 (b)
(b)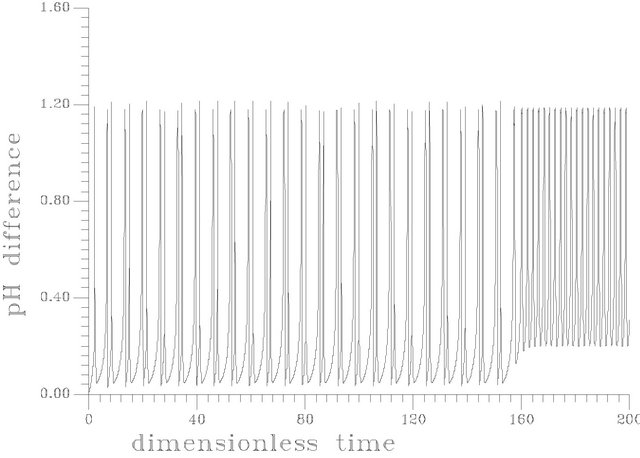 (c)
(c)
Figure 12. (a) Periodic transient at s1f = 14.40375 [this attractor is produced as the same set of parameters as in Table 1 but gama = 0.01, Hf = 0.0024]; (b) Periodic transient at s1f = 14.40373 [this attractor is produced as the same set of parameters as in Table 1 but gama = 0.01, Hf = 0.0024]; (c) Periodic transient at s1f = 14.403722 [this attractor is produced as the same set of parameters as in Table 1 but gama = 0.01, Hf = 0.0024].
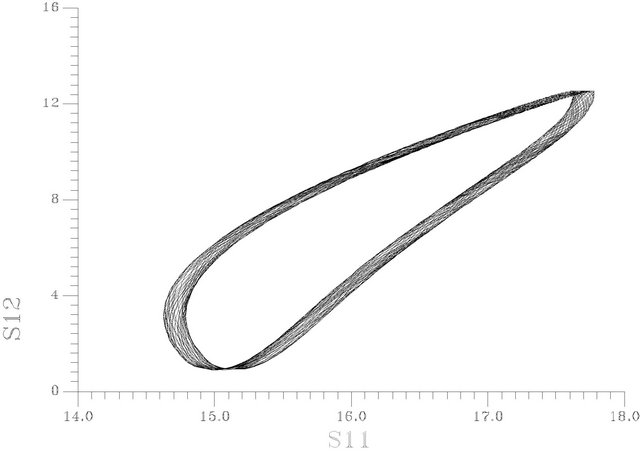
frequency; s1f0 is the starting value of ACh feed concentration (τ = 0) and τ is the dimensionless time. Figure 13 shows the one dimension excitation map for this case at s1f0 = 20, am = 0.0015 and the natural period of the system before forcing is 11.2636099 and the rest of system parameters as in Table 1. It is clear that the bifurcation scenario obeys the so-called crises bifurcation where: period one attractor from left goes suddenly to chaotic attractor. Infinite periodic and chaotic patterns may obtain using Figure 13. Figure 14 shows the phase plan of a chaotic attractor at ω = 3.5.
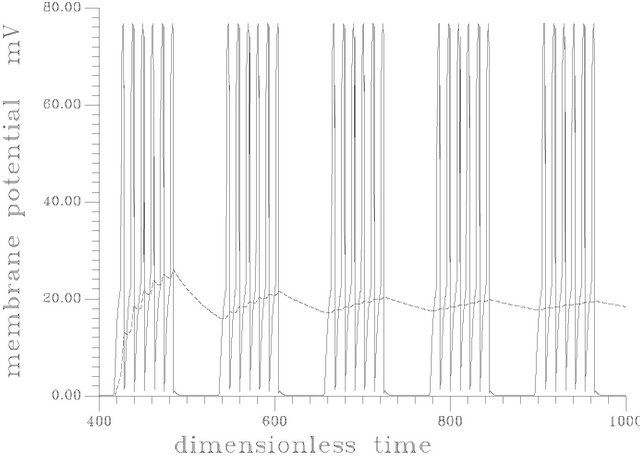
2) Discontinuous constant feeding of ACh (square forcing): in this case the system response to long period forcing (120, 80) is shown in Figures 15(a) and (b). The resulting patterns have the feature of actual physiological response (where the neural bursts involve one or more spikes (60)). Figure 15 shows the oscillatory pattern of membrane potential at period equal to 80. Figure 15(b) shows the oscillatory pattern at period equal to 120.
5. Concluding Remarks
An eight-dimensional non-linear mathematical model (two-enzymes/two-compartments) is developed for a coupled AChE/ChAT enzymes system considering the physiological reality and importance of the transmembrane pH and electrical gradient (ΔpH and membrane potential differences respectively) of this neural system. The investigation has been based on a well established kinetic scheme and kinetic data. The model accounts for the effects of hydrogen ion concentrations on the kinetics and its role in creating membrane potential, assuming no other charged ions exist. Both autonomous and nonautonomous cases were investigated considering the two common mechanisms of applying acetylcholine in prac-

Figure 13. One dimension excitation map using the function S1f = S1f0*(1 + Am*sin(ωτ))-[Am = 0.015, natural period = 11.2636099].
tical physiological situations (constant and quantal).
The investigation uncovered a wealth of static and dynamic bifurcations of the system including multiplicity of steady states, isola, periodic and aperiodic behavior. The use of two parameters continuation technique uncover different qualitative changes in bifurcations with respect to three of the system parameters (pHf, γ, S2f). Different bifurcations occurred at alkaline feed pH and a wide range of the other two parameters.
It was observed that all the state variables were very sensitive to the variations in the acetylcholine inlet concentration S1f as a bifurcation parameter. Their behavior was strongly dominated by the hysteresis and multiplicity phenomena throughout a large range of the bifurcation parameter. Different kinds of solutions existed: point (stationary state), periodic, chaotic bi-stability, tri-stability was found. Boundary crises bifurcations are the dominating scenario of bifurcation: periodic transient and boundary crises bifurcation to chaos were shown. Intrinsic bursts with one spike are the most common periodic and aperiodic behavior of the system.
It is noticed that the variation in pH and consequentially the membrane potential are a little bit bigger than those recorded in actual physiological situations; this is due to the fact that the model ignores any effects of other ions (generation and transport) but hydrogen ions, and the assumption of fully ionization of the acetic acid.
Different kinds of bursts may be obtained in response to the quantal feeding mechanism; bursts with more than one spike were obtained (spike train).
An experimental research work is recommended in order to use this model for simulating real physiological behavior. Availability of good experimental data for human brain in the future can help in improving this model. It can also help in deeper understanding of the physiological behavior and in planning better brain experiments and in linking the complex behavior investigated to the cholinergic disorders.
 (a)
(a)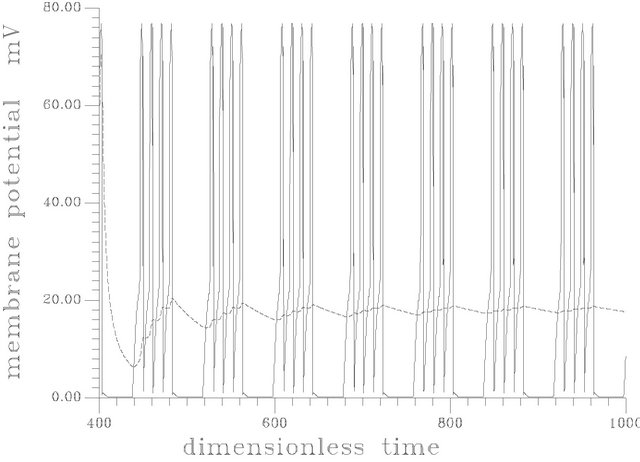 (b)
(b)
Figure 15. (a) Spike train obtained at square input [s1f = 20], period = 80 and frequency of the input = 0.078539816. [γ = 0.032, Hf = 0.003]; (b) Spike train at frequency of 0.0523598775, period of 120, and the same parameters as (a).
6. Acknowledgements
The authors would like to thank the Deanship of Scientific Research, Salaman Bin AbdulAziz University, Kingdom of Saudi Arabia for their support to this research.
REFERENCES
- D. M. Quinn, A. S. Balasubremanian, B. P. Doctor and P. Taylor, “Enzymes of the Cholinestrase Family,” Plenum Press, London, 1995.
- S. Tucek, “Acetylcholine Synthesis in Neurons,” Chapman and Hall, London, 1978.
- C. A. Guyton, “Medical Physiology,” 7th Edition, W. B. Saunders Company, Philadelphia, 1986.
- T. E. Barman, “Enzyme Handbook,” Vol. 1, SpringerVerlage, New York, 1969.
- R. R. Llinás, “The Squid Giant Synapse: A Model for Chemical Transmission,” Oxford University Press, London, 1999.
- http://www.biology.ucsd.edu/classes/bibc102.WI99/neuro/Neurotransmitter. html
- H. Soreq and H. Zakut, “Human Cholinsterases and Anticholinesterases,” Academic Press, San Diego, 1993.
- A. L. Koch, “The pH in the Neighborhood of Membranes Generating a Protomotive Force,” Journal of Theoretical Biology, Vol. 120, No. 1, 1986, pp. 73-84.
- R. Friboulet, A. David and D. Thomas, “Excitability Memory and Oscillation in Artificial Acetylcholinesterase Membranes,” Journal of Membrane Science, Vol. 8, No. 33, 1981, pp. 33-39. doi:10.1016/S0376-7388(00)82137-7
- J. L. Hindmarsh and R. M. Rose, “A Model of Neuronal Bursting Using Three Coupled First Order Differential Equations,” Proceedings of the Royal Society, Vol. 221, No. 1222, 1984, pp. 87-102. doi:10.1098/rspb.1984.0024
- J. L. Hindmarsh and R. M. Rose, “A Model of the Nerve Impulse Using Two First-Order Differential Equations,” Nature, Vol. 296, No. 5853, 1982, pp. 162-164. doi:10.1038/296162a0
- R. Fitzhugh, “Impulses and Physiological States in Theoretical Models of Nerve Membranes,” Biophysical Journal, Vol. 1, No. 6, 1985, pp. 445-466. doi:10.1016/S0006-3495(61)86902-6
- A. V. Holden and Y. S. Fan, “Crisis-Induced Chaos in the Rose-Hindmarsh Model for Neuronal Activity,” Chaos, Solitons and Fractals, Vol. 2, No. 6, 1992, pp. 583-595. doi:10.1016/0960-0779(92)90055-R
- A. V. Holden and Y. S. Fan, “From Simple to Complex Oscillatory Behaviour via Intermittent Chaos in the RoseHindmarsh Model for Neuronal Activity,” Chaos, Solitons and Fractals, Vol. 2, No. 4, 1992, pp. 349-369. doi:10.1016/0960-0779(92)90012-C
- A. V. Holden and Y. S. Fan, “From Simple to Simple Bursting Oscillatory Behaviour via Chaos in the RoseHindmarsh Model for Neuronal Activity,” Chaos, Solitons and Fractals, Vol. 2, No. 3, 1992, pp. 221-236. doi:10.1016/0960-0779(92)90032-I
- Y. S. Fan and A. V. Holden, “Bifurcation, Bursting, Chaos and Crisis in the Rose-Hindmarsh Model for Neuronal Activity,” Chaos, Solitons and Fractals, Vol. 3, No. 4, 1993, pp. 439-449. doi:10.1016/0960-0779(93)90029-Z
- G. Ibrahim, O. Saleh, I. H. Mustafa, A. H. El Ahwany and S. S. E. H. El Nashaie, “Modeling Peiodic and Aperiodic Behavior of Acetylcholine Hydrolysis,” International Review of Chemical Engineering, Vol. 2, No. 6, 2010, pp. 19-33.
- G. Ibrahim and S. S. E. H. Elnashaie, “Hyperchaos in Acetylcholinesterase Enzyme Systems,” Chaos, Solitons and Fractals, Vol. 8, No. 12, 1997, pp. 1997-2007.
- I. H. Mustafa, G. Ibrahim, A. Elkamel, S. S. E. H. Elnashaie and P. Chen, “Non-Linear Feedback Modeling and Bifurcation of the Acetylcholine Neurocycle and Its Relation to Alzheimer’s and Parkinson’s Diseases,” Chemical Engineering Science, Vol. 64, No. 1, 2009, pp. 69- 90. doi:10.1016/j.ces.2008.09.009
- I. H. Mustafa, A. Elkamel, G. Ibrahim, P. Chen and S. S. E. H. Elnashaie, “Effect of Choline and Acetate Substrates on Bifurcation and Chaotic Behavior of Acetylcholine Neurocycle and Alzheimer’s and Parkinson’s Diseases,” Chemical Engineering Science, Vol. 64, No. 9, 2009, pp. 2096-2112. doi:10.1016/j.ces.2009.01.027
- I. H. Mustafa, A. Elkamel, P. Chen, G. Ibrahim and S. S. E. H. Elnashaie, “Effect of Cholineacetyltransferase Activity and Choline Recycle Ratio on Diffusion-Reaction Modelling, Bifurcation and Chaotic Behavior of Acetylcholine Neurocycle and Their Relation to Alzheimer’s and Parkinson’s Diseases,” Chemical Engineering Science, Vol. 68, No. 1, 2012, pp. 19-35. doi:10.1016/j.ces.2011.08.012
- P. Garhyan, A. M. Botero and S. S. E. H. Elnashaie, “Complex Bifurcation/Chaotic Behavior of Acetylcholinesterase and Cholineacetyltransferase Enzymes System,” Applied Mathematical Modelling, Vol. 30, 2006, pp. 824-853.
- L. B. Hersh and M. Peet, “Re-Evaluation of the Kinetic Mechanism of the Choline Acetyltransferase Reaction,” The Journal of Biological Chemistry, Vol. 252, No. 14, 1977, pp. 4796-4802.
- E. J. Doedel, A. R. Champneys, T. F. Fairgrieve, Y. A. Kuznetsov, B. Sandstede and X. J. Wang, “AUTO97: Continuation and Bifurcation Software for Ordinary Differential Equations,” Department of Computer Science, Concordia University, Montreal, 1997.
- S. S. E. H. Elnashaie, G. Ibrahim and F. A. Teymour, “Chaotic Behavior of an Acetylcholinesterase Enzyme System,” Chaos, Solitons and Fractals, Vol. 5, No. 6, 1995, pp. 933-954. doi:10.1016/0960-0779(94)00205-5
- S. Karel
 and H. Milan,
  “Biotechnological Aspects of Membrane Function,” Critical Reviews in Biotechnology, Vol. 17, No. 2, 1997, pp. 69-86. doi:10.3109/07388559709146607
 - M. Obara, M. Szeliga and J. Albrecht, “Regulation of pH in the Mammalian Central Nervous System under Normal and Pathological Conditions: Facts and Hypotheses,” Neurochemistry International, Vol. 52, No. 6, 2008, pp. 905- 919. doi:10.1016/j.neuint.2007.10.015
- J. Antosdiewicz, J. A. McCammon and M. K. Gilson, “Prediction of pH-Dependent Properties of Proteins,” Journal of Molecular Biology, Vol. 238, No. 3, 1994, pp. 415-436. doi:10.1006/jmbi.1994.1301
- D. M. Michaelson and I. Angel, “Determination of Delta pH in Cholinergic Synaptic Vesicles: Its Effect on Storage and Release of Acetylcholine,” Life Sciences, Vol. 27, No. 1, 1980, pp. 39-44. doi:10.1016/0024-3205(80)90017-X
- H. H. Fuldner and H. Stadler, “31P-NMR Analysis of Synaptic Vesicles, Status of ATP and Internal pH,” European Journal of Biochemistry, Vol. 121, No. 3, 1982, pp. 519-524. doi:10.1111/j.1432-1033.1982.tb05817.x
- R. Ahdu-Hacohen, D. Duridanova, H. Meiri and R. Rahamimoff, “Hydrogen Ions Control Synaptic Vesicle Ion Channel Activity in Torpedo Electromotor Neurons,” Journal of Physiology, Vol. 556, No. 2, 2004, pp. 347-352.
- S. M. Parsons, “Transport Mechanisms in Acetylcholine and Monoamine Storage,” The FASEB Journal, Vol. 14, No. 15, 2000, pp. 2423-2434. doi:10.1096/fj.00-0203rev
- S. Heven, X. H. Li and G. P. Michael, “Energization of Plant Cell Membranes by H+-Pumping ATPases: Regulation and Biosynthesis,” The Plant Cell, Vol. 11, No. 4, 1999, pp. 677-689.
- A. L. Koch, “The pH in the Neighborhood of Membranes Generating a Protomotive Force,” Journal of Theoretical Biology, Vol. 120, No. 1, 1986, pp. 73-84. doi:10.1016/S0022-5193(86)80018-2
- C. Rae, R. Scott, C. H. Thompson, I. Dumughn, G. Kemp, P. Styles, I. M. Tracey and G. K. Radda, “Is Brain pH a Biochemical Marker of IQ?” Proceedings of the Royal Society, Vol. 263, No. 1373, 1996, pp. 1061-1064. doi:10.1098/rspb.1996.0156
- A. Zauner and J. P. Muizelaar, “Brain Metabolism and Cerebral Blood Flow,” In: P. Reilly and R. Bullock, Eds., Head Injury: Pathophysiology and Management of Severe Closed Injury, Chapman and Hall, London, 1997.
- I. Wessler, E. Roth, S. Schwarze, W. Weikel, F. Bittinger, C. J. Kirkpatrick and H. Kilbindger, “Release of NonNeural Acetylcholine from the Human Placenta: Difference to Neural Acetylcholine,” Naunyn-Schmiedeberg’s Archives of Pharmacology, Vol. 364, No. 3, 2001, pp. 205-212. doi:10.1007/s002100100445
- S. Kysela and J. Torok, “Histamine H1-Receptor Antagonists do not Prevent the Appearance of Endothelium-Dependant Relaxation to Acetylcholine in Rat Pulmonary Artery,” Physiological Research, Vol. 45, No. 4, 1996, pp. 345-350.
- R. R. Chay and J. Rinzel, “Bursting, Beating and Chaos in an Excitable Membrane Model,” Biophysical Journal, Vol. 47, No. 3, 1985, pp. 357-366. doi:10.1016/S0006-3495(85)83926-6
- W. F. Boron and E. L. Boulpaep, “Medical Physiology,” W.B. Saunders, Philadelphia, 2002.
- P. Constable, “A Simplified Strong Ion Model for AcidBase Equilibria: Application to Horse Plasma,” Journal of Applied Physiology, Vol. 83, No. 1, 1997, pp. 297-311.
- K. A. Gossett, D. D. French, B. Cleghorn and G. E. Church, “Effect of Acute Acidemia on Blood Biochemical Variables in Healthy Ponies,” American Journal of Veterinary Research, Vol. 51, No. 9, 1990, pp. 1375-1379.
- L. P. Sil’nikov, “A Contribution to the Problem of the Structure of an Extended Neighbourhood of a Structurally Stable Equilibrium of Saddle-Focus Type,” Mathematics of the USSR-Sbornik, Vol. 10, No. 1, 1970, pp. 91-102. doi:10.1070/SM1970v010n01ABEH001588
- O. E. Rossler, J. L. Hudsun and R. Rossler, “Homoclinic Hyperchaos—An Explicit Example,” Physica D: Nonlinear Phenomena, Vol. 62, No. 1-4, 1993, pp. 80-86.
- C. Javier, I. A. García and J. Sorolla, “Resolution of the Poincaré Problem and Nonexistence of Algebraic Limit Cycles in Family (I) of Chinese Classification,” Chaos, Solitons & Fractals, Vol. 24, No. 2, 2005, pp. 491-499. doi:10.1016/j.chaos.2004.06.076
- S. Wiggins, “Introduction to Applied Nonlinear Dynamical Systems and Chaos,” Springer-Velag, New York, 1990.
- J. Guckenheimer and P. Hohns, “Nonlinear Oscillations, Dynamical Systems and Bifurcntion of Vector Fields,” Springer, New York, 1983.
- M. Franaszek, “Long-Lived Periodic Transients,” Acta Physica Polonica B, Vol. 22, No. 9, 1991.
- P. Fatt and B. Katz, “Spontaneous Sub Threshold Activity at Motor Nerve Endings,” The Journal of Physiology, Vol. 117, No. 1, 1952, pp. 109-128.
- M. R. Bennett, “The Origin of Gaussian Distributions of Synaptic Potentials,” Progress in Neurobiology, Vol. 46, No. 4, 1995, pp. 331-350. doi:10.1016/0301-0082(94)00061-L
- Y. Dunant and M. Israel, “Neurotransmitter Release at Rapid Synapses,” Biochimie, Vol. 82, No. 4, 2000, pp. 289-302. doi:10.1016/S0300-9084(00)00194-2
- M. C. Rosales-Hernandez, J. E. Mendieta-Wejebe, J. Correa-Basurto, J. I. Vazques-Alcantara, E. Terres-Rojas and J. Trujillo-Ferrara, “Catalytic Activity of Acetylcholinesterase Immobilized on Mesoporous Molecular Sieves,” International Journal of Biological Macromolecules, Vol. 40, No. 5, 2007, pp. 444-448. doi:10.1016/j.ijbiomac.2006.11.004
- F. H. White, D. A. Thompson and K. Cohari, “Ultra Structural Morphometry of Gap Junctions during Differentiation of Stratified Squamous Epithelium,” Journal of Cell Science, Vol. 69, 1984, pp. 67-85.
- W. Van Der Kloot, J. Molgo, R. Cameron and C. Colasante, “Vesicle Size and Transmitter Release at the Frog Neuromuscular Junction When Quantal Acetylcholine Content Is Increased or Decreased,” Journal of Physiology, Vol. 541, 2002, pp. 385-393. doi:10.1113/jphysiol.2001.014407
- L. P. Sartchenko and D. A. Rusakov, “The Optimal Height of Synaptic Cleft,” Proceedings of the National Academy of Sciences of the USA, Vol. 104, No. 6, 2007, pp. 1823-1828. doi:10.1073/pnas.0606636104
- A. L. Hodgkin, “The Local Electric Changes Associated with Repetitive Action in a Non-Medulated Axon,” Journal of Physiology, Vol. 107, 1948, pp. 165-181.
- J. D. Murray, “Mathematical Biology,” Springer, New York, 1990.
- D. R. Clother and J. Brindley, “Excitability of an AgeStructured Plankton Ecosystem,” Journal of Mathematical Biology, Vol. 39, No. 5, 1999, pp. 377-420. doi:10.1007/s002850050172
- A. Zhabotinsky and A. Zaikin, “Concentration Wave Propagation in Two-Dimensional Liquid-Phase Self-Oscillating System,” Nature, Vol. 225, 1970, pp. 535-537.
- [61] E. M. Izhikevich, “Dynamical Systems in Neuroscience: The Geometry of Excitability and Bursting,” MIT Press, Cambridge, 2007.
Notation
Symbol Description
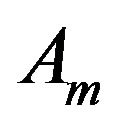 Membrane area, m2
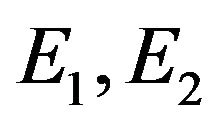 Enzyme concentration in kg/m3-1 for ChAT enzyme-2 for AChE enzyme
 Hydrogen ions concentration in kmol/m3
 Equilibrium and inhibition constants
 Equilibrium constants
 Volumetric flow rate in m3/s
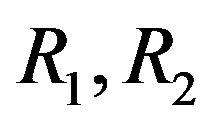 Rate of production and consumption of ACh respectively in s−1
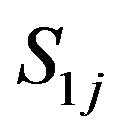 ACh concentration in kmol/m3
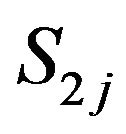 Choline concentration in kmol/m3
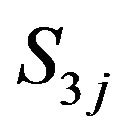 Acetyl Coenzyme concentration in kmol/m3
 Time in s
 Compartment volume in m3
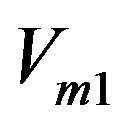 Specific enzyme velocity (ChAT) in s−1
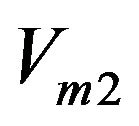 Specific enzyme velocity (AChE) in s−1
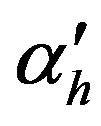 Membrane permeability for hydrogen ions, m/s
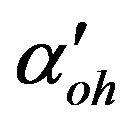 Membrane permeability for hydroxyl ions, m/s
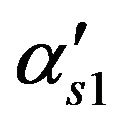 Membrane permeability for ACh, m/s
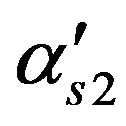 Membrane permeability for Choline, m/s
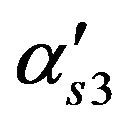 Membrane permeability for acetyl Co enzyme, m/s
Abbreviations
AChE Acetylcholinesterase ChAT Choline Acetyltransferase CoA Coenzyme A ACh Acetylcholine Ch Choline CSTR Continuously Stirred Tank Reactor HB Hopf Bifurcation SB Static Bifurcation U Periodic Limit Point PD Period Doubling Pi Periodicity i of the Periodic Orbit
Subscripts
1 Compartment 1 2 Compartment 2 f Feed condition
Legend for Figures
——— Stable steady state branch
--------- Unstable steady state branch
······· Stable periodic branch
Dimensionless Parameters and State Variables
Symbol Description
 Dimensionless substrate inhibition constant
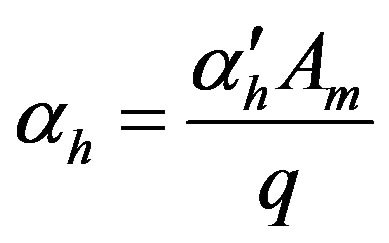 Dimensionless permeability of hydrogen ions
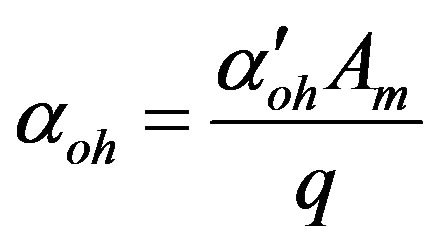 Dimensionless permeability constant of hydroxyl ions
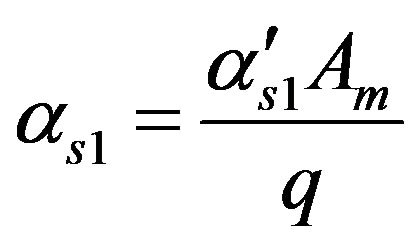 Dimensionless permeability c onstant of ACh
 Dimensionless permeability constant of Choline
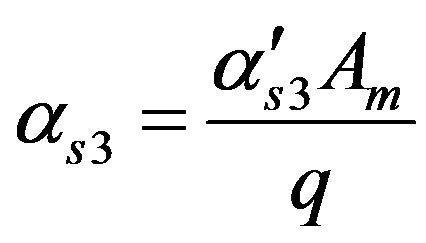 Dimensionless permeability constant of Acetyl Co-enzyme
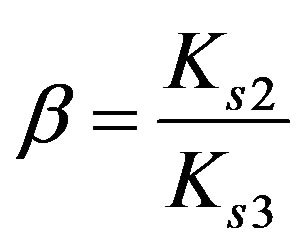 Dimensionless equilibrium ratio
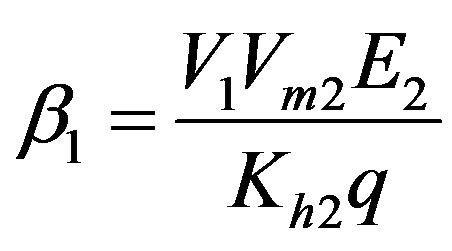 Dimensionless reaction activity constant
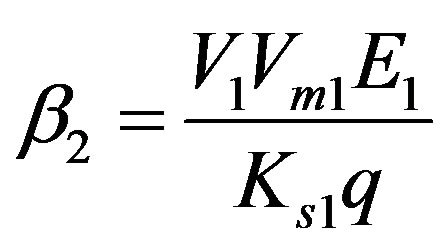 Dimensionless reaction activity constant
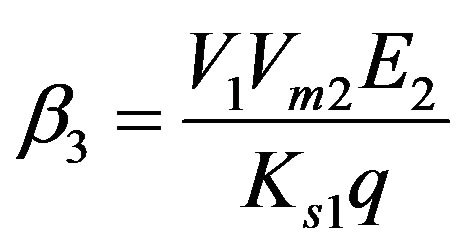 Dimensionless reaction activity constant
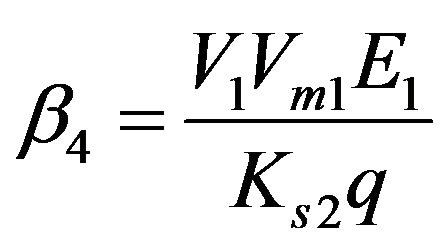 Dimensionless reaction activity constant
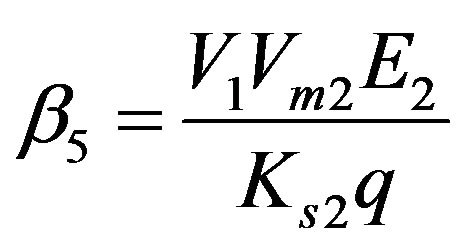 Dimensionless reaction activity constant
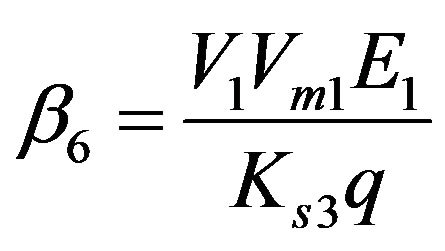 Dimensionless reaction activity constant
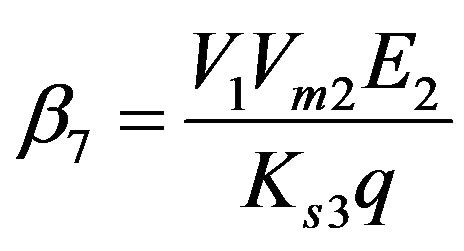 Dimensionless reaction activity constant
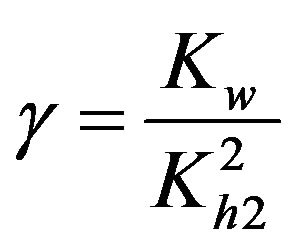 Dimensionless equilibrium ratio
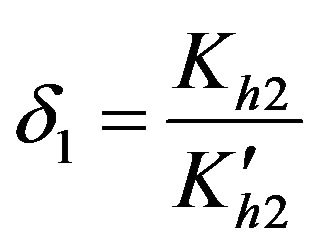 Dimensionless equilibrium ratio
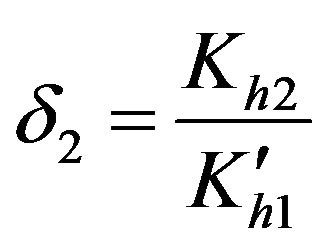 Dimensionless equilibrium ratio
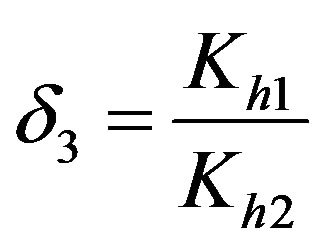 Dimensionless equilibrium ratio
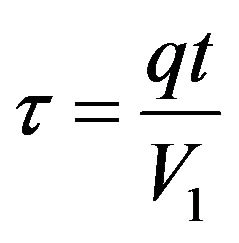 Dimensionless time
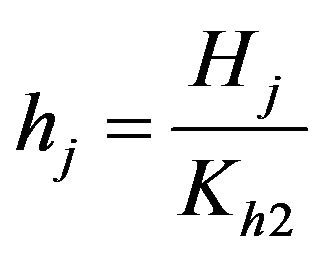 Dimensionless hydrogen ions concentration
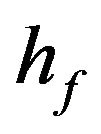
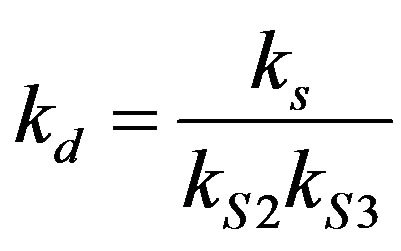 Dimensionless equilibrium ratio
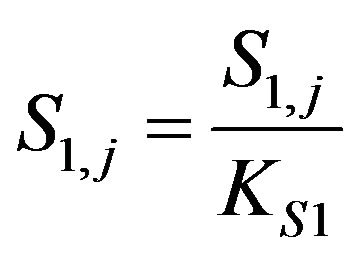 Dimensionless ACh concentration
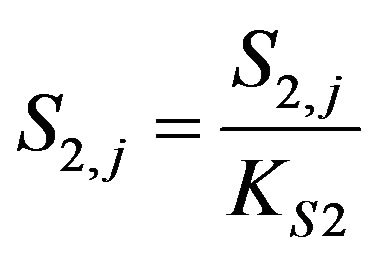 Dimensionless Choline concentration
 Dimensionless Acetyl Co-enzyme concentration
 ACh feed concentration
 Choline feed concentration
 Acetate feed concentration
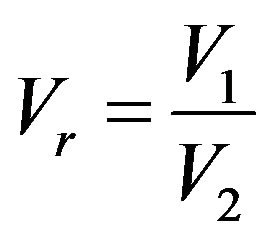 Compartment volume ratio
NOTES
*Corresponding author.


