Journal of Transportation Technologies
Vol. 3 No. 2 (2013) , Article ID: 30404 , 11 pages DOI:10.4236/jtts.2013.32013
Cloud-Based Information Technology Framework for Data Driven Intelligent Transportation Systems
Electrical and Computer Engineering, Georgia Institute of Technology, Atlanta, USA
Email: arshdeep@gatech.edu, vkm@gatech.edu
Copyright © 2013 Arshdeep Bahga, Vijay K. Madisetti. This is an open access article distributed under the Creative Commons Attribution License, which permits unrestricted use, distribution, and reproduction in any medium, provided the original work is properly cited.
Received January 24, 2013; revised February 12, 2013; accepted February 20, 2013
Keywords: Cloud Computing; Vehicle Routing; Supply Chain; Tracking; Hadoop
ABSTRACT
We present a novel cloud based IT framework, CloudTrack, for data driven intelligent transportation systems. We describe how the proposed framework can be leveraged for real-time fresh food supply tracking and monitoring. CloudTrack allows efficient storage, processing and analysis of real-time location and sensor data collected from fresh food supply vehicles. This paper describes the architecture, design, and implementation of CloudTrack, and how the proposed cloud-based IT framework leverages the parallel computing capability of a computing cloud based on a largescale distributed batch processing infrastructure. A dynamic vehicle routing approach is adopted where the alerts trigger the generation of new routes. CloudTrack provides the global information of the entire fleet of food supply vehicles and can be used to track and monitor a large number of vehicles in real-time. Our approach leverages the advantages of the IT capabilities of a computing cloud into the operations and supply chain.
1. Introduction
Intelligent transportation systems (ITS) have evolved significantly in recent years. Modern ITS are driven by data collected from multiple sources which is processed to provide new services to the stakeholders. In a recent survey paper, Zhang et al. [1] describe how conventional intelligent transportation systems (ITS) have transformed into data-driven ITS. By collecting large amount of data from various sources and processing the data into useful information, data-driven ITS can provide new services such as advanced route guidance [2,3], dynamic vehicle routing [4], etc.
Cloud computing has been implemented in various domains such as healthcare [5], education [6], smart grids [7], etc. Recent publications have demonstrated the benefits of cloud computing for intelligent transportation systems [8,9]. In our previous work [10], we demonstrated how cloud computing technologies can be used for massive scale sensor data collection and analysis for predicting faults in industrial machines. The successful adoption of cloud computing paradigm in various domains provides the motivation to implement a cloudbased framework for data driven intelligent transportation systems.
Collection and organization of data from multiple sources in real-time and using the massive amounts of data for providing intelligent decisions for operations and supply chains, is a major challenge, primarily because the size of the databases involved is very large, and realtime analysis tools have not been available. However, recent advances in massive scale data processing systems, utilized for driving business operations of corporations provide a promising approach to massive ITS data storage and analysis.
In this paper we propose a cloud-based IT framework, CloudTrack, for data driven intelligent transportation systems. CloudTrack is built using proven open source cloud-based technologies that are already deployed in other domains. The proposed framework allows efficient storage, processing and analysis of real-time data collected from various sources. The global information available when utilizing a cloud-based IT environment allows a scalable, efficient, and optimized integration of the IT environment into the operations environment.
Fresh food can be damaged during transit due to unrefrigerated conditions and changes in environmental conditions such as temperature and humidity, which can lead to microbial infections and biochemical reactions or mechanical damage due to rough handling. In emerging countries, such as in India that is second largest producer of fruits and vegetables in the world, as much as 30% - 35% of fruits and vegetables perish during harvest, storage, grading, transport, packaging and distributions [11]. Since fresh foods have short durability, tracking the supply of fresh foods and monitoring the transit conditions can help identification of potential food safety hazards. The analysis and interpretation of data on the environmental conditions in the container and food truck positioning can enable more effective routing decisions in real time. Therefore, it is possible to take remedial measures such as: 1) the food that has a limited time budget before it gets rotten can be re-routed to a closer destinations; 2) alerts can be raised to the driver and the distributor about the transit conditions, such as container temperature exceeding the allowed limit and corrective actions can be taken before the food gets damaged. Table 1 provides a comparison of the published approaches for fresh food tracking.
2. Current Challenges & Contributions
Collecting and organizing location and sensor data from vehicles in transit and using the data for raising alerts about violation of certain conditions is a major challenge for the following reasons: 1) wide coverage is needed for collection of location and sensor data from vehicles carrying fresh food supply; 2) data needs to be collected from a large number of vehicles in real-time to raise timely alerts; 3) the collected data is massive scale, since the real-time data from a large number of vehicles is collected simultaneously; 4) the massive scale data needs to be organized and processed in real-time; 5) the infrastructure used for data collection should be low cost and easily deployable to ensure wide popularity. The major contributions of this paper are: 1) We propose, CloudTrack, a framework for organization and analysis massive scale data generated by data-driven ITS (such as vehicle location and sensor data) in a computing cloud, that allows efficient collection of data on vehicle locations and container conditions and creation of alerts based on the global information; 2) An efficient cloudbased deployment architecture for data driven ITS that leverages a distributed batch processing infrastructure; 3) A dynamic vehicle routing approach that is triggered by the alerts which are generated by CloudTrack. CloudTrack can support a wide variety of dynamic vehicle routing algorithms; 4) A cloud-based vehicle location and container conditions tracking Software as a Service (SaaS). Vehicles can register with the CloudTrack service on-demand. CloudTrack is flexible to scale up or scale down resources based on the number of vehicles registered with the service; 5) A global approach to collect the data from a large number of vehicles at a centralized location, which can be analyzed for detecting bottlenecks in the supply chain such as traffic congestions on routes, reorganization of assignments and generation of alternative routes, and supply chain optimization.
3. Deployment Architectures for Data Driven ITS
Figure 1 shows a typical three tier web-based deployment architecture used by conventional data driven intelligent transportation systems [12-14]. Tier-1 or the front end servers consists of the web servers, tier-2 consists of
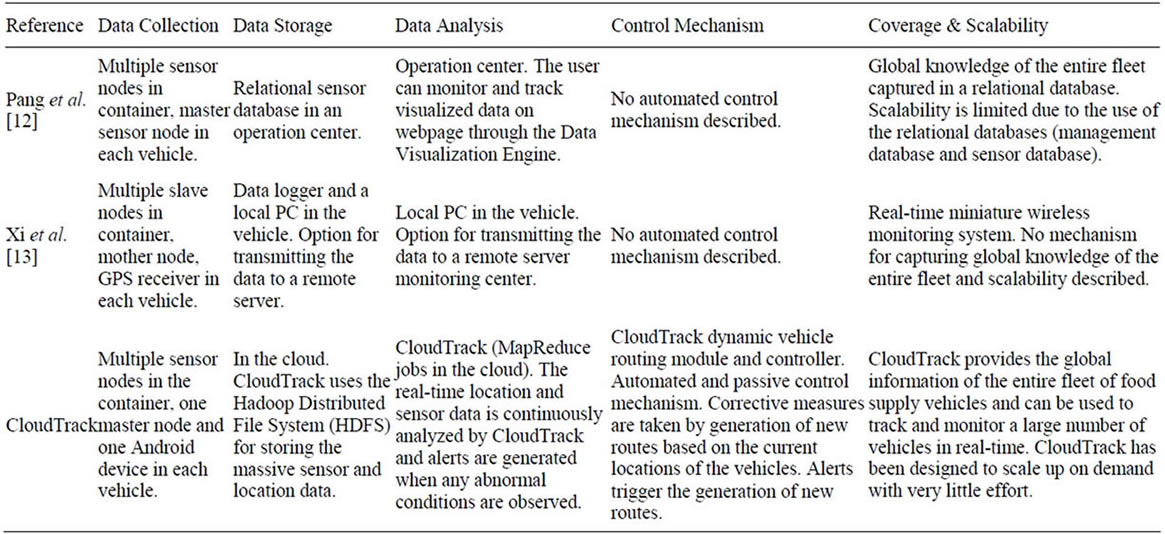
Table 1. Comparison of related work.
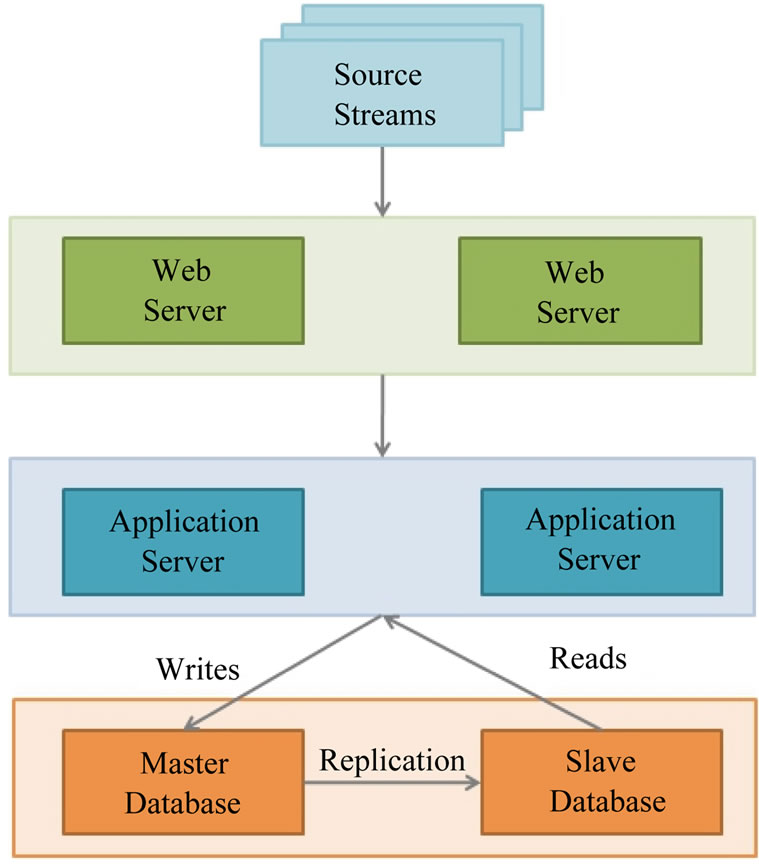
Figure 1. Three-tier web-based architecture used by conventional data driven intelligent transportation systems.
application servers and tier-3 consists of data-base servers. Figure 2" target="_self"> Figure 2 shows a cloud deployment architecture used in our proposed framework. In this deployment architecture, tier-1 consists of the web servers and load balancers, tier-2 consists of application servers and tier-3 consists of a cloud based distributed batch processing infrastructure such as Hadoop. Compute intensive tasks such as data processing are formulated as MapReduce jobs which are executed on Hadoop. This deployment is suitable for massive scale data analytics. Data is stored in a cloud based distributed storage such as Hadoop Distributed File System (HDFS). The advantages of cloudbased architecture shown in Figure 2 as compared to the traditional web-based architecture shown in Figure 1, are as follows.
3.1. Rapid Elasticity
Cloud-based deployment architecture leverages the dynamic scaling capabilities of computing clouds. Two types of scaling options are available for the cloud-based deployment, described as follows:
1) Horizontal Scaling (scaling-out): Horizontal scaling or scaling-out involves launching and provisioning additional server resources for various tiers of the deployment.
2) Vertical Scaling (scaling-up): Vertical scaling or scaling-up involves changing the computing capacity assigned to the server resources while keeping the number of server resources constant.
3.2. Massive Data Analysis
Cloud-based distributed batch processing infrastructure
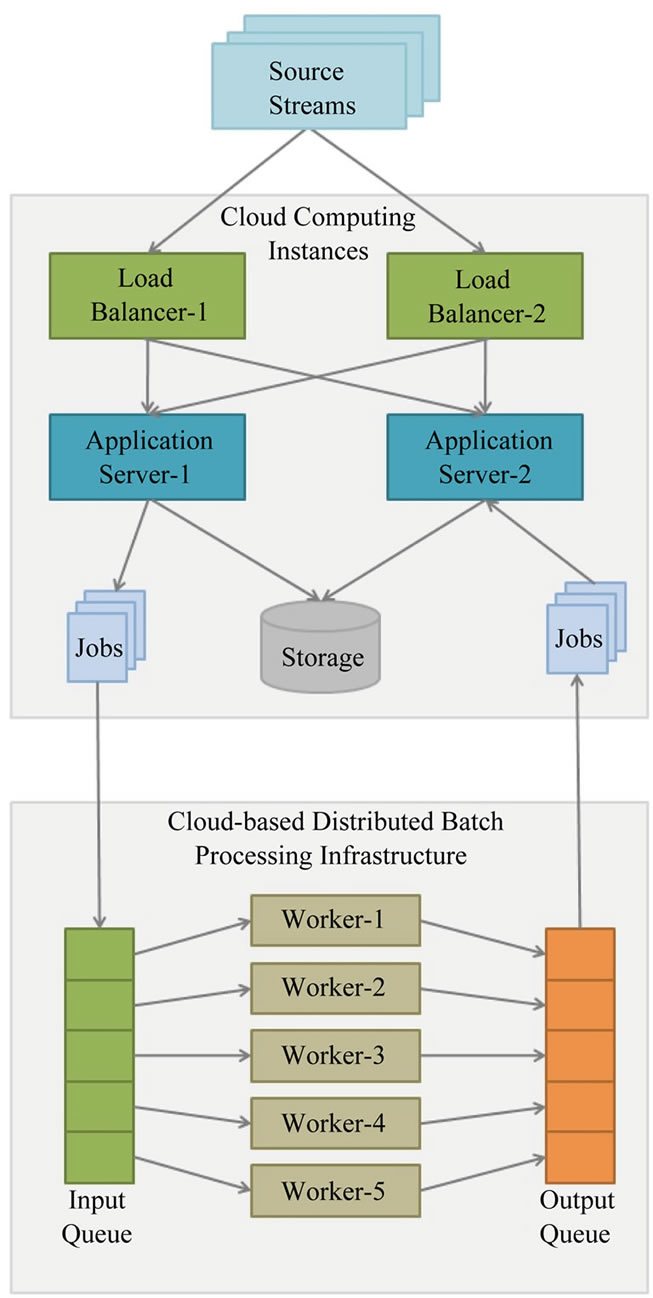
Figure 2. Cloud-based architecture used by our proposed framework for data driven intelligent transportation systems that leverages a distributed batch processing infrastructure.
such as Hadoop allows processing large scale data. Thus Hadoop is well suited for location and sensor data analysis. The Hadoop Distributed File System (HDFS) allows storing large files as multiple blocks which are replicated on multiple nodes to provide reliability. The scale of location and sensor data is so large that it is not possible to fit the data on a single machine’s disk. HDFS not only provides reliable storage for large amount of data but also allows parallel processing of data on machines in a cluster.
3.3. Ease of Programming
Programming models used by cloud-based distributed batch processing infrastructures such as Hadoop allow parallel processing of data. For example, with Hadoop, the location and sensor data analysis algorithms can be implemented as MapReduce jobs. Scaling out the computation on a large number of machines in a cluster is simple with Hadoop. The same computation that runs on a single machine can be scaled to a cluster of machines with few configuration changes in the program.
3.4. Flexibility in Data Analysis
Cloud-based distributed batch processing infrastructure such as Hadoop allows scaling the data analysis jobs up or down very easily which makes analysis flexible. With this flexibility in data analysis jobs, the frequency of analysis jobs can be varied.
4. Proposed Cloud-Based IT Framework
Figure 3 shows the proposed system architecture for real-time fresh food supply tracking and monitoring. The major hardware and software components of the proposed system architecture are described as follows:
1) Sensor Node: Sensor nodes are deployed in the container carrying food for monitoring temperature, humidity, etc.
2) Master Node: Master Node collects sensor data from the sensor nodes in the container and transmits the data to the Android Device using a USB or Bluetooth interface.
3) Android Device: An Android operating system based mobile device is used for capturing the sensor data collected by the Master Node, capturing GPS location data using an in-built GPS sensor and transmitting the data over a Wireless Wide Area Network (WWAN) to the data center.
4) Communication Infrastructure: The Android devices use cellular network technologies such as WIMAX, GPRS, EDGE, 3G, etc provided by a wireless service provider which have nationwide or even global coverage.
5) Cloud Based Data Organization and Analysis Infrasctructure: The data transmitted by the Android devices deployed in vehicles is collected and organized in a computing cloud. The proposed CloudTrack framework is used for data organization and analysis.
Figure 4 shows the architecture of the CloudTrack framework for real-time fresh food supply tracking and monitoring. CloudTrack is based on Hadoop [15] which is a framework for running applications on large clusters built of commodity hardware. Hadoop comprises of two major components:
1) Hadoop Distributed File System (HDFS): HDFS stores files across a collection of nodes in a cluster. Large files are split into blocks (64 MB by default) and each block is written to multiple nodes (default is three) for fault-tolerance [15].
2) MapReduce: MapReduce is a parallel data processing model which has two phases: Map and Reduce. In the Map phase, data is read from a distributed file system (such as HDFS), partitioned among a set of computing nodes in the cluster, and sent to the nodes as a set of key-value pairs. The Map tasks process the input records independent of each other and produce intermediate results as key-value pairs. The intermediate results are stored on the local disk of the node running the Map task. When all the Map tasks are completed, the Reduce phase begins in which the intermediate data with the same key
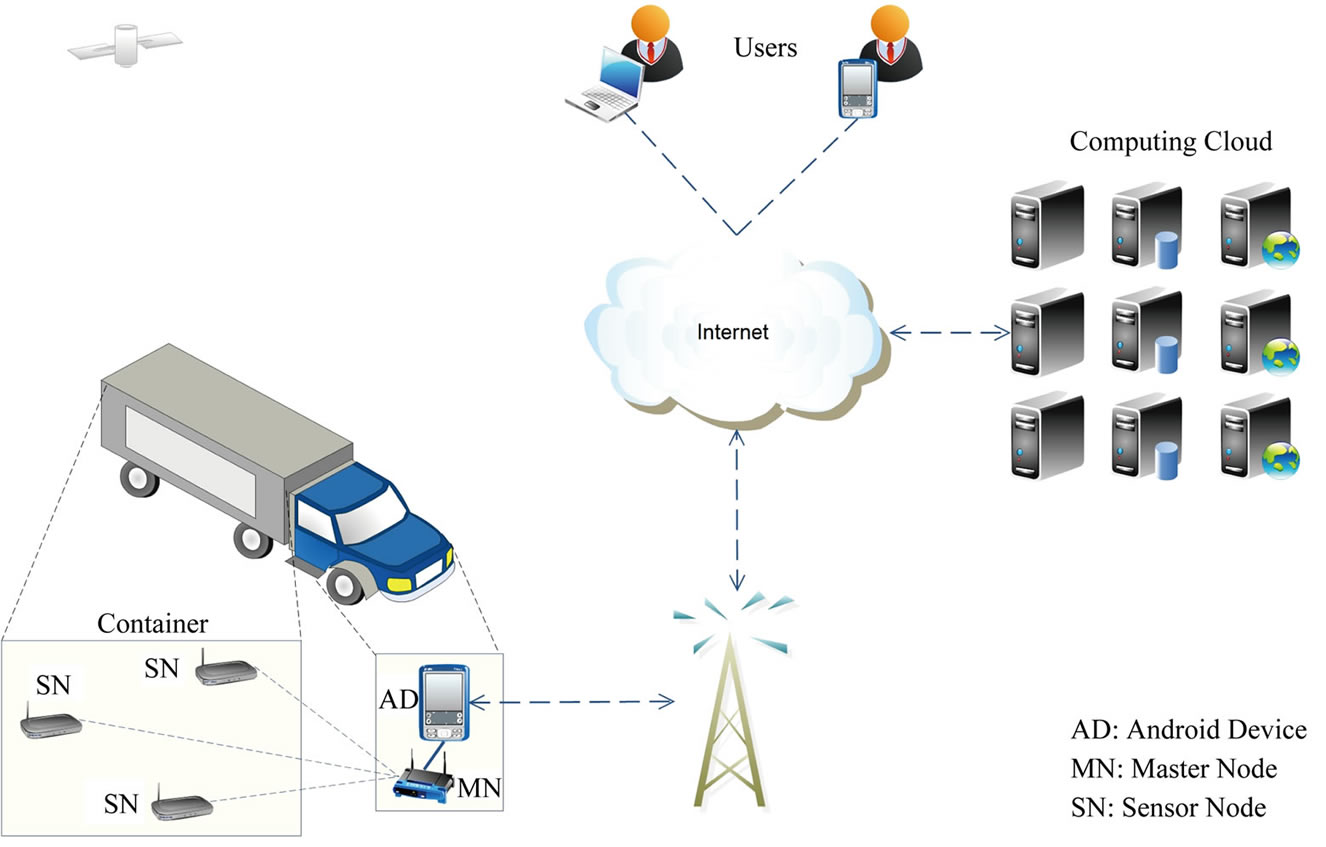
Figure 3. Proposed system architecture for real-time fresh food supply tracking and monitoring.
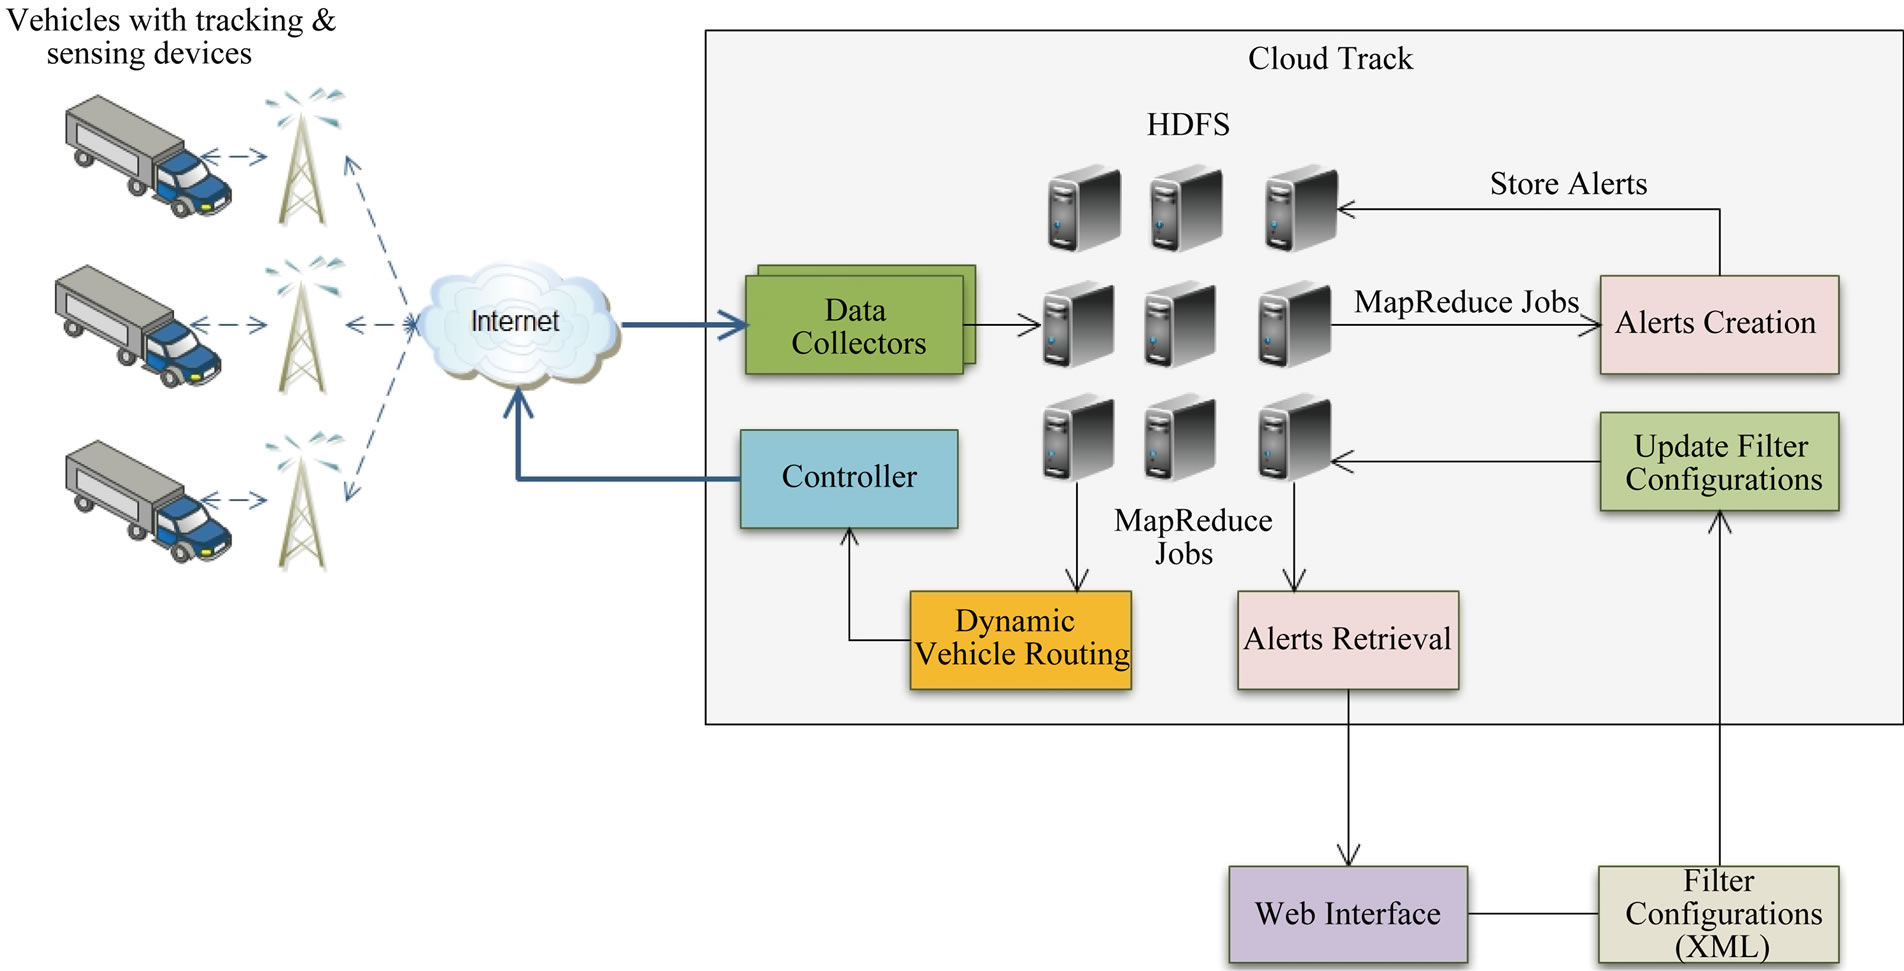
Figure 4. Proposed framework for real-time data organization and analysis in a computing cloud-CloudTrack.
is aggregated.
4.1. Data Collectors
The Data Collectors in the CloudTrack framework collect the streaming time-series data from the master nodes in the vehicles. Each incoming data stream is mapped to one of the Data Collector nodes as shown in Figure 4. Each Data collector node has a Data Aggregator, Data Filter and Data Archiver module. Since the raw location and sensor data comes from a large number of vehicles in the form of data streams, the data has to be preprocessed to make the data analysis using Hadoop more efficient. The Hadoop MapReduce data processing model works more efficiently with a small number of large files rather than a large number of small files. The Data Collectors buffer, preprocess and filter the streaming data into larger chunks (called Sequence Files) and store it in HDFS. Data Collectors use Hadoop’s Sequence File class which provides a persistent data structure and serves as a container for multiple records. Since HDFS and MapReduce are optimized for processing large files, packing records into a Sequence File makes processing of data more efficient. The Data Aggregator aggregates streams of location and sensor data into Unstructured-Sequence Files on the local disk of the Data Collector node. The Data Filter converts the Unstructured-Sequence Files into structured records by parsing the records (lines) in UnstructuredSequence Files and extracting the sensor readings. The Data Filter also filters out bad records in which some sensor readings are missing. The Data Archiver moves the Structured Records to HDFS.
4.2. Alerts Creation Module
The data collected is processed to generate alerts based on the user specified filters for alerts creation. This Alerts Creation Module collects the alerts into an alertsbase (alerts database) which is organized into a manageable structure in HDFS. Real-time alerts are created using the real-time location and sensor data collected in a small time window. Offline alerts can also be created from the past location and sensor data.
4.3. Alerts Retrieval Module
The Alerts Retrieval Module retrieves the alerts for displaying them in the CloudTrack dashboard. The user can search for a particular vehicle by vehicle number, vehicle type, arrival or departure locations. The Alerts Retrieval Module then retrieves the alerts for that particular vehiclefrom the alerts-base.
4.4. Controller
The Controller module sends the new routes generated by the Dynamic Scheduler to all the vehicles. Alternatively, the vehicles can also pull the new routes and additional information on the nearby vehicles from the controller.
4.5. Dynamic Vehicle Routing Module
The Dynamic Vehicle Routing Module generates routes for the vehicles based on the real-time data collected in order to minimize the spoilage of fresh food. Deviations in the planned schedule occur due to changing traffic conditions. Moreover, there may be changes in the container conditions such as an increase in temperature due to a fault in the cooling system, etc. With CloudTrack it is possible to have a global view of all the vehicles in transit. The Dynamic Vehicle Routing Module creates new routes for the vehicles when alerts occur. For example, a vehicle that is bound to miss the deadline for a scheduled destination and has a limited time window left before the spoilage of food starts, can be re-routed to a closer destination. The knowledge about the state variables of the vehicle (such as truck capacity, location, speed, container temperature, etc.) and the vehicles nearby is important for creation of new routes. The routes are generated to minimize the food spoilage and the costs involved in transportation. Savings come due to sharing of transportation costs on common routes by better utilization of vehicles and better re-routing of vehicles in the event of delays.
Instead of proposing new algorithms for vehicle routing (which is an established area of research within transportation systems), our effort behind CloudTrack is to provide a cloud-based framework that supports a wide variety of vehicle routing algorithms within a cloud architecture. We now describe a typical use case of dynamic vehicle routing. We have used Tabu Search [16] algorithm for the use case. CloudTrack is flexible to support other dynamic routing algorithm as well. For the use case we have chosen Tabu Search as it has been applied widely for various types of optimization problems, with very good results.
Figure 5 shows an example of food supply vehicle routing. The routing problem involves a set of food supply pickup points (shown as sources) and the delivery points (shown as destinations). The sources can be either collection centers for fresh food produce or warehouses where food is temporarily stored before distribution. The destinations can be either retail stores where fresh food is sold or warehouses where the food is kept refrigerated before it is transported to other locations. The problem described in this section involves a number of vehicles which can start and end their routes at different locations. The number of routes in the problem is equal to the number of vehicles. Each vehicle has a limited capacity and can serve a limited number of delivery points. An initial schedule is obtained such that each delivery point is visited only once by one of the vehicles. The CloudTrack framework is used to monitor the real-time data captured from all the vehicles and the vehicle routes are updated if there are changes in conditions that can lead to spoilage of food supply during transit.
Figure 6 shows an example of a dynamic schedule which is generated after analysis of real-time data from the vehicles. The example shows a scenario where the vehicle on route-1 generates an alert for a delayed deliv-
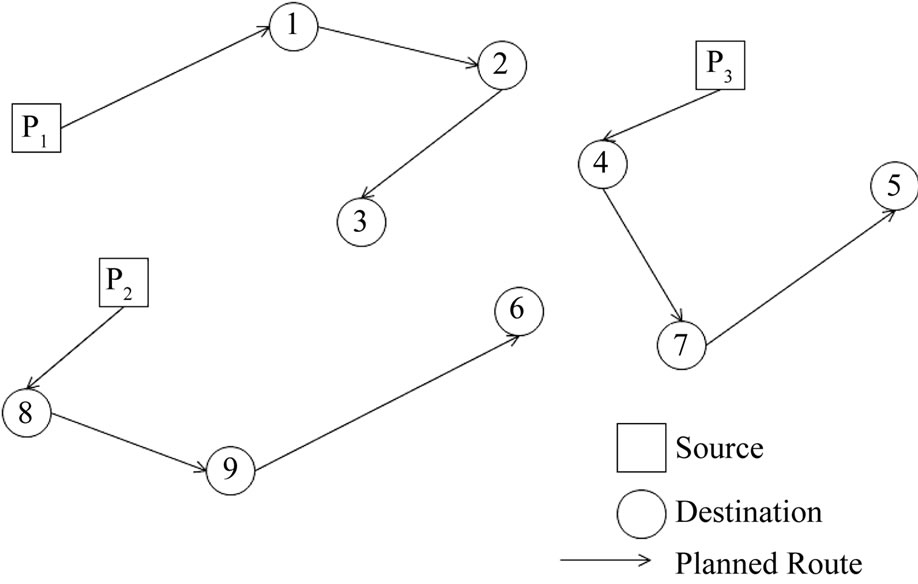
Figure 5. Example of an initial schedule.
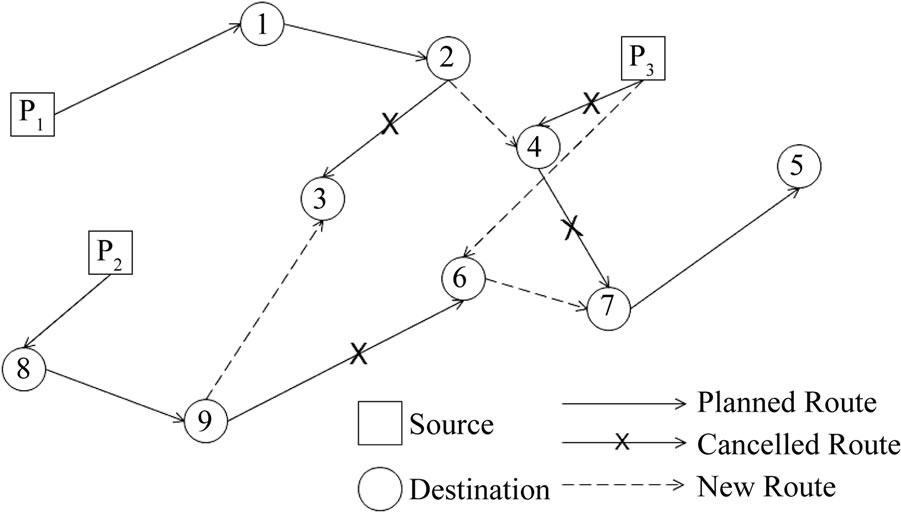
Figure 6. Modified schedule based on real-time alerts.
ery to destination-3. This alert triggers the creation of a new routes in which the vehicle-1 is re-routed to destination-4, vehicle-2 is re-routed to destination-3 and vehicle-3 is re-routed to destination-6.
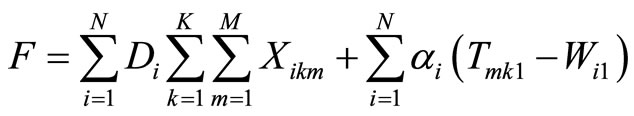
We now describe the mathematical model for the vehicle routing problem shown in Figure 5. Figure 7 shows the time sequence of a route. The parameters involved in the model are as follows:
N is the total number of destinations, K is the number of vehicles, M is the maximum number of destinations that can be served by a vehicle on one route, Di is the time taken to travel from source to destination-i, Tmk0 is the start time of the mth trip of vehicle k, Tmk1 is the reaching time at the destination for the mth trip of vehicle k, Tmk2 is the end time of the mth trip of vehicle k, Si is the handling time at destination-i, Ri is the time window for delivery at the destination-i, Wi0 is the start time of the time window at destination-i and Wi1 is the end time of the time window at destination-i. Xikm  {0,1} is the decision variable where i
  {1, …, N}, k
  {1, ..., K}, m
  {1, ..., M}. Xikm = 1 if destination-i is served by vehicle k on its mth trip and 0 otherwise. The objective function that represents the total cost of transporting the food supply is defined as follows:
 (1)
(1)
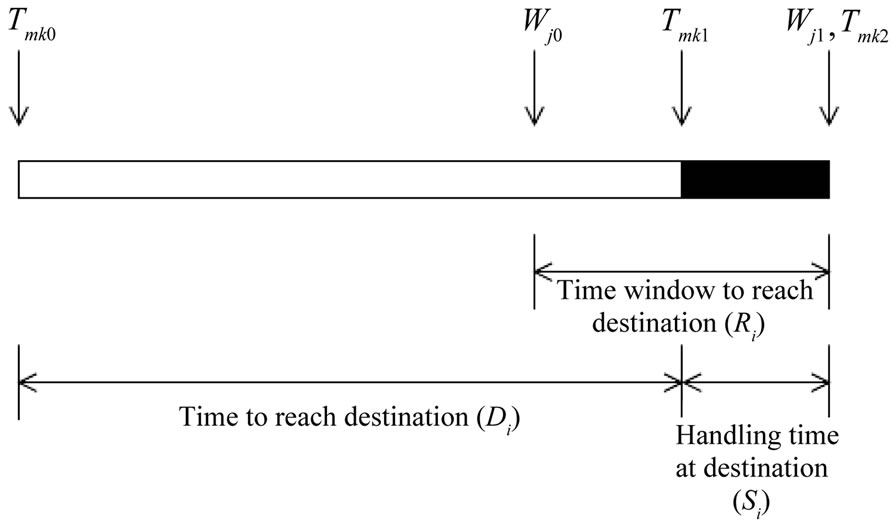
Figure 7. Time sequence of a route.
where αi is lateness penalty coefficient associated with destination-i. The objective function involves the transportation cost from the source to the destination and the penalty due to late delivery at the destination. For the use case, to minimize the objective function given the constraints as described in the mathematical model, we adopt a meta-heuristic approach called Tabu Search [16].
The solution obtained by minimizing the objective function is a schedule specifying the routes for each vehicle and the sequence of the destinations to be served. Tabu search is a memory based meta-heuristic method that uses a memory structure called tabu list to store the recent moves or solutions. During the search process, attempts that produce the moves or solutions in the tabu list are denied. The moves or solutions in the tabu list can be overrided sometimes, when an aspiration criteria is satisfied which produces a globally best solution. To obtain an initial solution we adopt the Push Forward Insertion Heuristic (PFIH) described by Solomon [17]. The algorithm for generating initial solution based on Push Forward Insertion Heuristic (PFIH) is shown in Table 2.
The Tabu Search process proceeds by a sequence of intensifications and diversifications. Intensification is a strategy that aims at a detailed exploration of the neighborhood of the solutions that are historically found to be good. Whereas, diversification is a strategy that aims at driving the search into new regions. After obtaining an initial solution, it is intensified using a λ-interchange local search method introduced by Thangiah et al. [18]. The algorithm for vehicle routing based on Tabu Search [16] is described in Table 3.
The algorithm for dynamic vehicle routing which is used in the use case, is described in Table 4. A vehicle routing algorithm such as tabu search is used to obtain an initial static schedule. Whenever a new alert occurs, a new schedule is generated based on the current locations and the existing filled capacities of the vehicles. If a feasible solution is found, the new schedule is pushed to all the vehicles by the Controller module. If no feasible solution is found, a local fix is obtained for the vehicle that generated the alert. For example, a local fix can be re-
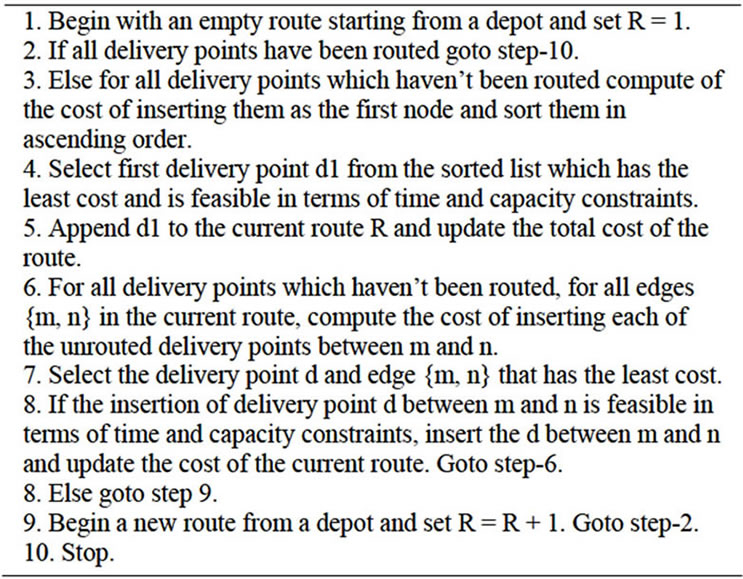
Table 2. Algorithm for generating initial solution based on PFIH [17].
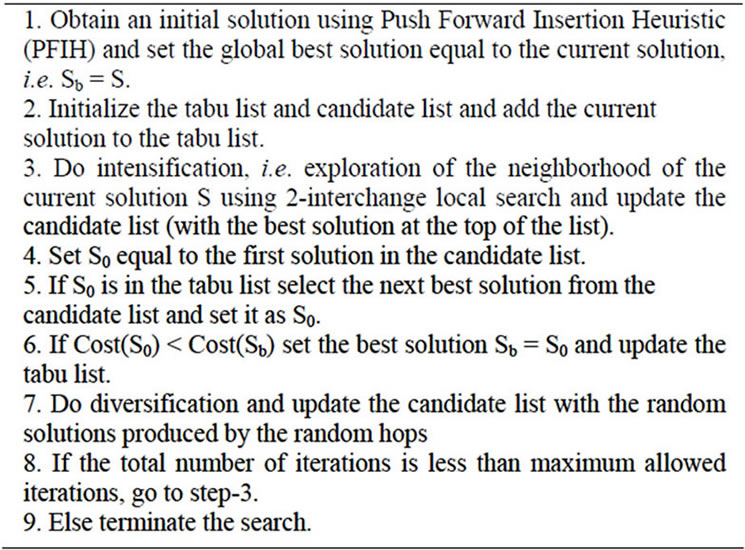
Table 3. Algorithm for vehicle routing based on Tabu Search [16].
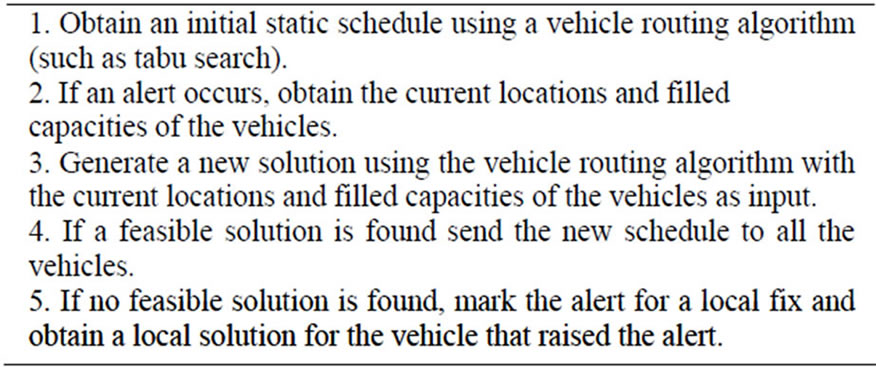
Table 4. Algorithm for dynamic vehicle routing.
routing the vehicle to the nearest delivery point such as a retail store or warehouse which is not on the planned route of other vehicles.
4.6. CloudTrack Dashboard
Figure 8 shows a screenshot of the CloudTrack Dashboard that is used to visualize the tracking and monitoring data for a particular vehicle. The dashboard has wid-
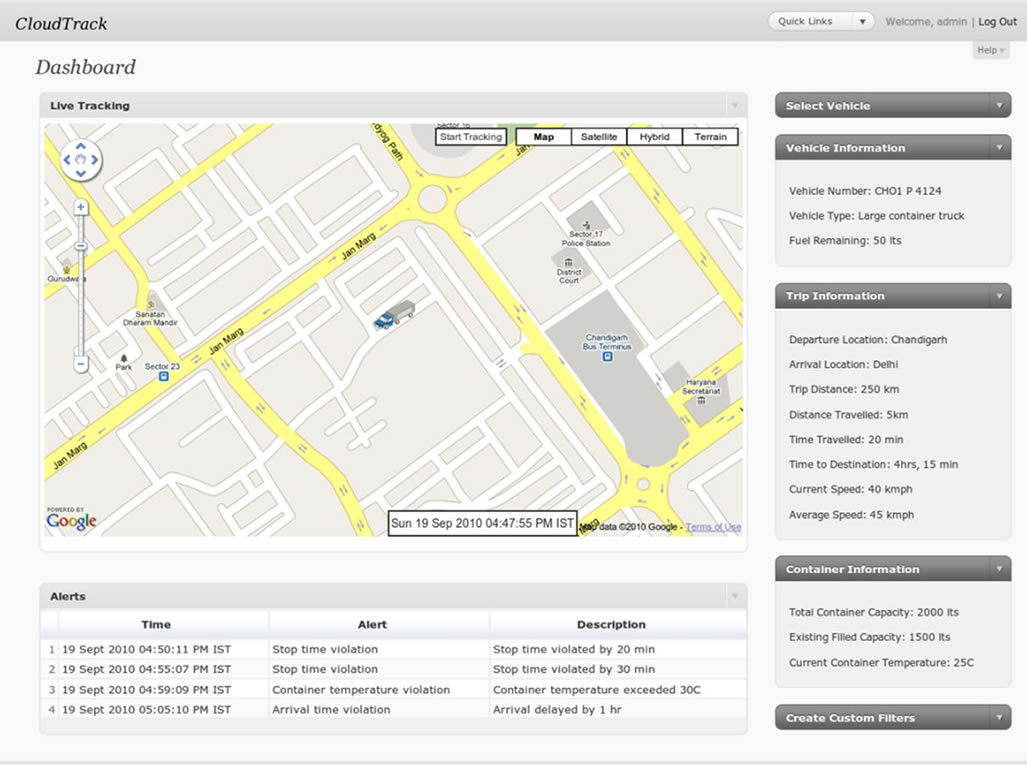
Figure 8. Screenshot of CloudTrack dashboard.
gets for displaying the following information: 1) vehicle information, such as vehicle number, vehicle type, etc.; 2) trip information such as departure and arrival locations, trip distance, distance and time traveled, time to destination, current and average speeds, etc.; 3) container information such as total container capacity, existing filled capacity, container temperature and humidity, etc. The dashboard also allows creation of custom filters for alerts.
5. Evaluation
To model the data collection architecture of CloudTrack, we developed a prototype system that used an Arduino Uno development board, Sensirion SHT21 temperature and humidity sensor, and an Android OS based mobile device. On the Android device an application was written to read in the sensor readings. A service within the application captures the sensor data from the Arduino board and pushes the sensor data along with the GPS data obtained from the Android device to CloudTrack. Using the empirical data collected from the prototype system a model for a food truck was developed. This model was then used to generate a large number of virtual trucks using a data generator from which synthetic data was generated. A large data set (for upto 1000 delivery points and 100 vehicles) was generated synthetically, which allowed us to validate the scalability, flexibility and control mechanism of CloudTrack.
In order to evaluate the scalability of the proposed CloudTrack framework, we performed a series of experiments with varying number of delivery points and vehicles, using the Amazon Elastic Compute Cloud (EC2) infrastructure [19]. For simplicity in describing Cloud Track’s multi-tier deployment configuration we use the naming convention-(#L (size)/#A (size)/#H (size)), where #L is the number of instances running load balancers and web servers, #A is the number of instances running application servers, #H is the number of instances running the Hadoop cluster and (size) is the size of an instance. Figure 9 shows comparisons of alerts creation times for varying number of records on varying hardware configurations (Amazon EC2 compute units). Each compute unit provides an equivalent CPU capacity of 1.0 - 1.2 GHz 2007 Opteron processor or 2007 Xeon processor. We observe that even with a large number of vehicles and records, the alerts can be created in a time-scale of few seconds to minutes.
With Hadoop it is possible to analyze such massive scale data efficiently. We also observed that when the amount of data to be analyzed is small, the Hadoop’s non-significant startup costs dominate the execution time.
However as the amount of data to be processed increases the startup costs are dwarfed by the execution time. For analysis of 1,000,000 records with CloudTrack, experimental measurements show a speed up of upto 4 times using a computing cluster (with 33.5 EC2 compute units) as compared to a single node (with 1EC2 compute unit). From the results in Figure 9 it is observed that CloudTrack is well suited for massive scale vehicle location and sensor data processing. For example, if the location and sensor readings are collected from 100 vehicles every 5 seconds then 1 million records correspond to approximately 14 hours of data. Figure 10 shows the comparisons of vehicle route generation times for varying number of delivery points and vehicles on varying
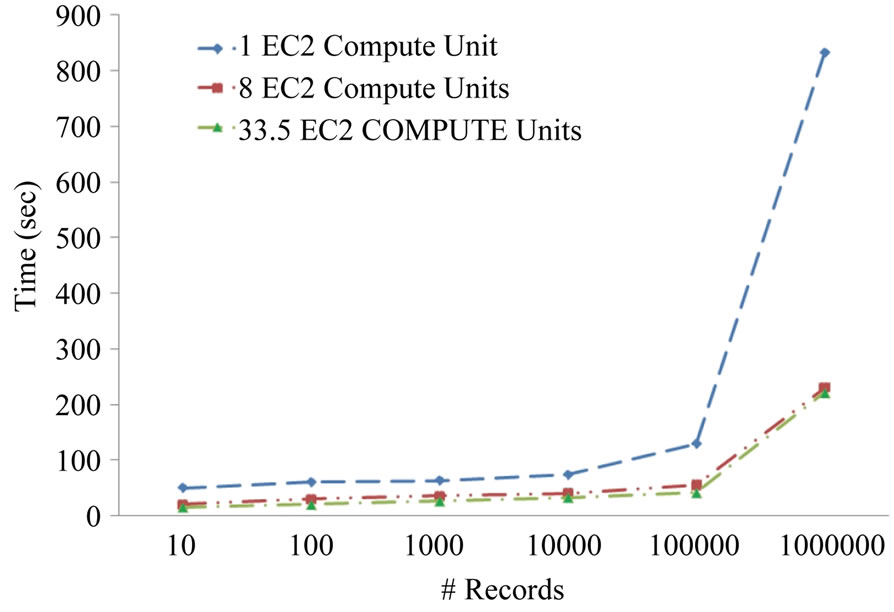
Figure 9. Comparisons of alerts creation times for varying number of records on varying hardware configurations.
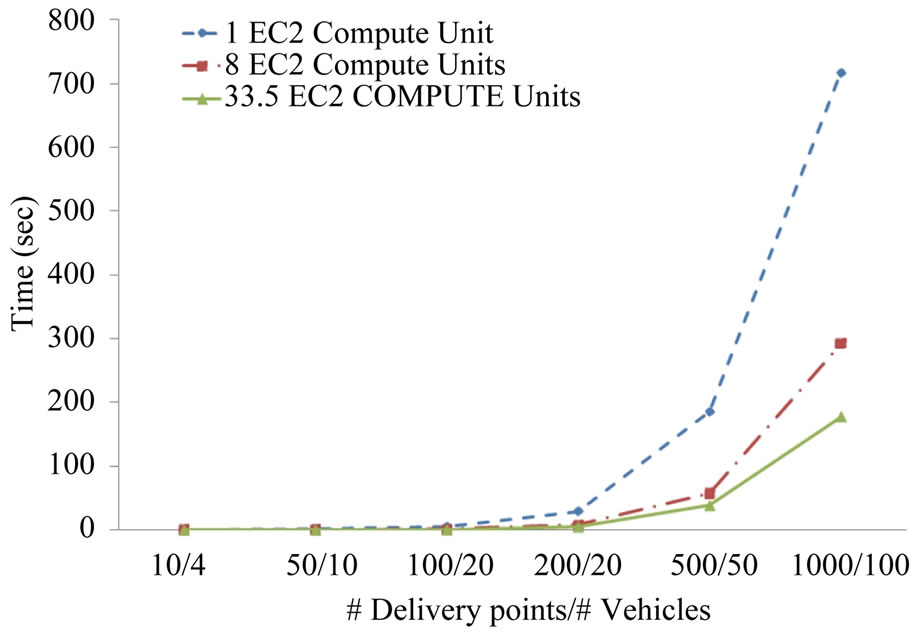
Figure 10. Comparisons of vehicle route generation times for varying number of delivery points and vehicles on varying hardware configurations.
hardware configurations. From the results in Figure 10 we observe that CloudTrack can generate vehicle routes on timescale of few seconds to minutes. Furthermore, from the results in Figures 9 and 10, it is observed that the CloudTrack framework can be scaled up by adding additional computing resources. Figure 11 shows the relative costs of the vehicle routing solutions generated by the CloudTrack’s vehicle routing module at different iterations. The costs shown in the plot have been normalized with the cost of the final solution. These costs are calculated using Equation (1). For simplicity, we choose Di in Equation (1) to be the distance from source to destination-i. Normalization of costs is done by dividing the cost of a solution with the cost of the final solution. From the results in Figure 11 it is observed that the relative costs of the solutions decrease in each successive iteration as the vehicle routing algorithm progresses.
Figure 12 shows the average throughput for the CloudTrack dashboard for three different deployment configurations. We observe that throughput continuously increases as the number of tracked vehicles increase. With increase in number of vehicles CloudTrack services higher number of requests per second, therefore an increase in throughput is observed. Beyond 1600 vehicles, we observe a decrease in throughput, which is due to the high utilization of the resources (CPU, Disk I/O, etc.) for the web or application tiers of the CloudTrack deployment. Figure 12 also demonstrates the vertical and horizontal scaling options of CloudTrack. Comparing (1L(small)/2A(small)/2H(large)) and (1L(small)/2A(large)/2H(large)) deployments, we observe that by vertical scaling (increasing the compute capacity of application servers from small to large) a higher throughput is achieved. Similarly comparing deployments (1L(small)/2A(small)/2H(large)) and (1L(small)/3A(small)/2H(large)), we observe that by horizontal scaling (increasing the number of application servers), a higher throughput is achieved. Additional computing resources can be provisioned for larger number of vehicles, depending on the scale of the problem. Figure 13 shows the average response time for the CloudTrack dashboard for three different configurations. With increase in number of vehicles the mean request arrival rate increases since CloudTrack services higher number of requests per second, therefore an increase in response time is observed. Figure 13 also demonstrates the vertical and horizontal scaling options of CloudTrack. Comparing the three different deployment configurations of CloudTrack we observe that lower response times are achieved by vertical and horizontal scaling.
To sum up, the experiments done using 1) the prototype system for sensor and location data collection; 2) virtual vehicle model developed using empirical data collected from the prototype system; 3) synthetic data generated using the virtual vehicle model and a data generator, were able to test the complete CloudTrack architecture including data collection, data analysis for alerts creation and dynamic route generation.
6. Conclusion
In this paper, we propose a cloud-based framework, CloudTrack, and provide a case study of how the IT infrastructure may be efficiently integrated into the supply chain and operational systems. We demonstrated the feasibility of CloudTrack as a scalable platform for data driven intelligent transportation systems, based on new cloud-based programming models and data structures, Hadoop and MapReduce. The fresh food supply vehicles are equipped with Sensor Nodes, a Master Node and an Android Device to collect and transmit real-time location and sensor data. A distributed batch processing infrastructure, Hadoop, is used for running data analysis jobs on clusters of machines. Data analysis jobs are formulated using Hadoop MapReduce programming model,
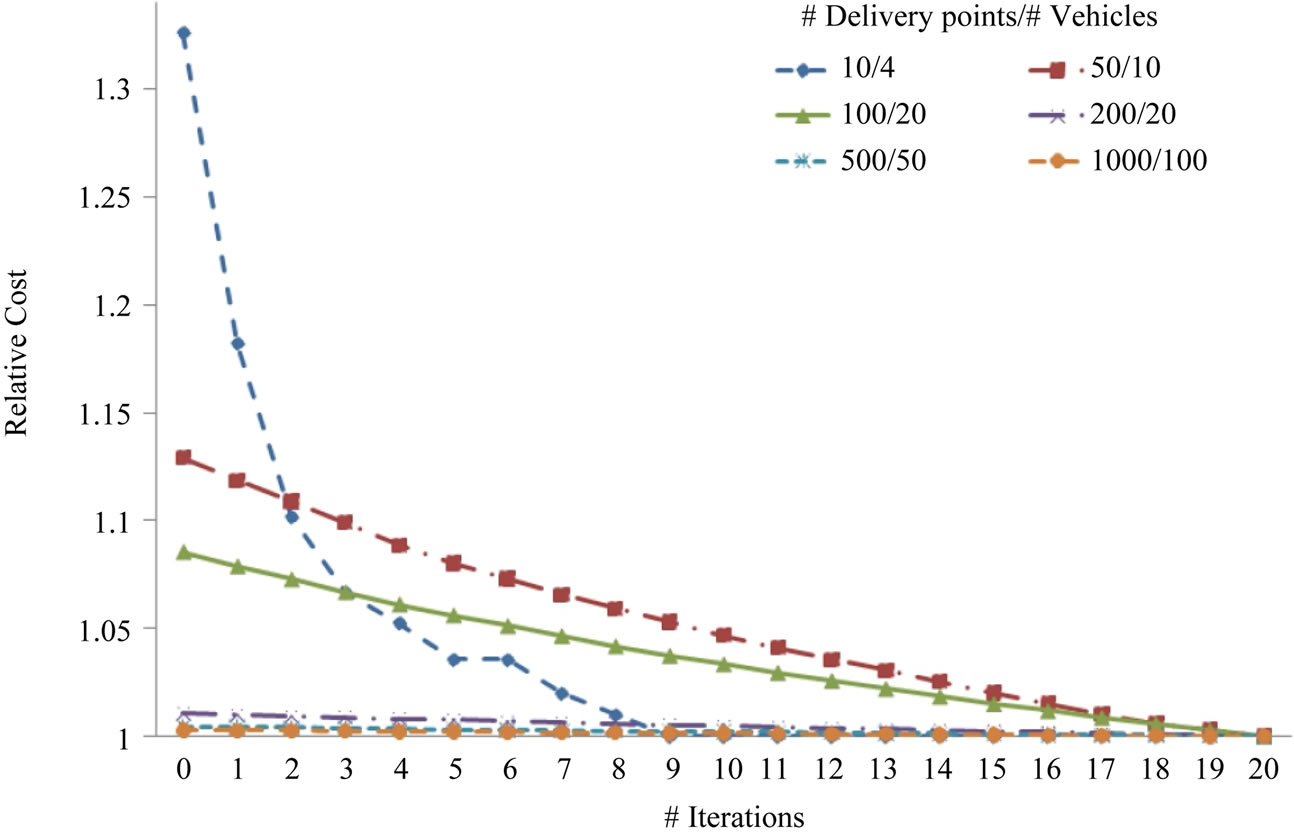
Figure 11. Relative total cost of generated routes. Tabu search algorithm was used for experimental evaluation.
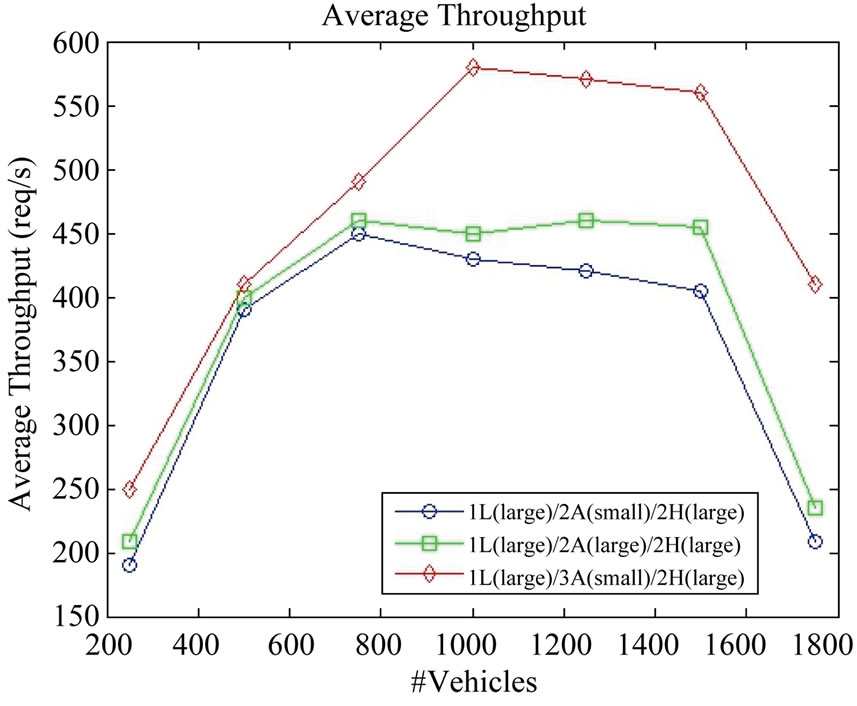
Figure 12. Average throughput for CloudTrack dashboard for different deployment configurations.
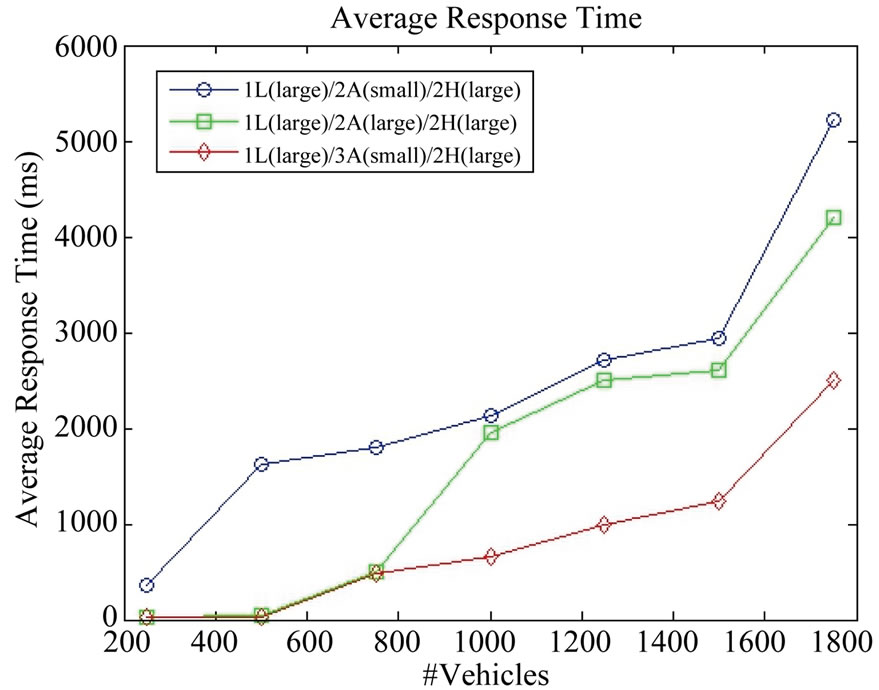
Figure 13. Average response time for CloudTrack dashboard for different deployment configurations.
which allows jobs to be run in parallel. Experimental measurements showed that the MapReduce implementation can create alerts on a timescale of few seconds to minutes on the cloud. Moreover, upon the creation of alerts, new vehicle routes can be generated in a timescale of few seconds to minutes. With the proposed approach the spoilage of fresh food during transit can be reduced due to better re-routing of vehicles based on the real-time information.
REFERENCES
- J. Zhang, F. Wang, K. Wang, W. Lin, X. Xu and C. Chen, “Data-Driven Intelligent Transportation Systems: A Survey,” IEEE Transactions on Intelligent Transportation Systems, Vol. 12, No. 4, 2011, pp. 1624-1639. doi:10.1109/TITS.2011.2158001
- R. Claes, T. Holvoet and D. Weyns, “A Decentralized Approach for Anticipatory Vehicle Routing Using Delegate Multiagent Systems,” IEEE Transactions on Intelligent Transportation Systems, Vol. 12 No. 2, 2011, pp. 364-373. doi:10.1109/TITS.2011.2105867
- D. A. Steil, J. R. Pate, N. A. Kraft, R. K. Smith, B. Dixon, L. Ding and A. Parrish, “Patrol Routing Expression, Execution, Evaluation, and Engagement,” IEEE Transactions on Intelligent Transportation Systems, Vol. 12 No. 1, 2011, pp. 58-72.
- E. Schmitt and H. Jula, “Vehicle Route Guidance Systems: Classification and Comparison,” Proceedings of IEEE ITSC, Toronto, 2006, pp. 242-247.
- M. T. Nkosi, “Cloud Computing for Enhanced Mobile Health Applications,” IEEE Second International Conference on Cloud Computing Technology and Science (CloudCom), Indianapolis, 30 November-3 December 2010.
- M. A. H. Masud, “Cloud Computing for Higher Education: A Roadmap,” IEEE 16th International Conference on Computer Supported Cooperative Work in Design (CSCWD), Wuhan, 23-25 May 2012.
- X. Fang, S. Misra, G. L. Xue and D. J. Yang, “Managing Smart Grid Information in the Cloud: Opportunities, Model, and Applications,” IEEE Network, Vol. 26, No. 4, 2012, pp. 32-38. doi:10.1109/MNET.2012.6246750
- Z. J. Li, “Cloud Computing for Agent-Based Urban Transportation Systems,” IEEE Intelligent Systems, Vol. 26, No. 1, 2011, pp. 73-79.
- P. Jaworski, “Cloud Computing Concept for Intelligent Transportation Systems,” 14th International IEEE Conference on Intelligent Transportation Systems (ITSC), Washington DC, 5-7 October 2011.
- A. Bahga and V. K. Madisetti, “Analyzing Massive Machine Maintenance Data in a Computing Cloud,” IEEE Transactions on Parallel & Distributed Systems, Vol. 23, No. 10, 2012, pp. 1831-1843. doi:10.1109/TPDS.2011.306
- Department of Scientific & Industrial Research, “Fruits & Vegetables Sector: An Overview,” Department of Scientific & Industrial Research Report, India, 2011.
- Z. B. Pang, J. Chen, Z. Zhang, Q. Chen and L. R. Zheng, “Global Fresh Food Tracking Service Enabled by Wide Area Wireless Sensor Network,” IEEE Sensors Applications Symposium (SAS), Limerick, 23-25 February 2010. doi:10.1109/SAS.2010.5439425
- Y. Xi, W. Yang, N. Yamauchi, Y. Miyazaki, N. Baba and H. Ikeda, “Real-Time Data Acquisition and Processing in a Miniature Wireless Monitoring System for Strawberry during Transportation,” TENCON, Hong Kong, 2006, pp. 1-4.
- Y. L. Bu and L. Wang, “Leveraging Cloud Computing to Enhance Supply Chain Management in Automobile Industry,” International Conference on Business Computing and Global Informatization, Shanghai, 29-31 July 2011. doi:10.1109/BCGIn.2011.45
- Apache Hadoop. http://hadoop.apache.org
- F. Glover, “Tabu Search Part I,” ORSA Journal on Computing, 1989.
- M. M. Solomon, “Algorithms for the Vehicle Routing and Scheduling Problems with Time Window Constraints,” Operations Research, Vol. 35, No. 2, 1987, pp. 254-265.
- S. R. Thangiah, I. H. Osman, R. Vinayagamoorthy and T. Sun, “Algorithms for the Vehicle Routing Problems with Time Deadlines,” American Journal of Mathematical and Management Sciences, Vol. 13, No. 3-4, 1993, pp. 323-355.
- http://aws.amazon.com/ec2/instance-types