Agricultural Sciences
Vol.10 No.06(2019), Article ID:93050,26 pages
10.4236/as.2019.106057
Optimizing Aircraft Utilization for Herbicide Application by Evaluation of Herbicide Spray Drift in West Bank Berbice Guyana South America
Ramphal Chablall1, Ravindra Persaud1, Raghunath Chandranauth2, Simon Chibi3, Gavindra Ramnarain1, Suresh Amichand4, Courtney Bullen5
1Guyana Sugar Corporation, Georgetown, Guyana
2National Agricultural Research and Extension Institute, Georgetown, Guyana
3Cuso International, National Agricultural Research and Extension Institute, Georgetown, Guyana
4Pesticides and Toxic Chemicals Control Board, Georgetown, Guyana
5Faculty of Agriculture and Forestry, University of Guyana, Georgetown, Guyana

Copyright © 2019 by author(s) and Scientific Research Publishing Inc.
This work is licensed under the Creative Commons Attribution International License (CC BY 4.0).
http://creativecommons.org/licenses/by/4.0/


Received: April 4, 2019; Accepted: June 14, 2019; Published: June 17, 2019
ABSTRACT
Aerial herbicide drift caused mainly by weather and climatic conditions may be the most challenging problem facing farmers. Spray drift reaching off-target areas can destroy sensitive crops; pollute air and water resources thus causing serious health problems to humans and animals. Nonetheless, buffer zones of 500 meters are indicated to limit these negative impacts of spray drift. The Guyana Sugar Corporation controls weeds and ripens canes by aerial herbicide application. The corporation, in the 1990s, instituted 750-metre buffer zones, which greatly affected the optimization of aircraft use in herbicide application and ripening of cane. This study tested the utility of the 750-meters buffer zone on Rose Hall, Albion and Blairmont Sugar estates. The actual drift distances were determined within 06:00 hours and 09:00 hours for 9 herbicide applications. Drift patterns associated with the three 1- hour time periods were correlated with prevailing weather conditions to determine optimal flying periods for the locations. The droplets concentration per sensitive paper was collected for each period. It was noted that the drift is less with the distance from the field up to 510 m; thereafter the number of droplets was 2 or less per sensitive paper. The wind speed increases as time goes up, thus increasing the drift. The windward side is where 510 m were recorded to have droplets of 2 and nil at 510 m from the opposite side.
Keywords:
Herbicide, Aircraft, Drift, Buffer Zones, Sensitive Paper

1. Introduction
Since the 1960s application of agrochemicals by aircraft has been an important operation in the production of sugar by Guyana Sugar Corporation (GuySuCo). The corporation’s main objective is to achieve set targets on a timely basis and achieve best results at minimum costs. The Corporation is committed to ensure that this operation is always conducted safely. However, there have been many cases where neighbouring residents and cash crop farmers alleged incidences of spray drift affecting them and their crops. Because of such sensitive issues, GuySuCo instituted guidelines on all estates for the safe use and handling of agrochemicals, which are covered in the [1] publication “The Safe Use and Handling of Pesticides and Guidelines for Aerial Application of Agrochemicals”.
Pesticide application in [1] is limited to the use of less hazardous herbicides and this is done manually and by aircraft. Insecticides are more toxic forms of pesticides and application of these stopped since 1994. The corporation carefully reviewed aerial application of herbicides and instituted buffer zones (no-fly zones) on all estates to avoid spray drift contamination of off-targets areas [2].
Herbicide spray drift is the movement of herbicide droplets through the air during application or soon after, to non-target areas [3]. Spray nozzles engender spray droplets. These droplets are taken to non-target areas by several factors including climatic and environmental conditions. Complete elimination of spray drift is impossible [4]. Nonetheless, drift-related problems can be reduced greatly by applying herbicides with, the recommended equipment and under the most favourable climatic conditions.
Herbicide drift reaching non-target zones is considered the most challenging problem facing both commercial and private companies that apply herbicides [4]. Factors that may affect spray drift, in particular, are volatility of the chemical formulation for e.g. esters (very volatile), equipment and application techniques, droplet size, weather and climatic condition mainly wind speed and direction, temperature, and relative humidity [3].
Spray drift can cause extensive damage to susceptible off-target areas by destroying sensitive crops and under-application of chemicals on target areas, resulting in ineffective control.
Pollution of air and water resources and health hazards to human and animal can be also caused by drift [5].
Drift occurs by particle and vapour drifts [5]. Particle size drift occurs just after application. This type is influence mainly by droplet sizes. Small droplets are more likely to drift farther than larger droplets. Droplet size is determined by the herbicide formulation, nozzle type, and pressure under which the herbicide is applied. On the other hand, vapour drift is caused by volatilization of the active ingredient (AI) in some chemicals such as, 2,4-D, Roundup, and Glyphosate. Application of these chemicals during high temperature would cause them to volatilize, evaporate and be transported to non-target zones.
Complete and uniform coverage of chemicals is most prudent in aerial application; smaller sized droplets may be most expedient to achieve the latter, since the size and distribution of target organisms may vary. However, smaller droplets are lighter in weight; thus, distance in drift will be greater than that of larger droplets [4]. After wind speed and direction, spray droplet size is the second most important factor affecting drift. Droplets with 150 and less microns in diameter are more prone to drift [4]. Sizes of 200 plus microns in diameter may not pose potential risks [4].
However, droplet sizes reaching 50 microns in diameter suspend in the air until environmental conditions are favourable to evaporate and pollute non-target zones. Spray drift or distances that spray droplets travel has been a problem for the past fifty years with the invention of pesticides [4].
Buffer zones reduce the risks of drift and its effects, hence GuySuCo in 1990 has instituted 750 meters buffer zones. These zones were determined, based on studies and reviews of international guidelines and buffer zones. This resulted in 46.4% no-fly zones on Rose Hall estate’s cultivation, 48.7% at Blairmont and 23.3% at Albion. These no-fly zones greatly affected the optimization of aircraft use in aerial fertilizer, herbicide and cane ripening application. Thus, this study intends to test the utility of the 750-meters buffer zone on Rose Hall, Albion and Blairmont Sugar estates. The actual drift distances will be determined within 0600 hours and 0900 hours for 9 herbicide applications. Drift patterns associated with the three 1-hour time periods will be correlated with prevailing weather conditions to determine optimal flying periods for the locations.
2. Problem Statement
The main problem is chemicals used in weed control have potential to kill many other unintended micro and macro organisms, plants and fisheries. The research established the extent to which drift moves and quantity that is deposited on the untargeted sites. Human life and activities will be done with caution within drift distances and where necessary shrink the target site for aircraft spray, while not compromising on efficient intended.
3. Justification
Because of reduced fly zones by the institution of 750 meters buffer zones, manual herbicide application is inevitable. Scarce manual labour, unfavourable weather conditions, reduced productivity levels, absenteeism and strike actions are eminent reasons for untimeliness of herbicide applications, thus affecting the effectiveness of herbicide programmes, incurring higher costs and possibly reduced yields. No-fly zones also affect the chemical ripening of sugarcanes, done by aerial application as well; this inevitably results in loss of revenue through reduced sugar recoveries.
3.1. General Objective
To optimize the utilization of aircraft for herbicide application.
3.2. Specific Objectives
• To determine the distances that herbicide spray drift travel when applied aerially between 6:00 hours and 9:00 hours.
• To determine at what distance herbicide spray drift concentrations are critical.
3.3. Research Questions
1) Does herbicide spray drift within the targeted times of application travel distances beyond the established buffer zones?
2) What are the distances at which drift concentrations become critical?
3.4. Hypotheses
Null 1
Spray drift within the targeted times of application does not travel distances beyond the established buffer zones.
Alternate 1
Spray drift within the targeted times of application travel distances beyond the established buffer zones.
Null 2
Spray drift concentrations are not critical at all distances reached.
Alternate 2
Spray drift concentrations are critical at all distances reached.
4. Literature Review
Studies and reviews of international guidelines on buffer zones indicated that 500 meters buffer zones are capable to limiting negative impacts of spray drift [1]. Rose Hall Estate is plagued with 46.4% of 6688.5 cultivation hectares, Blairmont Estate 48.7% of 5808.1 hectares and Albion Estate 23.3% of 9616.6 hectares as no-fly, as indicated in Table 1 and Figure 1. This adversely affects these estate’s aerial herbicide, cane ripening, and fertilizer programmes and the execution of other field operations [6].
GuySuCo’s aerial chemical programme caters only for the application of fertilizers for cane growth, herbicides for weed management and ripening of canes [1]. According to Dr. H. Davis, previous studies carried out by the corporation are the logical basis for these buffer zones. Proposed buffer zones were supported by results obtained from a study that was done in 2011 considering wind speed. He maintained that these proposed buffer zones are primarily based on buffer zones from other countries with the consideration of equipment and chemicals used [1].
Meteorological conditions such as wind, rain, and relative humidity are major factors that can affect aerial herbicide application, for the area as in map shown in Figure 2. The most important among the lot is wind, which greatly influences the time for applying herbicide aerially. Maximum wind speed for applying

Table 1. GuySuCo cultivation hectares, fly and no fly zones.
[2].
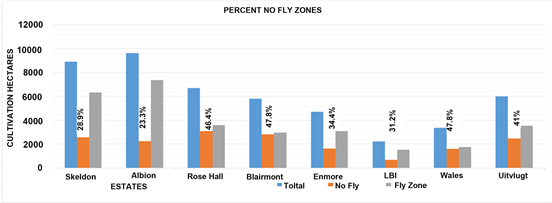
Figure 1. Percent no fly zones.

Figure 2. Map of Rose Hall Estate (example of no-fly zones).
herbicides aerially is 14 km/h or 8.7 mph [7]. Rain is detrimental where chemicals can reach non-target areas from high intensity rainfall causing runoff [7]. Increased evaporation is associated with low relative humidity. From sunrise to 9 or 10 hours, low relative humidity is uncommon, thus aerial herbicide application done at this time is less likely to be affected [7]. On the other hand aerial herbicide application should not be done with less than 40% relative humidity, since 40% to 60% is considered to be marginal and above 60% is considered as satisfactory [7].
Damage caused by drift may be at its lowest when wind speed is 3 to 7 miles per hour (4.8 - 11.2 kilometers per hour), thus, it becomes necessary to measure wind speed before and after application [8]. The risk of spray drift is very high if herbicide application is done in the presence of temperature inversion [8]. It is not advisable to spray when temperature is higher than 25˚C and relative humidity is lower than 40% [9].
Applying herbicide aerially is a broadcast method of application, thus smaller sized droplets are more effective in achieving uniform distribution of herbicide on the target organism (weed). The droplets sizes and corresponding numbers are as outlined in Table 2.
Wind speed and droplet sizes considered the most influential factors that can exacerbate drift, as displayed in Table 3.
On the other hand, an evaluation of aerial spray drift distances and concentrations can possibly result in a contraction of buffer zones and expansion of fly zones, safer and effective herbicide application programme, as alluded in Figure 3 and Figure 4, increase cane ripening and allowing progress of other field operations done simultaneously with herbicide application within the cultivation, as outlined in Table 4 and Figure 5.
Generally, optimizing the utilization of aircraft for herbicide application, and ultimately allowing for ripening of more canes, which can reduce production costs, achieve better yields and maximize net returns.
5. Methodology
5.1. Project Location
The project was done at Rose Hall Estate, East Canje, Berbice, Albion Estate, Corentyne Berbice and Blairmont Estate, West Bank Berbice Guyana South America, done as from February 2018 to August 2018.
Table 2. Small droplets coverage on target organism (weed leaf surface).
[10].
Table 3. Distances of droplet with varying sizes associated with different wind speeds.
[10].

Figure 3. Effects of wind speed [11].

Figure 4. Drift distances and droplet sizes [11].
5.2. Experimental Design
No formal experimental design was adopted since treatments were fixed and not randomized.
5.3. Treatment Design
v Three Blocks (Time—6 am to 7 am, 7 am to 8 am and 8 am to 9 am).
v Three replicates per block that is three aerial applications for each hour.
v Each application four points (East, West, North and South) tested.
Table 4. Unripening of no fly hectares and projected sugar loss.

Figure 5. Projected sugar loss because canes not ripened.
v Each point having 17 treatments (Distance-30 meters to 510 meters at equidistant).
v 3 blocks × 3 replicates (applications) = 9 applications.
v 9 application × 4 points = 36 points.
v 36 points × 17 treatments = 612 treatments.
v Each side = 153 treatments for all nine applications.
v Each side for each hour = 51 treatments for e.g. 6 am to 7 am = 3 south × 17 = 51.
5.4. Experimental Management
1) Experiment was done based on the Estate’s herbicide programme.
2) GuySuCo provided labour, aircraft, sensitive papers, dye and herbicides.
5.5. Chemicals, Materials and Equipment
Chemicals
2,4-D amine and Ally
2,4-D amine was tank mixed with Ally-Metsulfuron, Figure 6, at a dilution rate of 4.23 UG gallons of water. 2,4-D was used at an application of rate of 1.5
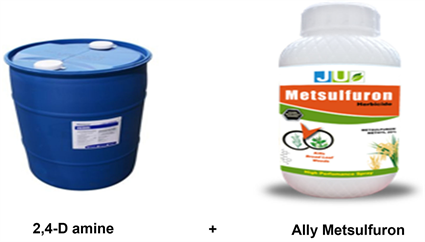
Figure 6. Herbicides.
liter per hectare in combination with Ally at a rate of 0.6 grams per hectare for controlling sedges and broadleaf weeds.
2,4-D is a Phenoxy and susceptible to drift depending on the formulation, ester for example are very volatile and can cause vapour drift that remain in the air as vapour for long periods and travel long distances. Unlike amine formulations for e.g., 2,4-D amine can only cause droplet drift, which is generally limited to relatively short distances of up to a few hundred metres. This distance can vary greatly, depending on the specific circumstances of the application.
Both, 2,4-D and Ally are systemic post emergence herbicides, that are selective to the sugar cane plant.
6. Materials
6.1. Levanyl Blau Dye
Levanyl Blau dye, Figure 7, was incorporated with the herbicide mixture at a rate of 0.04% volume-to-volume basis, for e.g. 1000 liters of water 40 liters of dye.
This dye aids in the detection of spray drift that is captured onto the sensitive paper. Spray drift is detected by blue spots caused by the dye which is expressed on the sensitive paper.
6.2. Water and Oil Sensitive Paper Is a Paper
Sensitive paper, Figure 8, was stapled onto 17 bamboo poles at equidistant of 30 meters starting at 30 meters away from the target area to 510 meters. This was done east, west, north and south of the target area.
The water and oil sensitive paper is a paper specially designed to be used as markers to detect spray drift. It reacts readily with water and oil once contact is made. It has a dimension of 1 inch × 3 inches (3 square inches) = 19.3548 cm2.
6.3. Aircraft and Equipment
Aircraft

Figure 7. Levanyl balu dye.
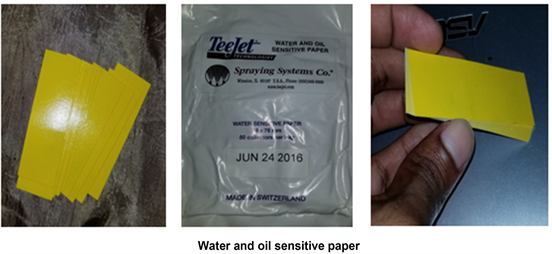
Figure 8. Dye and sensitive paper.
6.4. Satloc
The Satloc provides state-of-the-art GPS guidance for aerial applicators. Available with AirTrac™ guidance software, the Satloc allows one to fly and spray precise patterns using constant rate flow control. This reduces fuel, flying time, and application costs. The Satloc Bantam light bar guidance system features a real-time graphic moving map display, it provides visual guidance, and shows key features such as swaths sprayed, field boundaries, skips, overlaps, mark points, waypoints, acres applied, and polygons. The AirTrac software allows one to track acres applied and monitor application rates. The Satloc includes a 7-inch touch screen, CPU with 2 USB drives, 2 GB USB stick, A21 antenna, external light bar and 9” touch screen available.
The AU5000 “Micronair” atomizers in the aircraft have been adjusted to give us between 240 - 250 Microns VMD droplet size on eight of the units Figure 9 and Table 5. In addition, the outer most atomizer units on each wing have been adjusted to give a slightly larger droplet VMD size to reduce the drift effect of the wing tip vortices on the spray pattern of these two units.
In general, Ultra Low Volume formulations will tend to form smaller droplets than water-based low volume formulations at the same rotational speed.

Figure 9. Aircraft, satloc and nozzles.
Table 5. Aircraft description.
6.5. Two Days Prior to Application
1) Treatment area was marked off with flags.
Flags
Four flags Figure 10 were erected on all four corners of the treatment area (target area) this aids the pilot in identifying the area to be treated, even though the aircraft is equipped with GPS Satloc.
2) Bamboo poles were cut and gathered as shown in Figure 11.
Figure 10. Flag on one corner of the target area.
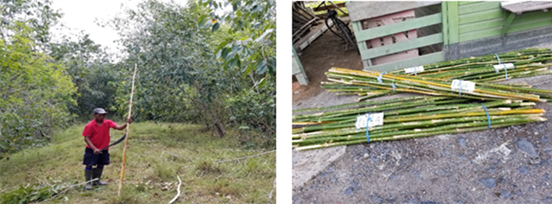
Figure 11. Cutting and stacking bamboo poles.
3) Bamboo poles were inserted 30 to 510 meters equidistant on each side, for stapling of sensitive paper, as illustrated in Figure 12 and Figure 13.
On the day of application
1) Sensitive paper was numbered and stapled onto the bamboo poles.
Numbering sensitive paper
• Each paper for all sides were number 1 to 17, so as to identify droplets at each distance, as demonstrated in Figure 14.
Stapling sensitive paper
• One sensitive was stapled on each pole for all side for capturing herbicide spray droplets from drift.
1) Time, Wind speed and direction, temperature and relative humidity were recorded.
2) Live weather and climatic conditions were observed via smart phone (online application “The Weather Channel”).
3) All safety precautions were observed before commencement of application (Figure 15).
Figure 12. Inserting bamboo poles.

Figure 13. Field layout for the experiment.
4) Aircraft operated from Rose Hall Estate airstrip.
5) Sensitive paper was retrieved 2 hours after application.
6.6. Data Collection
Magnifying glasses
The magnifying glasses were used to magnify the smaller droplets to aid in counting as shown in Figure 16.
Syngenta’s droplet counting aid
Syngenta’s droplet counting aid is designed with a 1 cm2, 1/2 cm2 and a 1/4 cm2 square, use to categorize few droplets, many droplets, and great number of droplets.

Figure 14. Numbering and stapling sensitive paper.

Figure 15. Aircraft operations.

Figure 16. Droplet counting instruments.
• Data collected was done by counting the amount of spray droplets (indicated by dots) on each sensitive paper from all sides, using the magnifying glass and the droplet counting aid.
Great number of droplets
• Sensitive paper was divided into 60 equal squares with dimensions of 0.635 cm × 0.508 cm = 0.32258 cm2 (60 × 0.3225 = 19.356 cm2) (Figure 17).
• Five squares were counted, from four at each corner of the paper and one in the center.
• The sum of droplets were divided by five to giving a mean.
• The mean was then multiplied by 60 to giving an estimated number of droplets on the particular paper.
Few droplets
• The 1 cm2 square from the droplet counting aid was used.
• Data collected for each block (time) were recorded.
Parameters of interest
• Spray drift distances and concentrations outside target area for each side.
• The distance at which drift concentrations are critical.
6.7. Statistical Analysis
• Data were formatted for compatibility with Statisti × 10 programme.
• Data were tabulated and represented graphically.
• Treatment means were compared at the 95% Confidence Interval, using ANOVA for RCBD and CRD.
• Block means were compared at 95% confidence interval using ANOVA for CRD.
• Distances of drift concentration were determined as being safe and as being hazardous, using Syngenta’s recommendation (30 - 40 droplet concentration, density per cm2).
• Syngenta recommends that, droplet concentration or droplet density for post emergence herbicides should be 30 to 40 droplets per cm2 in the target area that means 30 to 40 droplets per cm2 will effectively affect the target organism. Therefore, this droplet density or concentration may equally affect off-target organisms.
• The sensitive is approximately 19 cm2, the number of droplets on each sensitive paper for each distance was divided by 19 to determine the number of droplets per cm2 for each distance.
• Distances that reached and exceeded 30 droplets per cm2, was deemed hazardous. On the other hand, those distances that resulted in less than 30 droplets per cm2 was deem as safe and may not be hazardous.
Budget
All the costs, as indicated in Table 6 except for labour, sensitive paper and dye was budgeted for in each of the estate’s herbicide programme. However, all costs were covered by the corporation (GuySuCo 2016).
Limitation
Results obtained from this study will be applicable to conditions prevailing only at Rose Hall, Albion and Blairmont Estate.

Figure 17. Dimensions on sensitive.
Table 6. Approximate budget for experiment.
Beneficiaries
➢ Guyana Sugar Corporation.
➢ Ministry of Agriculture.
➢ Pesticides and Toxic Chemicals Control Board.
➢ Rice and cash crop farmers.
➢ Residents near Rose Hall Estate.
Results and discussions
RELATIONSHIPS BETWEEN TIME OF DAY AND ENVIRONMENTAL CONDITIONS THAT INFLUENCES HERBICIDE SPRAY DRIFT.
Average wind speed recorded was 9.6 km/h from 6 am to 7 am and increased to an average of 12 km/h from 7 am to 8 am, this average further increased to 15 km/h from 8 am to 9 am, Figure 18.
Correlation (Pearson) indicated a relationship with time and wind speed, which is, between 06:00 and 09:00 hours wind speed increases. This resulted in a positive correlation where time = 1 to wind speed = 0.9282 (r = 0.9282).
Average temperature recorded was 24.5˚C from 6 am to 7 am (Figure 19) and increased to an average of 25.3˚C from 7 am to 8 am, this average further increased to 26˚C from 8 am to 9 am.
Correlation (Pearson) indicated a relationship between time of day and temperature, which is, between 06:00 to 09:00 hours temperature increases. This resulted in a positive correlation where time = 1 to temperature = 0.8290 (r = 0.8290).

Figure 18. Correlation (Pearson) wind speed and time.

Figure 19. Correlation (Pearson) temperature and time.
Average Relative Humidity (RH), Figure 20 recorded was 84.3% from 6 am to 7 am and decreased to an average of 84% from 7 am to 8 am, this average further decreased to 81.6% from 8 am to 9 am.
Correlation (Pearson) indicated a relationship between time of day and RH, which is, between 06:00 to 09:00 hours RH decreases. This resulted in a negative correlation where time = 1 to RH = −0.7037 (r = −0.7037).
➢ Average wind speed increased by 5.4 km/h from 6 am to 9 am = 56.25%.
➢ Temperature increased by 1.5˚C from 6 am to 9 am = 6.12%.
➢ Relative Humidity decreased by 2.7% from 6 am to 9 am = 3.2% as indicated in Figure 21.
With an average wind speed of 9.6 km/h between 6 am and 7 am, drift reached 480 meters with a mean of 0.6 droplet per sensitive paper (3.0 square inches/19.354 cm2), as shown in Figure 22.

Figure 20. Correlation (Pearson), relative humidity (RH) and time.

Figure 21. Wind speed, temperature, relative humidity vs time.

Figure 22. Drift distances and concentrations vs time of day and windspeed.
Between 7 am and 8 am with an average windspeed of 12 km/h, drift reached 510 meters with a mean of 0.3 droplet per paper. This indicated a decrease of drift concentrations from the 6 am to 7 am hour. However, when compared drift at 480 meters in this hour with 480 meters in the previous hour, there was an increased in drift concentration, with a mean of 2.3 droplets per paper.
From 8 am to 9 am drift also reached 510 meters with a mean of 6 droplets per paper. This indicated an increase of drift concentration from the previous two hours. However, when compared at 480 meters with the previous two hours, drift concentration resulted in a mean of 93 droplets per paper.
This is an indication that, between 06:00 and 09:00 hours drift travels farther and concentrations increases as per distance.
Wind direction was predominantly North North East (NNE) to South South West (SSW) and to a lesser extent East North East (ENE) to West South West (WSW), Figure 23, for all nine applications. A NNE wind direction resulted in a more southerly-drift while ENE resulted in a more westerly-drift. However, for the Eastern and Northern direction drift was insignificant as indicated in Figure 24.
The eastern side recorded a mean drift concentration of 2 droplets per sensitive paper at 30 meters, Figure 25, and reached a total distance of 120 meters with a mean drift concentration of 0.11 droplet per paper, as indicated in Figure 26.
For the northern side, mean drift concentrations at 30 meters were 1.5 droplets per paper and travelled 90 meters at a mean drift concentration of 0.22 droplets per paper, Figure 27.
Drift concentrations were highly insignificant for both the Eastern and the Northern sides. Mean droplets per sensitive paper did not exceed 2 at 30 meters and was less than 1 at 120 meters. This all is seen from the results of Figure 28.

Figure 23. Drift distances and concentration versus wind direction.

Figure 24. Sample of retrieved sensitive paper from East.

Figure 25. Drift distances and concentrations (treatment means).

Figure 26. Sample of retrieved sensitive paper from North.
Drift travelled Westerly, 480 meters with a concentration of 1.2 droplets per sensitive paper, the highest concentration was recorded at 30 meters with a mean of 2693.3 droplets per sensitive paper, Figure 29. The critical point was p value.
Drift concentrations at 240 meters recorded a mean of 535.5 droplets per sensitive paper (19.354 cm2), thus resulted in 28.2 droplets per cm2. This, may less likely to cause an effect on off-target organisms since it below Syngenta’s

Figure 27. Northdrift distances and concentrations (treatment means).

Figure 28. Samples of retrieved sensitive paper from West.

Figure 29. Drift distances and concentration (treatment means).
recommendation of 30 to 40 droplets per cm2. On the other hand, at 210 meters mean concentration was 685.67 droplets per sensitive paper, which resulted in 36 droplets per cm2. This however, according to Syngenta’s recommendation will cause an effect in the target area, thus most likely to do the same in off-target area.
Therefore based on these results distances from 240 meters to 510 meters on the western side can be considered as a safe zone where drift may not be hazardous, whereas from 210 meters to 30 meters can be considered as an unsafe zone where drift can be hazardous, Figure 30.
Drift reached a distance of 510 meters with a mean concentration of 2 droplets per sensitive paper (19.354 cm2), Figure 31 and recorded the highest concentration at 30 and 60 meters with a mean of <10,000 droplets per paper at each distance.
At 420 meters drift concentration was 254 droplets, which is approximately 13 droplets per cm2 on the sensitive paper. According to Syngenta’s recommendations, this can be considered as the point where drift is less likely to cause negative effects, hence 420 meters to 510 meters and farther southerly, away from the target area can be considered as a safe zone, taking into account the weather and environmental conditions that prevailed.
30 meters to 390 meters away from the target area can be deemed hazardous. This zone, drift concentration exceeds 30 droplets per cm2 on the sensitive paper, which according to Syngenta is recommended to cause an effect on the target organism, hence can potentially cause negative effects on off-target organisms.
Because drift travelled farther southerly with higher concentration than other sides. Distances of critical drift concentrations were determined using the southern direction. Thus, southerly drift concentrations were further evaluated.
There are 11 groups (A, B, C, D, DE, EF, FG, GH, HI, IJ, and J), Figure 32, in which the means are significantly different from each another. However, from

Figure 30. Samples of retrieved sensitive paper from South.

Figure 31. Drift distances and concentration (treatment means).

Figure 32. Homogenous groups (South).
420 meters to 510 meters, treatment means of drift concentrations are not significantly different.
CRD was used to compare block means, Figure 33, statistically there is no significant difference between block 1, 2 and 3. Even though Block 1 (6 am to 7 am), block 2 (7 am to 8 am) and block 3 (8 am to 9 am) recorded different drift concentration means.
However, block 2 has drift concentrations 111% of block 1 and block 3 is 154% of block 1.
Although these blocks are not significantly different statistically, the increased concentrations between 06:00 and 09:00 hours are more likely to cause negative effects to off target organism at varying distances.
➢ 6 am to 7 am—A mean drift concentration of 200 droplets per sensitive paper (19.354 cm2) recorded at 360 meters from 3 applications, averaging 10.5 droplets per cm2.
➢ 7 am to 8 am—460 droplets per paper at 390 meters, averaging 24.2 droplets per cm2.
➢ 8 am to 9 am—297 droplets per paper at 450 meters, averaging 15.6 droplets per cm2.

Figure 33. Block means (South).

Figure 34. Treatment means SOUTH for each hour—drift distance and concentration.
According to Syngenta’s recommedations, all of the above, Figure 34 drift concentrations can be considered as safe, since there are below 30 - 40 droplets per cm2. However, buffer zone cannot be instituted at 360 meters as indicated in the 6 am to 7 am hour as safe. This is because at 360 meters in the 7 am to 8 am hour drift concentration amounted to 900 droplets, averaging 47.4 droplets per cm2 and for the 8 am to 9 am hour concentration amounted to 2000 droplets, averaging 105.26 droplets per cm2.
Averages of 47.4 droplets and 81 exceeded the recommended number of droplets (30 - 40 per cm2).
Even at 420 meters where the 6 am to 7 am and 7 am to 8 am hours recorded safe concentration, buffer zones cannot be instituted at this distance, this is because a mean of 720 droplets per sensitive paper averaging 38 droplets per cm2 was seen at the 8 am to 9 am hour.
Therefore, at 450 meters where the 6 am to 7 am, 7 am to 8 am and 8 am to 9 am hours recorded mean concentrations of 3.66, 16.66 and 297 droplets per sensitive paper respectively can be considered as the safe point, where the highest concentration averages 15.6 droplets per cm2, which according to Syngenta’s recommendations is less likely to affect off-target organisms
Hence, distances between 450 meters and 510 meters can be considered as a safe and effective buffer zone, which will determine the distances of buffer zones for all four sides of the target area.
7. Conclusion
It was concluded that wind speed and temperature increased between 06.00 and 09.00 hours, as relative humidity decreased. Between 06:00 and 09:00 hours drift travelled further with higher concentrations per distance for the droplets. Drift travelled further southerly, where wind was blowing towards.
Acknowledgements
Special thanks to Guyana Sugar Corporation (GuySuCo) for funding the research. Gratitude also goes to the farmers in West Bank Berbice Guyana South America and Estates (Rose Hall Estate, East Canje, Berbice, Albion Estate, Corentyne Berbice and Blairmont Estate in the West Bank Berbice) for allowing the researchers to use their fields for the project.
Conflicts of Interest
The authors declare no conflicts of interest regarding the publication of this paper.
Cite this paper
Chablall, R., Persaud, R., Chandranauth, R., Chibi, S., Ramnarain, G., Amichand, S. and Bullen, C. (2019) Optimizing Aircraft Utilization for Herbicide Application by Evaluation of Herbicide Spray Drift in West Bank Berbice Guyana South America. Agricultural Sciences, 10, 727-752. https://doi.org/10.4236/as.2019.106057
References
- 1. GuyoSuCo (2016) GuySuCo to Commence Aerial Spraying Trials. http://agriculture.gov.gy/2016/10/31/guysuco-to-commence-aerial-spraying-trials-aerial-agrichemical-buffer-zone-proposal-presented-to-agri-minister/
- 2. Persaud, R. (n.d.) A Review of GuySuCo No Fly Zones.
- 3. Dexter, A.G. (1995) Herbicide Spray Drift. http://www.mssoy.org/uploads/files/ndsu-ext-a-657.pdf
- 4. Ozkan, H.E. (n.d.) New Nozzles for Spray Drift Reduction. https://ohioline.osu.edu/factsheet/fabe-523
- 5. Ozkan, H.E. and Zhu, H. (n.d) Effects of Major Variables on Drift Distances of Spray Droplets. https://ohioline.osu.edu/factsheet/fabe-525
- 6. Kruger, G.R., Klein, R.N. and Ogg, C.L. (2013) Spray Drift of Pesticide. http://extensionpublications.unl.edu/assets/pdf/g1773.pdf
- 7. Persaud, R. (2017) Personal Communication, September 8, 2017.
- 8. Lang, C.A. (1978) The Application of Agricultural Chemicals by Aircraft on Sugarcane. https://www.sasta.co.za/wp-content/uploads/Proceedings/1970s/1978_Lang_The%20Application%20Of%20Agricultural.pdf
- 9. Nicholai, D., Stahl, L. and Herzfeld, D. (2015) When It Too Windy to Spray? [Blog Post]. http://blog-crop-news.extension.umn.edu/2015/06/when-is-it-too-windy-to-spray.html
- 10. Deveau, J.S.T. (2009) How Weather Conditions Affect Spray Applications. http://www.omafra.gov.on.ca/english/crops/facts/09-037w.htm
- 11. Minogue, P. (2011) Advances in Aerial Herbicide Application for Drift Mitigation. https://conference.ifas.ufl.edu/sehac/