Low Carbon Economy
Vol.5 No.1(2014), Article ID:43546,7 pages DOI:10.4236/lce.2014.51003
Tortuguero National Park, Costa Rica: Baseline CO2 Emissions from Boat Tours into the Channels System
Irene Alvarado-Van der Laat
Earth University, Guácimo, Costa Rica
Email: ialvarad@earth.ac.cr, ialvardocr@outlook.com
Copyright © 2014 by author and Scientific Research Publishing Inc.
This work is licensed under the Creative Commons Attribution International License (CC BY).
http://creativecommons.org/licenses/by/4.0/


Received 10 January 2014; revised 5 February 2014; accepted 13 February 2014
ABSTRACT
Tortuguero National Park located on the Caribbean coast of Costa Rica is only accessible by boat or air and attracts an average of 130,000 visitors yearly. The main activity of the park is the turtle nesting and hatching along the beaches as well as the observation of wildlife in the channel system. This makes it important to study the CO2 emitted by the tours operating in the park. To calculate these emissions researchers gathered data on engine type, horsepower and duration of idle while boats waited to buy tickets at the park entrance. The study found that tour operators emitted a minimum of 5.5 tons of CO2 per year into the atmosphere and water. It is likely that the park is more polluted than immediately evident.
Keywords:National Parks; Tourism; Outboard Engine; Four-Stroke; Idle Time; Environmental Impact; CO2 Emissions

1. Introduction
Tourism has a powerful impact and influence on local economies based on their demands and what they expect from the location. Leakages from economies occur when tourists demand things from the host country that the host cannot supply [1] . Tourism has the potential to help economies, but it is the tourism development that can cost the communities, government and tax payers a great deal of money. Thus, it is better to keep the existing infrastructure cutting costs and continue to stimulate the domestic economy without triggering turmoil. Ecotourism is a category of tourism that takes into account what the community has to offer without altering the community or environment [2] . Since the 1990s ecotourism has become a large part of the tourism sector in Costa Rica [3] . The definition of sustainability for sustainable tourism is “the tourism that has satisfied contemporary groups without limiting future generations to meet their own needs” [4] . Ecotourism is the type of tourism that should be embraced because it benefits the community, the economy and the environment and encourages overall well-being of each of these sectors [5] .
This is the case of national parks, where there are established land areas for protection, maintaining habitat and in turn biodiversity [6] [7] . Trees and other flora within parks sequester carbon [8] . Visitors to parks are educated about why preserving nature is important, which in turn can help them to make informed decisions in their lives regarding their impact on the environment [9] .
As the world continues to develop, these parks are becoming some of the only places where certain flora and fauna have been preserved and can be viewed in their natural habitat. Thus, parks attract large amounts of visitors every year [3] .
In the case of Tortuguero National Park in Costa Rica, 130,000 tourists are attracted yearly [3] . To access the park, one must drive to a parking area named “La Pavona”. From there, a water taxi must be taken to either the town of San Francisco or Tortuguero. In both towns there are hotels and tour companies that offer guided excursions into the park channel system.
In 1995, Juttner et al. [10] found that boat engines, while they are idling, emit not only CO2 but also volatile organic compounds (VOC) which dissolve into the water and can have a degrading effect on flora and fauna within the ecosystem. Juttner et al. [11] also noted that VOC, when concentrated in water, can create acutely toxic environments and that these compounds take fourteen days to break down in water. This could be important to consider when calculating the carrying capacity for boats within the park.
In another study, Situ and Brown [12] found that concentration of pollutants from outboard engines was not only a function of time, but also heavily influenced by propeller speed; a faster propeller speed will disperse pollutants farther from the boat. When boats are idling, the propellers are moving at the slowest speed possible which means pollutants will stay closer to the boat, creating a high concentration in the area near the dock. Another major pollutant from outboard engines is nitrogen; which can cause eutrophication from the surface of the water to the bottom strata, killing plants and animals at all levels [11] .
Toxic gasses are not the only pollutants from boat engines. Noise pollution from boat engines can have adverse effects on bird populations and can severely impact fish populations [13] . Codarin et al. [14] found that underwater noise pollution from boats can interfere with intra specific communication, interrupting mating procedures.
The goal of this study is to establish a baseline for CO2 emissions within Tortuguero National Park.
2. Methods
The study was conducted at Tortuguero National Park, Costa Rica in November, 2013. To be able to determinate the impact of CO2 emissions in the region due to boat activity, a series of methodologies for data collection was used.
1) Identification of boat ownership present at the main lagoon 2) A correlation between ownership, type and size of boat engine 3) Amount of tours entering into the park daily 4) Calculate the minimum amount of emissions generated by the boats, while they areidling at the dock of the national park 5) Engine type and size was recorded at the entry of the national park To gather data related to ownership, type and size of boat engines (a and b) researchers gathered a total count of boats arriving to the lagoon. This included water taxis going to “Pavona” as well as tour boats that went into the canals on tours from large hotels. The team traveled through the lagoon at variable times and recorded names and identification numbers of the boats as well as horsepower and engine type into a spreadsheet.
Boat emission (c, d and e) data was collected by a second team that focused on the idling time of the tour boats entering Tortuguero National Park. The park allows tours to enter three times per day: from 5:30-6:30 am, 8:00-9:00 am and 11:00-12:00 noon. Boats were observed between the first two tour periods as these were the times the majority of the boats entered the park.
When boats arrived at the dock at the entrance to the park, the times were recorded with a stop watch. When the tip of the boat hit the dock or the tour guide stepped off the boat, the observer started the stop watch. The time was stopped and recorded when the guide got back onto the boat. Names of hotels and tour companies (if available) were recorded to help with identification. Horsepower and engine type used by the tour operators and behavior of individual boat operators was noted.
After the data was collected, it was entered into an Excel spread sheet. Graphs and figures were generated from this data in order to provide a visual representation. A series of calculations was used to produce a final CO2-e emission factor for the boats as they idled:
1) kWh (kilo Watt) = S (strength of engine in HP) × 0.746 (kW using Dawson [15] conversion factor)
2) kWh (kilo Watt hour) = kW × T (length of idle measured in percent of hour)
3) CO (Carbon Monoxide) = E (emission factor) 3 4 × kWh 4) CO2-e (Carbon Dioxide Equivalent) in grams = CO × 1.57 (factor used to convert CO to CO2-e). Note that the conversion factor was calculated by taking the molecular weight of CO2 (44) and dividing it by the molecular weight of CO (28).
Limitation of the Study
It’s clear that this study covers only a fraction of the pollution caused by the boat engines. However, it was decided that given the time and resources available to researchers, this study would focus strictly on CO2 emissions produced by the boat operators at the entrance to the national park as well as the lagoon outside of the main entrance. The study was conducted during the low season for tourism in Costa Rica.
3. Results
The results of this study were divided into sections. Section A analyzes the boat data for all boats operating in the lagoon outside of the park. Section B determines the minimum amount of emissions at the dock which is the entrance to Tortuguero National Park and section C analyzes the tour operators’ behavior at the dock of the national park.
3.1. Boat Data
The initial boat count in the main lagoon of the Tortuguero region was 96 boats, 61 of which were owned by large hotels or lodges and 35 were privately owned. Of these 96 boats, 47 had a horsepower (HP) of 100 or less, while 52 had a horsepower higher than 100. The surveys indicated a significant difference in horsepower of contracted boats versus privately owned boats (Figure 1).
Of the 96 boats, only two had older two-stroke engines, while 94 had more ecologically friendly four-stroke models, which separate gasoline and oil to reduce pollution. In addition to HP, the brand of the engine was recorded. Suzuki was the most popular brand. Figure 2 demonstrates that 60% of the motors being used were Suzuki, with Yamaha being a distant second at 30% (Figure 2).
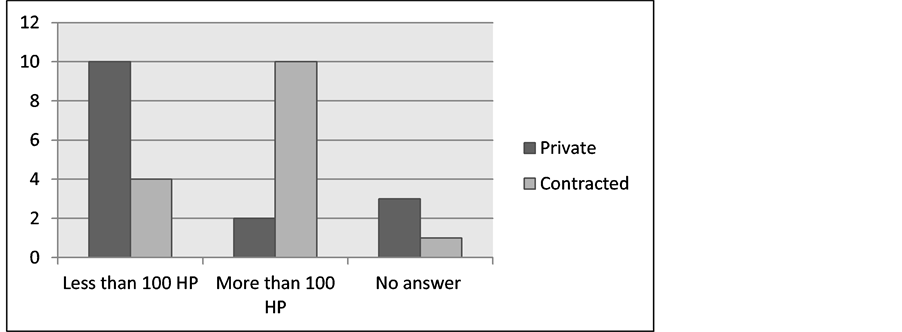
Figure 1. Indicated horsepower of privately owned boats and boats owned by large hotels and lodges (contracted) based on 33 responses to surveys handed out in Tortuguero, Costa Rica, 2013.
3.2. Emissions of CO2
To calculate the emissions generated by the tour operators at the dock located at the entry of the national park, it’s important to mention that the number of visitors and duration of engine idle varies between the different times of entry.
The 5:30-6:30 am tours were not only more popular, but the idling times were significantly longer as well. The average number of boats for the 5:30-6:30 am trips was 15. While the 8:00-9:00 am itinerary presented an average of 9 boats. The average idle time for the earlier tour block was 11 minutes 25 seconds; the average idle time for the second entry was 3 minutes 34 seconds. The yearly CO2 equivalent emissions for idling totaled to 5.512 tons, providing a minimum amount of CO2 emissions from boat tours (Table 1).
Over the course of the research a total of 43 different boats provided tour services inside the national park. The most popular size of engine was 115 HP and only two boat shad solar engines (Figure 3).
3.3. Tour Operator’s Behavior
The behavior at the entry of the park varies between weekdays and weekends; this affects the concentration of CO2 emission. During weekdays an average of 17 tours a day entered the park while during the weekends the number increased 29% (Figure 4) a behavior that is reflected in the concentration of emissions in Table 1.
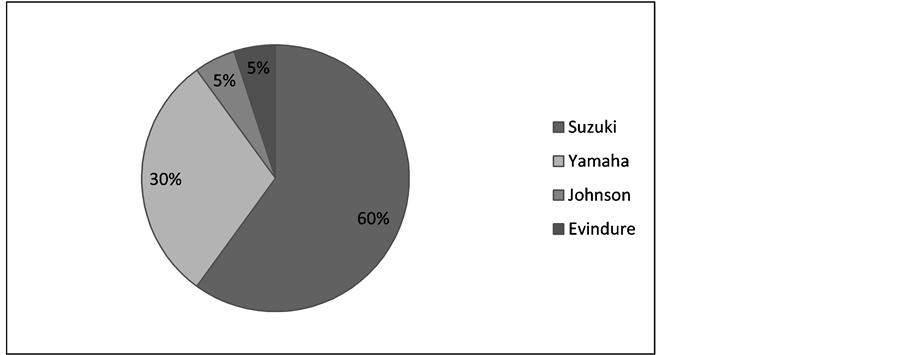
Figure 2. Most popular brand of engine presents at Tortuguero National Park, Costa Rica, 2013.
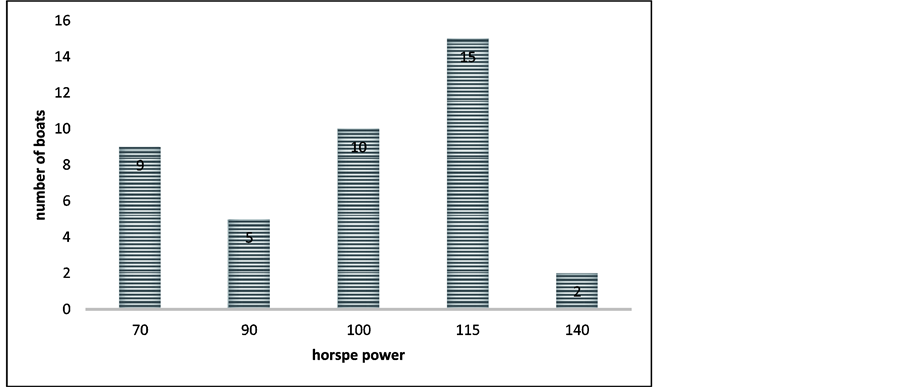
Figure 3. Most common horse power for motor that access Tortuguero National Park from the tour operators, Costa Rica, 2013.
This behavior has a direct correlation between the tours provided directly by the hotels and those providing by the association. Multiple times per day, boats full of tourists pull up to the dock at the entrance to the park. When they arrive the guide exits the boat and goes to the ticket booth to purchase the entrance passes in bulk for everyone in the boat. While the tickets are being bought very few boat operators turn their motors off and tie the boat to the dock. The majority of the operators keep the boats idling in order to hold them up against the dock or to keep all the boats that are jockeying for position at the dock from bumping into each other.
While the boats wait, their idling engines emit not only CO2, but also volatile organic compounds (VOC), NOx and noise.
It should be noted that there is a considerable difference in behavior in relation with the time consumed purchasing the tickets between the tours operators from the hotels and those administrated by the Tortuguero Tour Association. Table 2 show that with the same amount of boats idling a day the hotel tour operations spend an average of 12 minutes idling while the Tortuguero Tour Association boats spend an average of 7 minutes idling while purchasing tickets to enter the park.
4. Discussion
The park’s varied biodiversity is a key section of the Mesoamerican Biological Corridor [7] . Every year it is visited by approximately 130,000 tourists. Behind the eco-friendly image that the park puts forward are problems
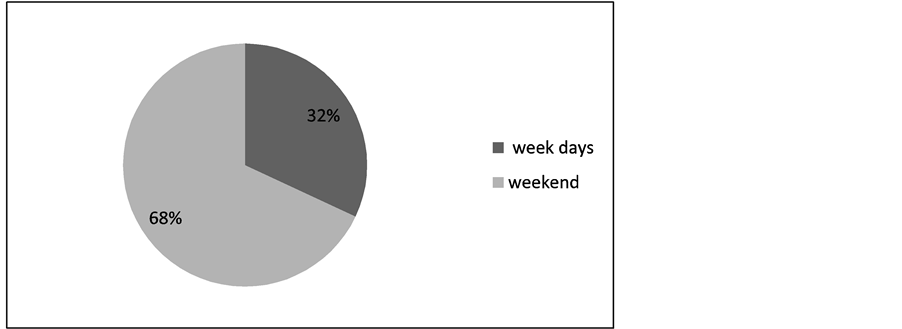
Figure 4. Behavior in number of tour operators during weekends and week days. Tortuguero National Park, Costa Rica, 2013.

Table 1. Cumulative CO2-e measured in kg/kWh for early and late trips on week and weekend days, Tortuguero National Park, Costa Rica, 2013.
Table 2. Different behavior between hotel tour operation and the tour association. Different behavior between hotel tour operation and the tour association.
that need to be addressed. While the scope of this study is limited by the low season for tourism, review and analysis of the results and relevant literature paints a convincing picture that boat travel within the park is not only producing CO2, but could also be negatively impacting the very wildlife the park is trying to protect.
The main attractions are the turtle nesting and bird watching. Tours are offered by the hotels, hostels and the Tortuguero Tour Association. Since 2009 park authorities have required engines to be four-stroke. This is beneficial to the canal ecosystems because four-stroke engines pollute significantly less than their 2-stroke counterparts. In addition to the more efficient gasoline engines, two boats were observed using solar-powered motors to take visitors on tours.
The park should do more with its mitigation efforts. There are currently docking bays, which if used, would allow boat operators to turn off the engine while waiting for the guides to buy the tickets. Over the course of the study, few boat operators were witnessed pulling the boat into a bay, mooring it, and shutting off the engine. The general behavior is that boat operators were either tying their boats to the dock or holding onto the dock with their hands and leaving their motors idling. Tours guides from hotels and hostels take considerably more time purchasing the tickets than the tour guides from the Tortuguero Tour Association. The Tortuguero National Park needs to encourage the use of the bays and establish a “no idle zone” where the boat operators dock while purchasing the tickets. These changes in behavior would reduce 5.5 metric tons of CO2 emissions per year. For this to occur, additional mooring space would need to be built. As the dock stands now, there is not enough room for boats to dock, which is one of the reasons motors are left running.
5. Conclusions and Recommendations
Tortuguero National Park is the only protected area in the Costar Rican system that does not have road access. The park, as well as the nearby towns can only be accessed by water or air. It can be assumed that due to the lack of cars and trucks the area maintains a pristine environment that can absorb CO2 from other areas helping Costa Rica achieve carbon neutrality by 2021.
This study demonstrates that large amounts of CO2 are being introduced into the area affecting not only the air but also the water due to the volatile organic compounds produced by boat motors. The current behavior of boat operators increases the amount of pollutants being introduced into the system as well as increasing the costs of boat operation.
The main entrance is being affected by a high concentration of boats operating at low speeds or idling in a small area. It is recommended that the boats be turned off while at the dock and a no idling zone be created in this area.
Additional studies should be done focusing on the effects of volatile organic compounds on the ecosystem of the park and if solar powered engines are practical solutions to this problem. It is important that another study be done during the high season; this would provide a more complete annual base data.
References
- United Nation Environment Program (UNEP) (2013) Resource Efficiency and Sustainable Consumption and Production. Negative Economic Impacts of Tourism. http://www.unep.org/resourceefficiency/Business/SectoralActivities/Tourism/FactsandFguresaboutTourism/ImpactsofTourism/EconomicImpactsofTourism/NegativeEconomicmpactsofTourism/tabid/78784/Default.aspx
- Li, J. (2013) Sustainable Ecotourism Established on Local Communities and Its Assessmet Systems in Costa Rica. Journal of Environmental Protection, 4, 61-66.
- Meletis, Z.A. and Harrison, E.C. (2010) Tourists and Turtles: Searching for a Balance in Tortuguero, Costa Rica. Conservation and Society, 8, 26-43.
- Harris, R.T.G. and Williams, P. (2002) Sustainable Tourism: A Global Perspective. Butterworth Heinemann, Oxford.
- Yuan, J.Q., Dai, L.M. and Wang, Q.L. (2008) State-Led Ecotourism Development and Nature Conservation: A Case Study of the Changbai Mountain Biosphere Reserve, China. Ecology & Society, 13, 1-16.
- Stem, C.J., Lassoie, J.P., Lee, D.R. and Deshler, D.J. (2003) How “Eco” is Ecotourism? A Comparative Case Study of Ecotourism in Costa Rica. Journal of Sustainable Tourism, 11, 322-347.
- Sanchez-Azofeifa, G., Daily, C.G., Pfaff, A. and Busch, C. (2003) Integrity and Isolation of Costa Rica’s National Parks and Biological Reserves: Examining the Dynamics of Land-Cover Change. Biological Conservation, 109, 123- 135.
- Steuer, C. (2010) Climate Friendly Parks: Performing Greenhouse Gas Inventories at US National Parks and Implications for Public Sector Greenhouse Gas Protocols. Applied Geography, 30, 475-482.
- Patterson, J., Linden, E., Edward, P., Wilhelmsson, D. and Lofgren, I. (2009) Community-Based Environmental Education in Fishing Villages of Tuticorin and Its Role in Conservation of the Environment. Australian Journal of Adult Learning, 49, 383-393.
- Juttner, F., Backhaus, D., Mattias, U., Essers, U., Greiner, R. and Mahr, B. (1995) Emissions of Towand Four-Stroke Outboard Engines Engines—II. Impact on Water Quality. Water Research, 29, 1983-1987.
- Juttner, F., Backhaus, D., Mattias, U., Essers, U., Greiner, R. and Mahr, B. (1995) Emissions of Two and Four-Stoke Outboard Engines—I. Quantification of Gases and VOC. Water Research, 29, 1976-1982.
- Situ, R. and Brown, J.R. (2012) Mixing and Dispersion of Pollutants Emitted from an Outboardmotor. Marine Pollution Bulletin, 69, 19-27.
- Arevalo, J.E. (2011) Traffic Noise Affects Forest Bird Species in Protect Tropical Forest. Revista De Biologia Tropical, 59, 969-980.
- Codarin, A., Wysocki, L., Ladich, F. and Picciulin, M. (2009) Effects of Ambient and Boat Noise on Hearing and Communication in Three Fish Species Living in a Marine Protected Area (Miramare, Italy). Marine Pollution Bulletin, 58, 1880-1887.
- Dawson, P. (2008) Outboard Emissions. Institute of Automotive Mechanical Engineers, Auburn.