Open Journal of Modelling and Simulation
Vol.03 No.03(2015), Article ID:57296,14 pages
10.4236/ojmsi.2015.33009
Simulation of High Density Pedestrian Flow: A Microscopic Model
Mohamed H. Dridi
Institute für Theoretische Physik, Unversität Stuttgart, Stuttgart, Germany
Email: mohamed.dridi@itp1.uni-stuttgart.de
Copyright © 2015 by author and Scientific Research Publishing Inc.
This work is licensed under the Creative Commons Attribution International License (CC BY).
http://creativecommons.org/licenses/by/4.0/


Received 17 April 2015; accepted 15 June 2015; published 19 June 2015
ABSTRACT
In recent years, modelling crowd and evacuation dynamics has become very important, with increasing huge numbers of people gathering around the world for many reasons and events. The fact that our global population grows dramatically every year and the current public transport systems are able to transport large amounts of people heightens the risk of crowd panic or crush. Pedestrian models are based on macroscopic or microscopic behaviour. In this paper, we are interested in developing models that can be used for evacuation control strategies. This model will be based on microscopic pedestrian simulation models, and its evolution and design requires a lot of information and data. The people stream will be simulated, based on mathematical models derived from empirical data about pedestrian flows. This model is developed from image data bases, so called empirical data, taken from a video camera or data obtained using human detectors. We consider the individuals as autonomous particles interacting through social and physical forces, which is an approach that has been used to simulate crowd behaviour. The target of this work is to describe a comprehensive approach to model a huge number of pedestrians and to simulate high density crowd behaviour in overcrowding places, e.g. sport, concert and pilgrimage places, and to assist engineering in the resolution of complicated problems through integrating a number of models from different research domains.
Keywords:
Pedestrian Dynamics, Crowd Simulation and Modelling, Crowd Management and Pedestrian Safety, Crowd Control, Objects Tracking, High Density Pedestrian Flow, Hajj Simulation

1. Introduction
In recent years, several models for the movement of crowds have been proposed. One can distinguish between two general approaches: microscopic and macroscopic models. In the microscopic scope (range), pedestrians are treated as individual entities (particles). The particle interactions in this model are determined by physical and social rules as well as the interactions between the particles with their physical surrounding. In this context we cite, the social-force models (see [1] and the references therein), the cellular automata, e.g [2] [3] , queuing mo- dels e.g. [4] , or continuum dynamic approaches like [5] . For an extensive survey of different microscopic appro- aches we refer to [6] .
PedFlow is a microscopic simulation model developed by Löhner Simulation Technologies International, Inc. (LSTI) [7] . In this model, individuals are treated as self-driven particles that interact through social and physical rules. Each person in the pedestrian flow has a desired position and desired velocity and adapts his or her current velocity according to the surrounding neighbour; furthermore, each crowd member simultaneously tries to avoid collision with other crowd members and any environmental boundaries. The current velocity and direction of a single individual in the crowd is a result of the circumstances and social interactions. These social forces can be influenced by the environment, other people and internal states.
In this approach, the pedestrians are treated as “particles” moving according to Newton’s law:
 (1)
(1)
Here ,
,  and
and  denote the mass, velocity and position of the pedestrian, and
  the sum of all forces exerted by it or acting on it. The basic unknown that requires intensive modelling efforts in these equation is the force-vector. In the sequel, we will discuss the main forces that can be identified acting on a pedestrian.
2. Forces Governing the Pedestrian Motion in PedFlow
In the PedFlow model, we distinguish two major type of forces: Internal and external forces. As example of internal far range force we introduce the will force  and denotes the self-driven force that drives an individual towards their desired velocity. The self-driven force is based on a simple error correction term consisting of the difference between an individuals desired velocity, and a desired direction
 , and their actual velocity. This difference in velocity is corrected over a specified time interval
 , referred to as the relaxation time, that corresponds to the finite amount of time that is required for people to react and physically change their
velocity; , where
 ,
,  denote respectively the desired and the current velocity and
  is a function of “list of circumstances”. The modeling aspect is included in the function
 , which
in the non-linear case may itself be a function of . Suppose
  is constant, and that only the will force is acting. Furthermore, consider a pedestrian at rest. The pedestrian could start from rest
  and wants to reach the desired velocity
 . In this case, we have:
 , with
  we have
 . The solution of this equation is given by
  with
with
 and
and  We can thus obtain
  by measuring the time required to reach a percentage (e.g. 90 percent) of the desired velocity, starting from rest (see Figure 1). This time is typically in the range of 0.5 - 1.0 s, but obviously depends on the current state of fitness, stress, climate and terrain condition, and desire to reach a goal. We can define the function
  via “relaxation time”
 . Typical values for the desired velocity
  and relaxation time
  are
are  and
and  (0.5 to 1.0 s). Medicinal facts and human experience show that older pedestrians walk more slowly than younger pedestrians. This effect has a significant impact on the “relaxation time” of a single pedestrian, hence it is easier to assess that younger pedestrians reach their desired velocity faster than older pedestrians.
Traditionally the will forces are specified by a desired velocity of the pedestrian and the trajectory. The will force will be implemented as a vector on the simulation model. However, in the motivation to reach certain places, there are tasks in which the desired motions of individuals are specified by the state of system (list of circumstances) rather than time. For such tasks, desired velocity field control has been proposed. In this chapter, a method to extend our information about the forces that drive the individuals from rest to their desired ve- locities is evaluated.
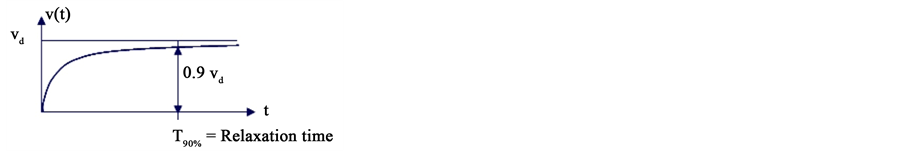
Figure 1. Speed-up of an isolated particle to the desired velocity. This difference in velocity is corrected over a specified time interval , which is referred to as the relaxation time, that corresponds to the finite amount of time that is required for people to react and physically change their velocity.
In the case of group movement, the will force takes the direction of the group leader. A “group” is defined as a physical collection of people following the same route, but who may or may not be part of the same social group, and a “subgroup” is defined as people within the same physical “group” who want to stay together, like friends or family members. Several studies have revealed that smaller subgroups constitute the majority of the people in a crowd. But very few studies are able to model the “subgroup” behaviour. A particular subgroup concerns pedestrians who hold hands. It is recognized that holding hands is the most effective way of keeping children safe from traffic injury [8] . All the group members take the desired position and the desired velocity of the group leader.
In the case of an emergency or dangerous situation, the will force takes the direction of the nearest exit and this has dramatic consequences on the behaviour of pedestrians at the exit. They block each other and this builds up a rigid arc from which no one can escape (see Figure 2).
Figure 2 demonstrate the situation of pedestrians in case of emergency or dangerous situation. The will force points to the direction of the nearest exit. This picture illustrates the situation when people take the proper precaution to prevent potential hazards when they are alerted. For example, in case of an emergency, evacuating the building immediately by using the closest exit and going to the designated meeting location [9] .
The collision avoidance forces is internal intermediate range force. We denote by intermediate range forces, the force that change the motion of an individual in order to avoid an encounter with another. to avoid static and dynamic obstacles. At any time the distance between each obstacle, wall, and the particle i are computed, go both of them closer to each other, then calculate the angle between particle i’s desired direction and the line joining the center of particle i and the obstacle. This effect can be seen within the rectangle of influence (Figure 3). The distance and the angle play a significant role to assess how relevant the obstacle is to the trajectory. When travelling the environment, particles also update their perceived crowd density, which is necessary for their decision making process.
Using as a starting point the situation depicted in Figure 3, given two pedestrians with current coordinates and velocities ,
,  and
and ,
,  , an encounter may be computed by evaluating the time increment
  at
at
which the distance between the two is minimized, i.e., . This results in
 or
or . The minimum distance is given by
 . Obviously, the force will only become active if
 . The general nature of
this force is such that it will decrease with distance. How exactly this decrease function looks like is unknown at the present time (it may even be random). We have used a function based on the normalized distance between
the pedestrians , where
  is the characteristic radius of pedestrian 1, which is of the form:
 . This simple repulsion force may be refined further by considering the directions along and
normal to the current velocity vector , denoted by
  and
and , respectively. We can then split the normalized
distance d into a tangential and normal component: ,
, . This leads to
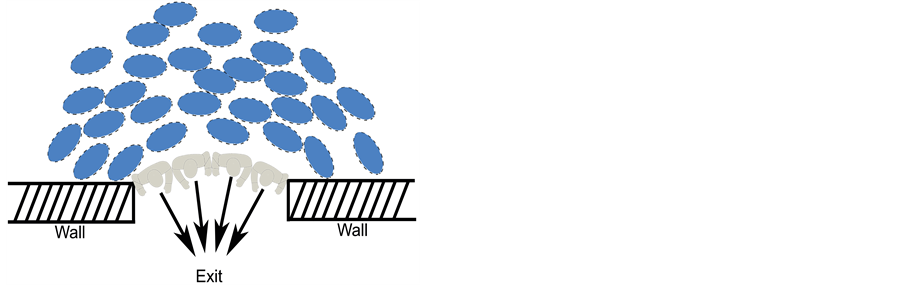
Figure 2. Scheme of an arc formation at openings and bottleneck areas. The full ellipses re- present pedestrians moving in the same directions. The pedestrians block one another in the direction of the movement and congest the passage area.
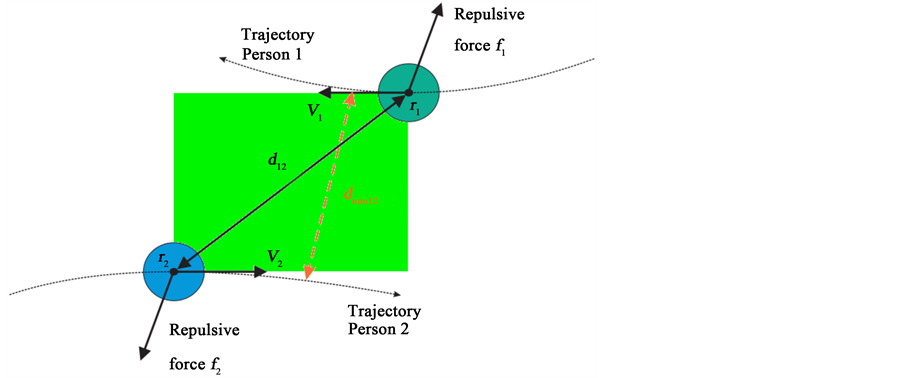
Figure 3. Collision avoidance rectangle of influence. Illustration of pedestrian-pedestrian col- lisions avoidance forces. This force is referred as repulsive force and reaches its max. value at the shortest distance between the particles.
tangential and normal forces of the form: . The value of
  can be related to the relaxation time, i.e. it is not too difficult to obtain. We have used
 .
.
If an agent enter the interaction rectangle, a tangential force (see Figure 3), will be active to change the direction of movement and make a curve in the path to avoid collision. The angle between two agents is used to simulate the individual decision making how to react to a previous collision. For example, in a walking floor, if there is enough space between us and another person, none of us would change the direction. In case of many persons walking in the corridor, the majority of people tend to move to the right. Therefore, when the velocity vectors are almost collinear, the tangential forces pointing to the right. In case an agent 1 detects agent 2 and agent as possible obstacles, then the system computes the distance vector towards agent 1 as follow . Agent 2 is farther away from 1, but since it is moving against agent 1, the system gives this obstacle higher priority.
Once a pedestrian has moved close enough to obstacles or other pedestrians, his velocity will be decreased markedly. Unlike the long-range forces, these forces act in the direction of the normalised difference vector
 . We have used, as before, a force of the form
 , although the exact nature of this force is unknown at the present time. As before, the value of
  can be related to the relaxation time. We have used
 .
.
A stream of pedestrians will be enclosed by the walls in or around the structures in which it occurs. We have assumed that this force acts in the direction of the gradient of the distance-to-wall function . This function, which measures the closest distance to a wall from any given location r, is assumed to be known. In practice, it is evaluated in a pre-processing step. As before, we have used, for lack of any deeper knowledge, a
function of the form: , with
 .
.  denotes the individual-individual interaction force or individual-obstacle force,
  denotes the collision force due to the wall (out of a total of M wall surfaces).
3. Microscopic Simulation of the Mataf
The pilgrimage (called Hajj in Arabic) is the most significant factor in the life and growth of the holy city Mecca. The number of pilgrims to Mecca increased in 2009 by 5 percent compared to 2008, official statistics said. In the last decade the number of pilgrims has been increasing dramatically, every year close to 4 million pilgrims arrive in the Saudi territory through Djedah airport, Djedah port by the Red Sea and through the high way connecting Saudi Arabia with neighbouring states. The arrival of the huge number of pilgrims each year during the last month of the Islamic calendar makes this event a grand human gathering in the world as well as one of the largest logistical and administrative undertakings [10] . The goal of pilgrims is to perform the Hajj ritual. Managing the flow of pilgrims to Mecca every year, posed various challenges to Saudi authorities [11] .
Millions of believers perform the Hajj at the same time period, 4 specific days in the year. All pilgrims per- form the same rituals, typically in same or concurrent time periods. The rituals are in specific points called points of interest, such as the Kaaba in Mecca, the mount Arafat etc. From the mountain Arafat, the pilgrims continue their course to Muzdalifah to throw stones at the pillars symbolizing the devil. Millions of believers live during the Hajj in tents in the Mina area (tent city). After that, millions of believers move towards Mecca to do their final Tawaf Al-Ifadah and to finish the Hajj ritual.
In this section we are concerned with Tawaf as an important pilgrims activity in Hajj period. The accurate prediction of pedestrian motion can be used to assess the potential safety hazards and operational performance at events where many individuals are gathered. The prediction of the pedestrian flow on the Mataf as permanent by overcrowded area and the investigation of the building facility through the simulation can be used to detect the critical points with high density in different regions of the Mataf. We attempt to determine the average capacity of the Mataf and we study the capacity of the mobile Mataf as possible solution to reduce the pressure of pedestrian flow during the rush hour. As consequence of this solution we investigate how the columns of the mobile Mataf influence the fluidity of pilgrims stream on the ground Mataf. The columns serve as a support of the mobile Mataf. An understanding of how to alter crowd dynamics in Hajj activities would have a significant impact in a number of other scenarios, e.g. during riots or evacuations. Evacuation from dangerous zones, restrained places or overcrowded buildings, also represent cases where the prediction of pedestrian motion can be used advantageously.
3.1. Motivation
Now that the world population, particularly the Muslim population, is increasing, the number of pilgrims will also increase. With the huge development in the transportation technology in recent years the number of pilg- rims arriving to Mecca grow systematically. It is a fact that the areas of Holy sites, such as Mina, Arafat, Muzdalifah and Mecca are fixed. This has motivated the Saudi government to find an effective and long-term solution. One of these solutions is to evaluate and build the mobile floor for Mataf expansion. The mobile Mataf has a lot of advantages, it can be built in a short time on the Mataf area during the Hajj period, after that it can be rapidly removed.
3.2. Observations in the Simplified Model
One of most important rituals in Hajj is the Tawaf, it consists of circling the Kaaba in the Holy Mosque seven times counter clockwise. Afterwards the Sa’y is performed, the walking between Safa and Marwa in an enclosed, air-conditioned structure. During Hajj seasons everything in the Mataf area is dense, and we have a compact state. The pilgrims have body contact in all directions and they have no influence on their movement, they are floated by the stream. This forms structures and turbulences in the flow. This turbulence is very well observable in our video recording [12] . Density and velocity can also be seen. The following effects could also be observed during the Tawaf:
• Edge Effects: when the edges of a crowd move faster than the center of the crowd.
• Density Effects: crowd compression in local areas can imbalance the crowd flow.
• Shock Waves: propagation of some effects spreading throughout a densely packed crowd.
• Speed Effects: higher density causes lower walking speeds, with increasing contact area between pilgrims.
• Group Effects: groups of pilgrims move together and try to keep together all of the time.
• Break out Effects: when pilgrims finish the Tawaf, they try to move directly to the edge of the Mataf. The movement of these pilgrims is normally spiral with increasing distance from the center of the Kaaba.
• Structure Effects: With higher density, turbulences and structures are created within the flow.
• The average time for Tawaf is ca. 1 hour.
• While praying in the Haram, there is no Tawaf at all. i.e. density decreases when praying is going to start and rises when praying has finished.
3.3. The Haram Mosque Building Description
The pilgrims stream into the Mataf from all gates of the Haram (see Figure 4(A)), but the beginning of Tawaf must start at a specific line (see red line in Figure 4(B)). As we can see in Figure 4(D), the Haram has 8 gates, stairs and an escalator. The gates are probably used by all pilgrims. Nearly (approximately 80 percent) of pilg- rims make Sa’y after Tawaf, the rest (20 percent) of the pilgrims go out through any of the doors. For the simulation all doors are treated equally.
In Tawaf the pilgrims must circle the Kaaba seven times in a counter-clockwise direction. The black stone designates the beginning and end of the Tawaf (the pilgrims must stay 5 - 7 s in front of black stone to appre-
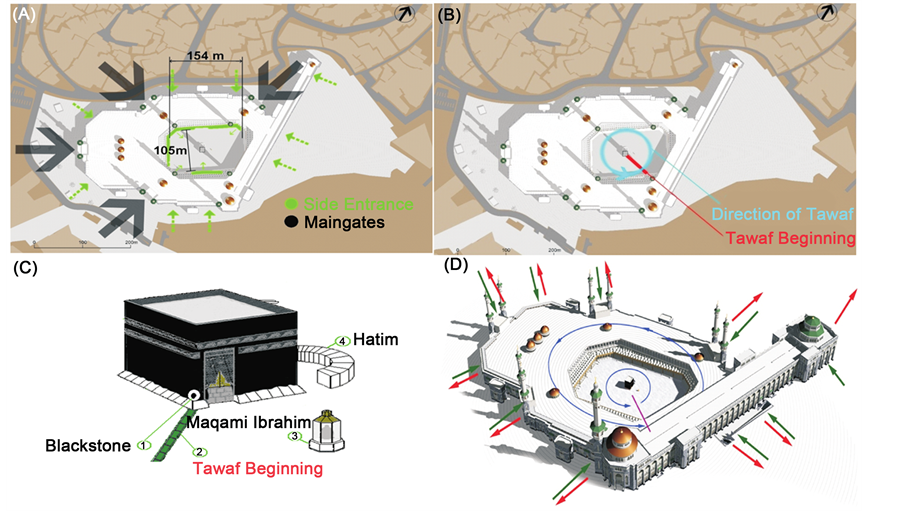
Figure 4. (A) Illustration of the Mataf dimension; (B) the direction of the Tawaf movement; (C) the Mataf description: (1) the black stone, one of the most overcrowded regions in the Haram, the measured local density ρ(r, t) in this place reached 9 persons/m2, (2) the green strips on the ground indicate the begin and end of the Tawaf movement, (3) Maqam Ibrahim, hysterical monument near the Kaaba that must be considered in the simulation; (D) the gates and entrances to the Mataf.
ciate saying “Bismuallah Allahu Akbar” after every round). Before performing Tawaf, pilgrims try to reach the black stone. They queue around the Kaaba wall with some pilgrims not wanting to queue and trying to push through. After the Tawaf people try to pray between Maqami Ibrahim and the Kaaba (see Figure 4(C)), (The prayer is about 4 to 5 min).
In Figure 4(D), a 3D model of the Haram Mosque in Mecca is illustrated. This model shows the main gates, doors, side entrances, and stairs to the Mataf open air area of the Haram. The start/end of the Tawaf is indicated by the red line. The blue line indicates the Tawaf movement direction on the roof of the mosque or in the piazza of the Haram near the Kaaba.
3.4. Simulation of the Simplified Model
Our first set of simulations consisted of the pedestrian flow through the Mataf area without columns (see Figure 5(B)). The Mataf area was 105 m wide and 154 m long and in the center of the Mataf the Kaaba with 21.14 m long and 11.53 m wide is placed. The circumambulation area (ground floor) of Mataf is around 16,170 square meters. Each pedestrian’s desired speed was set to a relatively high value of 1.2 m/s, the pedestrian radius R was 0.178 m to 0.2 m and the relaxation time  was set in the range of 0.5 s to 1 s. After a pedestrian finishes the Tawaf (seven times circling around the Kaaba) they go in the direction of Sa’y. The measured densities are 5 - 6 persons/m2 (measured in different part of the Mataf area with respect to the distance from the Kaaba). These results are consistent with those obtained by Predtetschenski and Milinski [13] , who also found out that high density results in reduced velocities. The congested area increases the density sometimes up to 7 or 8 persons/m2. In consequence the pedestrians begin to push to increase their personal space and create shock-waves propagat- ing through the crowd.
Figure 5(C) displays a pilgrims movement simulation within Mataf area. The entire influx consists of three uni-directional pedestrian flows coming from three entrances. The velocity indicator shows that the movement in the edges of the Mataf area is faster than in the area of the Kaaba. The picture shows a snapshot of the simula-
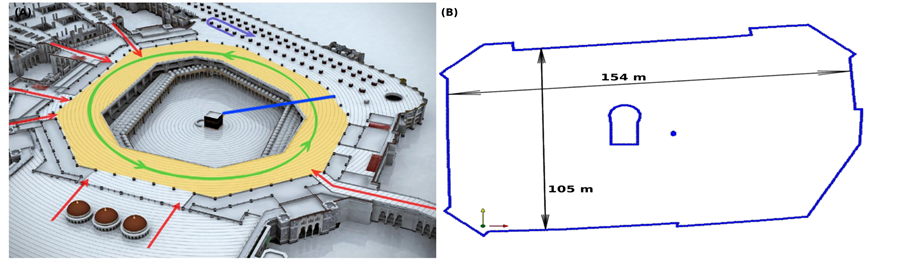
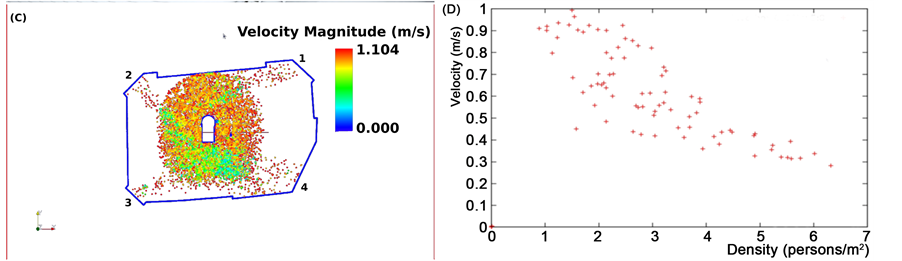
Figure 5. (A) 3D-model of the mosque building in Mecca. Main gates and entrances are indicated through the red arrows, the green arrow indicates the direction of the Tawaf movement, the blue line indicates the beginning and the end of the Tawaf and the pink arrow indicates the Sa’y movement; (B) Mataf dimension; (C) PedFlow simulation snap-shot results, the numbers 1, 2, 3 indicate the entrances or particles streaming in the Mataf area and the number 4 particles streaming out of the Mataf or the exit from the Mataf toward the Sa’y area; (D) Decrease of the pedestrian velocity in the Mataf area as a function of the local density, the measured data are represented by the crosses, they are consistent with the empirical data of Predtetschenski and Milinski [13] .
tion at 38 s, which has a particularly high density of 6.5 persons/m2. Also note that the pedestrian density is very high at the places where the Tawaf begins and ends. Note the clumping of pedestrians going in opposing directions, when the pilgrims finish the Tawaf. The average density for many runs was 5 to 6.5 persons/m2, (see Figure 5(D)).
3.5. Simulation of the Enhanced Model
The second set of simulations consisted of the pedestrian flow through the Mataf area with columns, (see Figure 6). The parameters are the same as in Section 3.4. After pedestrians finish the Tawaf (seven times circling around the Kaaba) they are going in the direction of Sa’y. The measured densities are again 5 - 6 persons/m2 with up to 7 or 8 persons/m2 in the congested area. Thus, all results are identical with the simulation without the columns, cf. Section 3.4. Obviously the columns do not influence the densities and velocities of the pilgrims in the congested area. The only observable difference are the vacant rings on the circles defined by the positions of the columns.
Figure 7 illustrates two simulation snap-shots with different entire influx. The pedestrian streaming the Mataf area from three entrances are indicated by the numbers 1, 2, 3 in Figure 7(B). The velocity indicator shows furthermore that the congested area still is in the interior zone near the Kaaba and at the area where the Tawaf begins and ends. The picture shows a snapshot of the simulation at 38 s, which has a particularly high density of 6.5 persons/m2.
For the first moment one can not realise the difference to the results illustrated in Figure 5 and Figure 6, both pictures exhibit the same critical points. Note the clumping of pedestrians going in opposing directions, when the pilgrims finish the Tawaf. One may conclude that the columns have little influence on the movement of pilgrims but one can clearly see a vacant ring along the columns and this results from repulsive interaction be- tween the particles and the columns, this effect is better seen in case of lower crowd density. In case of high density crowd the pressure between the individuals is so huge that this vacant ring along the column disappears. This means that under the enormous surrounding pressure, people are forced to come near the pillar. Here we stress that the small size and smooth form of the column is very important to prevent people injury or dangerous situations (Figure 8 and Figure 9).
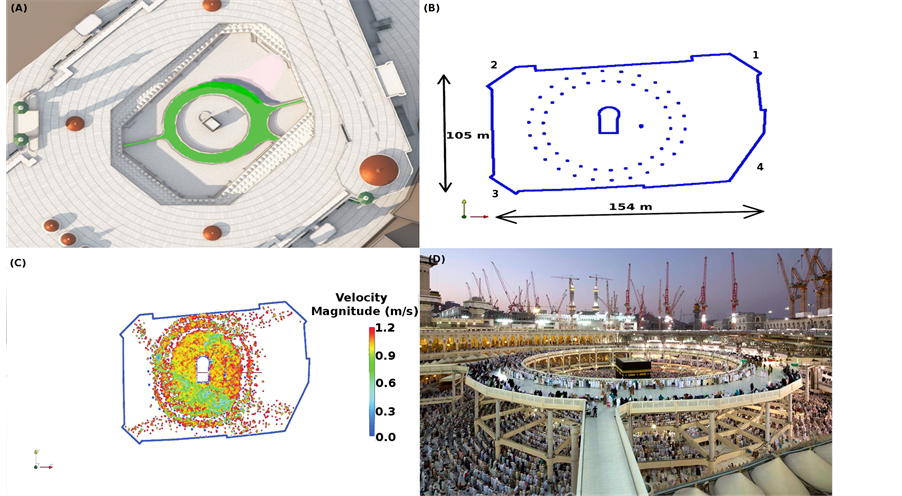
Figure 6. Snapshot 1: (A) 3D Model visualises one favourite concept for developing of the Mobile mataf (see green coloured area); (B) CAD drawing displaying the Mataf dimension area with columns; (C) Simulation result demonstrates how the pillars influence the movement of pilgrims on the Mataf ground. The colour coding represents the magnitude of the local velocity, PedFlow snapshot; (D) Mobile floor for the expansion of the Mataf area in Haram mosque.
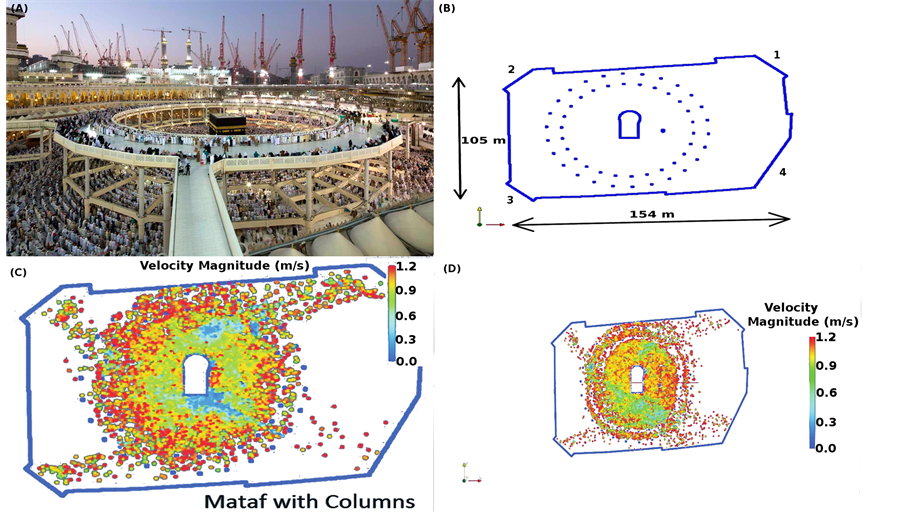
Figure 7. Snapshot 2: (A) (mobile mataf floor) at Mataf area in Al-Haram Sharif, one can see the columns (pillars) bearing the mean structure of the temporary Mataf; (B) A CAD drawing displaying the Mataf area with columns; (C) and (D) Illustrating a movement of pilgrims in the Mataf area (PedFlow simulation results). The simulation shows a vacant ring since the pilgrims avoid the circle on which the columns are placed. In the region of the beginning and end of the Tawaf ingoing people push back the outgoing people. Thus, it creates a trap becoming more and more crowded.
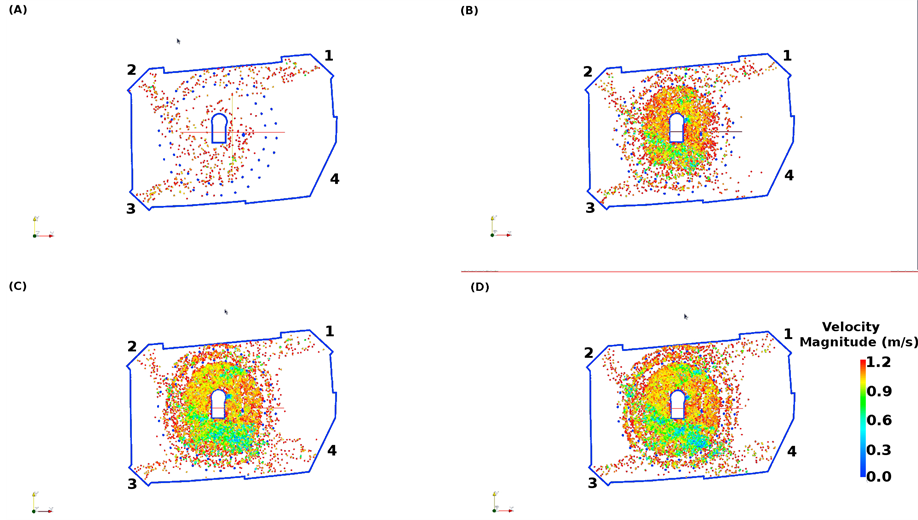
Figure 8. Pilgrims streaming the Mataf area through three different gates denoted by 1, 2, 3 and leaving the Mataf floor through gate 4. Step by step simulation of a pedestrian flow circling seven time the holy Kaaba ((A); (B); (C) and (D) illustrate time consecutive PedFlow animation snapshots). The impact of the columns on the pilgrims movement per- forming the Tawaf are demonstrate. The red colour indicates pedestrian walking with their desired velocities and the turquoise colour indicates pedestrian walking with lower velocities.
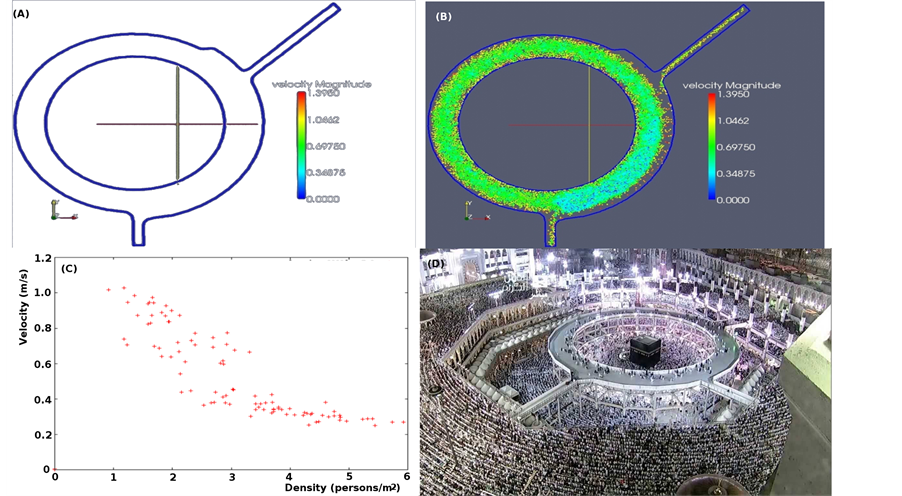
Figure 9. (A) CAD drawing displaying one of many geometry concepts developed for evaluation of the mobile Mataf; (B) Simulation results (new geometry concept); (C) Velocity density diagram (PedFlow simulation); (D) The actual mobile floor facility top view.
4. Mobile Mataf Geometry
The new floor is based on a modules concept with fast assembly and disassembly without interruption of ongoing Tawaf. This light weight structure is designed to be integrated into the existing Haram Mosque. The outer diameter is about 94 m, the inside diameter is around 70 m and the width is around 12 m (see Figure 4(A)). An additional area of 3000 m2 is added to the existing Mataf area. Access is achieved over several ramps. The clearance height is around 2.7 m leaving enough space for worshipper to pass underneath.
4.1. Concepts and Evaluations
The idea to develop a new moving platform above the existing Mataf has the goal to take pedestrian pressure from the old Mataf. The design and evolution of this mobile area revealed a new concept concerning the safety and fluidity of pilgrims flow. In the next paragraphs we discuss two approaches with two different geometries and we present our analysis data.
• Mobile Mataf with extension: we shall discuss.
-Geometry.
-Simulation results.
-Capacity of the Mataf according to Predtetschenski and Milinski densities.
4.2. Simulation
This set of simulations considers a unidirectional pedestrian flow circling the Holy Kaaba seven times. Different strengths of the influx of pilgrims were used, see Table 1. The walking pedestrian area named mobile floor for the expansion of the Mataf contains two exits and one emergency exit. The design of the Mobile Mataf allows one-directional pedestrian flow (see Figure 10(A)). The parameters used in the simulations were the desired velocity of the individual , the individual radius R and the relaxation time
 . The size or radius of particles are given in a table according to Predtetschenski and Milinski [13] . For simplicity, all parameters are identical for each person.
4.2.1. Parameters
• Individual Parameters.
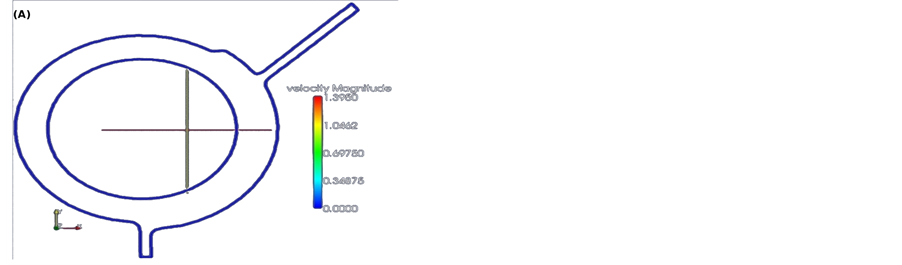
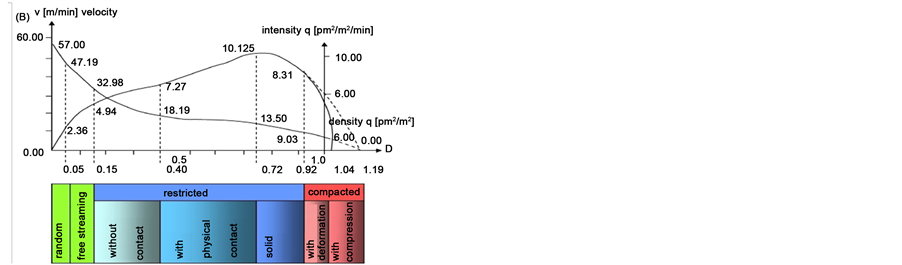
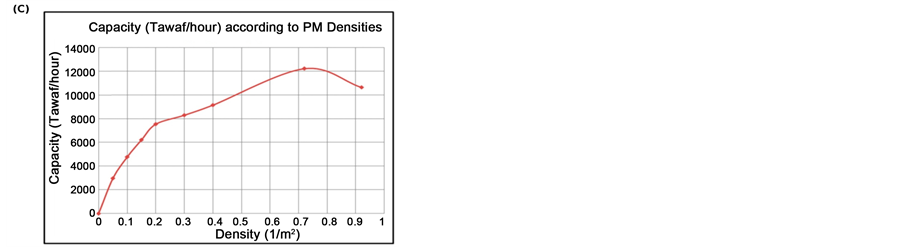
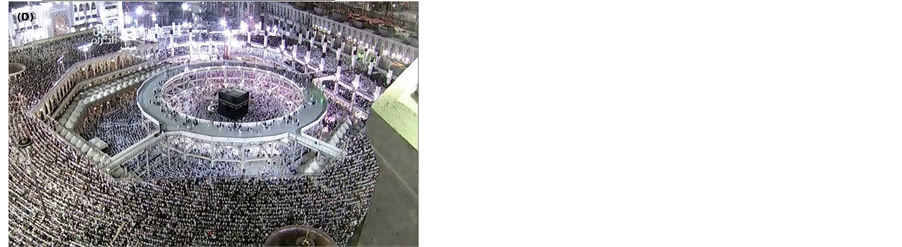
Figure 10. (A) CAD drawing displaying the geometry concept of the new walkway around the Kaaba; (B) Predtetschenski and Milinski fundamental diagram; (C) Mobile floor capacity according to Predtetschenski and Milinski densities; (D) The present mobile floor facility top view.

Table 1. The Mataf capacity at different simulation influxes.
-Desired velocity: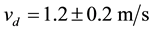 .
.
-Individual Radius:  (Milinski).
-Relaxation Time: .
.
• Geometry Parameters.
-Usable Area: .
.
-The mean Radius of the Mataf: .
.
-The mean pedestrian path: .
.
-The mean Tawaf path: .
.
-The Tawaf time:  with average walking velocity
 .
.
4.2.2. Results
In Table 1, the maximum number of pedestrians on the Mataf without clogging is 8404 with a density of 2.37 persons/m2. The optimal capacity without clogging is 11,726 pilgrims per hour completing the Tawaf, calculated with an average Tawaf duration of 43 min.
The maximum number of pedestrians on the Mataf was 11,629 with a density of 2.79 persons/m2. The optimal capacity without clogging was 16,226 Tawaf/hour, calculated with an average Tawaf duration of 43 minutes. If one Tawaf is 50 minutes then the capacity of the Mataf will be 13,954 Tawaf/hour.
5. Mataf Capacities Estimation
According to the Predtetschenski and Milinski fundamental diagram Figure 10(B), the capacity of the mobile Mataf was determined. The results of this investigation are illustrated in Table 2. The capacities of the mobile floor were computed with respect to different pedestrian densities. Every density in the fundamental diagram is related to a certain velocity. With help of these given velocities we tried to calculate the mean average time for one complete Tawaf. Afterwards we calculated the capacity of the Mataf. We can see that the optimal capacity is about 12,000 Tawaf/hour, (see Figure 10(C)). This result consistent with the simulation result which is about 13,954 pilgrims per hour completing the Tawaf.
6. Recommendations for the Future Hajj Planning and Development
With the increasing number of pilgrims every year and with the dramatic evolution of the transportation system in the world, the design and architecture of the Haram mosque in Mecca must be changed to increase the capacity, throughput and performance. The proposed and evaluated design has a specific aim, the safety of pilgrims. In order to ensure that the proposed design satisfies the required criteria of pilgrims safety, especially during overcrowding, many simulations and tests were realized to access the critical points in the Mataf area. The new Mataf area was designed to satisfy the international standard criterion of pedestrians safety, especially during overcrowding. The flow of pilgrims is demanding, since any accumulation in this area can be dangerous and has fatal consequences. The new proposed design offers a significant improvement to the safety of pilgrims. The limited spatial possibilities in and around the Haram area for infrastructural development requires an in- depth analysis and search for solutions to solve the problem of pedestrian flow. From this the concept arises to build a temporary Mataf to take a small capacity from the ground Mataf as best arrangements during the massive extension project in Masjid Al-Haram.
The Mataf area is a very restrained plain. The construction of the temporary Mataf within Masjid Al Haram should attempt to resolve many problems to avoid a potential disaster in the future, such as the overcrowding disaster at the Jamarat bridge in 2005. The conceptual design as we can see in Figure 11 has two problems; the first problem concerns the fluidity of the movement on the platform especially at the exits, the second problem concerns the ground Mataf in that the fluidity of pedestrian flow will be disturbed through the pillars carrying
Table 2. Mataf capacities according to Predtetschenski and Milinski densities.
Figure 11. The new walk way around the Kaaba is definitely taking shape in this picture (26.07.2013), c SkyscraperCity.
the platform. The Haram building must ensure the international norm of safety to allow the increasd number of pilgrims.
To prevent stampede and congestion within the Mataf area during the rush hour of the Hajj events a sufficient study and analysis of the expected inflows and outflows (and, hence, number of pilgrims) must be ascertained and documented, considering the alternation possibility of large pedestrian flows. A narrow passage and bottleneck analysis within the Haram mosque area is crucial for any decision making. Through exact simulation and analysis of pedestrian fluidity on the Haram area the congestion points as the intersection or crossing points must be established and should be removed. Either the passages with counter flow must be detected as early as possible and carefully treated (examined). This analysis can be used to assess the potential safety hazards and can be helpful for the organizers. As critical points the exits of the Haram must be checked. The passage between the Mataf area and the Massaa area and between the pillars of the temporary Mataf can cause problems for the fluidity of the pilgrim streams.
For the safety of all pilgrims on the Haram area and to ensure a quick and effective response to any occurring problems a sophisticated and continuously monitoring system (e.g. video surveillance) must be established.
An engineering system must be developed within the Haram to allow the security and emergency forces to move as quickly as possible and unobstructed to any place if something happens, to remove or at least mitigate problems.
The main problem in Mecca itself are the traffic jams. The high density of cars and buses combined with walking or road crossing pedestrians make the situation more complex for rescue or evacuation plans. The possi- bility to be stampeded at Hajj pilgrimage is very high at all places and especially inside the Haram in Mecca, in Muzdalifa, at the Jamarat and on the streets between the so called points of interest.
The changes necessary for a successful Hajj and its activities are all contained in the wider long-term plan for Mecca. The next expansion for Haram and Massaa requires a new infrastructure and regeneration of the east end -which will reclaim old neighbourhoods to Haram for housing and parking area-which is a huge project.
7. Conclusions and Possible Enhancements
A newly developed simulation software for analysing pilgrim movement was used for the evaluation of the Tawaf capacity of the Mataf area and the new mobile floor. Different scenarios were analysed to find out the optimal capacity. With a flux of only 12 pilgrim/min entering the floor, much space was left unused. Pilgrims moved with their desired speed and the average time for completing a Tawaf took around 25 minutes. The second scenario showed 108 pilgrim/min entering the floor, causing the space to become fully occupied by pilgrims and the velocity to decrease, resulting in dangerous jams especially in the exit area. The third scenario showed the optimum steady state when about 125 pilgrim enter per minute and also exit the floor, with no jams. This results in an overall capacity of about 9000 finished Tawaf/hour and an average time of approximately 25 min to complete the Tawaf.
This work is an attempt to model high density crowd dynamic flows in autonomous and controlled scenarios. A microscopic approach was used to model this problem based on observed collective behaviour in emergency conditions, where the detailed design of interactions is overlapped by group behaviour. We presented a simple means of achieving more complex behaviour in both indoor and outdoor environments. The simulation tools produce results that compare favourably with the real data.
As a practical example, the Haram Mosque in Mecca and the Jamarat Bridge in Saudi Arabia were used for high density crowd simulation: the huge number of pilgrims cramming the bridge during the pilgrimage to Mecca caused serious pedestrian disasters in the 90’s. Moreover, the analytical and numerical study of the qualitative behaviour of human individuals in a crowd with high densities can also improve traditional socio- biological investigation methods.
For obtaining empirical data different methods were used, automatic and manual methods. We analysed video recordings of the crowd movement in the Tawaf within the mosque in Mecca during the Hajj of the 27th of November, 2009. We evaluated unique video recordings of a 105 × 154 m large Mataf area taken from the roof of the Mosque [12] .
For the validation and calibration of the simulation tools, different methods were used [14] . At medium to high pedestrian densities, the techniques used in PedFlow can produce realistic crowd motion, with pedestrians moving at different speeds and under different circumstances, following believable trails and taking sensible avoidance action.
As possible future work, we would like to have a better understanding of the parameters influencing the crowd behaviour such as the ethnic and psychological parameters. These parameters have a significant impact on the movement of crowds especially in panic situations. The psychological-physiological parameters in the case of riots or emergencies must be investigated further and documented so that they can be implemented into other models. Our proposed approach to simulate crowd behaviours in the future is based on this dichotomy, and we propose separate models for an agent’s personality and another one to account for situational factors. This question arises and opens the door to many topics that must be further investigated. There are certain things we can do to help a high density crowd participant like pilgrims, sport or music event spectators to survive a stressful situation, by planning, preparation, training and better management. But this is not sufficient to make sure that hundred percent of the crowd are safe, if we consider the number of accidents happened in the last decade.
Acknowledgements
I would like to express my sincerest thanks and gratitude to Prof. Dr. G. Wunner for a critical reading of the manuscript, for his important comments and suggestions to improve the manuscript. Many thanks to Dr. H. Car- tarius for his support during writing this work. This work was supported by the German Research Foundation (DFG) within the funding programme Open Access Publishing.
References
- Helbing, D., Farkas, I.J., Molnar, P. and Vicsek, T. (2002) Simulation of Pedestrian Crowds in Normal and Evacuation Situations. In: Schreckenberg, M. and Sharma, S.D., Eds., Pedestrian and evacuation dynamics, Springer, Berlin, 21- 58.
- Fukui, M. and Ishibashi, Y. (1999) Self-Organized Phase Transitions in CA-Models for Pedestrians. Journal of the Physical Society of Japan, 8, 2861-2863. http://dx.doi.org/10.1143/JPSJ.68.2861
- Muramatsu, M. and Nagatani, T. (2000) Jamming Transition in Two-Dimensional Pedestrian Traffic. Physica A: Statistical Mechanics and Its Applications, 275, 281-291.
- Yuhaski, S.J. and Smith, J.M. (1989) Modeling Circulation Systems in Buildings Using State Dependent Queueing Models. Queueing Systems, 4, 319-338. http://dx.doi.org/10.1007/BF01159471
- Treuille, A., Cooper, S. and Popovic, Z. (2006) Continuum Crowds. ACM Transactions on Graphics, 25, 1160-1168. http://dx.doi.org/10.1145/1141911.1142008
- Helbing, D. (2001) Traffic and Related Self-Driven Manyparticle Systems. Reviews of Modern Physics, 73, 1067-1141. http://dx.doi.org/10.1103/RevModPhys.73.1067
- Löhner, R. (2010) On the Modeling of Pedestrian Motion. Applied Mathematical Modelling, 34, 366-382. http://dx.doi.org/10.1016/j.apm.2009.04.017
- Pecol, P., Argoul, P., Dal Pont, S. and Erlicher, S. (2013) The Non-Smooth View for Contact Dynamics by Michel Fremond Extended to the Modeling of Crowd Movements. Discrete and Continuous Dynamical Systems―Series S (DCDS-S), AIMS, 6, 547-565.
- Campus Police (2013) General Evacuation Procedures. Technical Report, Oxford College of Emory University, Oxford. http://oxford.emory.edu/life-at-oxford/campus-police/fire-safety/general-evacuation-procedures/
- Saudi Arabia Government (2013) Makkah City Profile. http://www.the-saudi.net/saudi-arabia/makkah/makkah_city_pro-file.htm
- Ministry of Hajj, Saudi Arabia (2013) Supreme Hajj Committee. http://haj.gov.sa/en-us/pages/default.aspx
- Dridi, M.H. (2015) Tracking Individual Targets in High Density Crowd Scenes; Analysis of a Video Recording in Hajj2009. Current Urban Studies (CUS), 3, 35-53.
- Predtechenski, W.M. and Milinski, A.I. (1971) Personenströme in Gebäuden. Verlagsgesellschaft Rudolf Müller, Köln.
- Dridi, M.H. (2014) Pedestrian Flow Simulation Validation and Verification Techniques. arXiv:1410.0603 [physics.data-an]