International Journal of Geosciences Vol.06 No.03(2015), Article
ID:54602,20 pages
10.4236/ijg.2015.63015
Integrated Landsat Imagery and Geophysical Exploration for Groundwater Potential Evaluation of Okene and Its Environs, Southwestern Nigeria
John Olurotimi Amigun1, Richard Ajibola Faruwa1, Akinola Adesuji Komolafe2
1Department of Applied Geophysics, Federal University of Technology Akure, Akure, Nigeria
2Department of Remote Sensing and Geoscience Information System, Federal University of Technology Akure, Akure, Nigeria
Email: johnamigun@yahoo.com, ajibola.faruwa@gmail.com, komolafeakin@yahoo.com
Copyright © 2015 by authors and Scientific Research Publishing Inc.
This work is licensed under the Creative Commons Attribution International License (CC BY).
http://creativecommons.org/licenses/by/4.0/


Received 10 February 2015; accepted 8 March 2015; published 12 March 2015
ABSTRACT
In this study, an integrated remote sensing and geophysical (aeromagnetic and geo-electric) methods was employed to assess the potential of groundwater in a basement complex terrain of Okene and its environs, Southwestern, Nigeria. Landsat imagery acquired over the study area was processed in the Geographic Information Systems (GIS) environment to delineate the surface lineaments, drainage networks and their orientations. Aeromagnetic data over the area were analyzed and its derivative maps were interpreted to further map the structures and the geology in the subsurface; depths to magnetic sources were determined using spectral analysis. Vertical Elec- trical Sounding (VES) of geo-electric method was interpreted to map the subsurface geology layers. The results of the integrated data were correlated with borehole yield data of the area for effective interpretation. Delineated lineaments from the azimuth, frequency plot showed dominant trends in the NE-SW and NNE-SSW directions. Radial average power spectrum revealed the depth to mag- netic sources between 100 and 2500 m and the interpreted VES data characterized the area into three to four subsurface layers. In correlating the results with borehole yield data, the zones with high lineament density and low/negative magnetic anomaly were categorized as high groundwater potential zones while areas with low lineament density and high/positive magnetic anomaly as low groundwater potential zones. This study will guide efficiently subsequent groundwater drilling program in the study area.
Keywords:
Groundwater, Basement Complex, Aeromagnetic, Geo-Electrics, Remote Sensing, GIS
1. Introduction
Groundwater is one of the most valuable natural resources on the earth surface and serves as one of the main sources of drinking water. The assessment and development of groundwater at both local and regional level re- quires multidisplinary approaches, with various data sources. Being a subsurface geological phenomenon with some surface evidences, both surface and subsurface approaches are necessary for its exploration, exploitation and management [1] . The surface approaches such as surface geological mapping, remote sensing data analysis, geomorphological and hydrological characteristics, lineament and structural identification plays important role in identifying probable zones for locating this all importance resource. The results of the direct surface methods are often followed up by subsurface probing methods such as hydrogeological geophysical and drilling tech- niques. Integration of these methods have been proven to provide rapid and cost effective mapping of ground water potential zones in most regions of the world. Apart from the application methods for exploring this resource, its availability depends on various geological factors such as rock types, existence of lineaments and structures suitable for accumulating the resources, hydrological and hydrogeological factors. All these are dependent on the type of geological terrains in consideration for the exploration. In typical basement complex areas such as the study area, the occurrence of groundwater in recoverable quantity as well as its circulation is controlled by geological factors i.e. faults, joints and fracture zones [2] [3] . The delineation of these features is very essential for better understanding of the subsurface geology of these areas in term of their groundwater potential. Therefore to target potential bedrock aquifers that can give copious supply of groundwater in these areas, the aforementioned geologic features must be intercepted by boreholes.
In Okene and its environs, the delineation of geologic features i.e. faults, joints and fracture zones of their low permeability rocks is thus a challenging task as numerous unsuccessful boreholes have been drilled within these areas. Meanwhile, their inhabitants depend solely on surface water from few available streams and hand dug wells for their domestic use, and such sources are highly vulnerable to pollution. Besides, the rapid population growth in the study area has also made these sources of water inadequate for its dwellers.
Integrated Landsat imagery and geophysical methods have been used for the investigation of groundwater in similar basement environment in Nigeria and elsewhere with remarkable success [4] -[7] . Remote sensing and airborne geophysical methods are used for the reason of their cost effectiveness, their ability to access difficult areas and because their data can be collected frequently and rapidly over large scale area. In addition, airborne geophysical methods can furnish broad composite images of the subsurface over large areas at relatively lower cost and higher speed. Therefore, in this work geophysical methods comprising aeromagnetic and electrical resistivity combined with remote sensing technique are used with the objectives of delineating structures/linea- ments i.e. faults, fractures, joints/shear zones associated with the study area, determining their trend/pattern, drainage network, depth to magnetic sources and geoelectric parameters of subsurface layers in order to evaluate the study area groundwater potential.
2. The Study Area
The study area lies within latitude 7˚30'N to 8˚00'N and longitude 6˚E to 6˚30'E. It falls within the 1:100,000 standard topographic map of Kabba sheet 246 and is accessible by road from the north through Abuja the Federal Capital of Nigeria and the south through Kabba (Figure 1). It has an annual rainfall of between 1100 mm and 1300 mm. The various streams and springs around the study area are seasonal in nature with a complex network of dendritic drainage pattern. The rivulets in the area are numerous and they empty into rivers Osse, Osara and Omyi located within. Its climate favours a forest savannah type of vegetation that consist of scattered trees and tall grass [8] .
Fig 1: Location Map of Okene and its Environs
The Geology of Nigeria according to Obaje [9] is made up of three major geological components (Figure 2); 1) Basement Complex which is Precambrian in age (>+600 million years), 2) Younger Granites i.e. Jurassic (200 - 145 million years) and 3) Sedimentary Basins i.e. Cretaceous to Recent (<145 million years). Nearly one half of the country is underlain by basement complex including the younger granite while the other half comprises of the sedimentary terrain [10] . The basement complex of Nigeria forms a part of the Pan-African mobile belt and lies between the West African and Congo cratons and south of the Tuareg shield [11] . It is intruded by the

Figure 1. Location map of Okene and its environs.
Mesozoic calc-alkaline ring complexes (younger granites) of the Jos plateau and is unconformably overlain by Cretaceous and younger sediments.
The Nigeria basement complex according to [12] -[14] consists of the following main groups of rocks: 1) Migmatite-Gneiss Complex (migmatites, gneisses, granite-gneisses), 2) Metasedimentary and Metavolcanic rocks (phylites, schists, pelites, quartzites, marbles, amphibolites), 3) Older Granites (granites, granodiorites, syenites, monzonites, gabbro, charnockites) and 4) Undeformed Acid and Basic Dykes (muscovite-, tourmaline- and beryl-bearing pegmatites, applites and syenite dykes; basaltic, doleritic and lampropyricdykes).
4. Geology Setting of Okene and Its Environs
The study area as shown in Figure 3 is located in the Precambrian basement rocks in which a migmatite-gneiss complex rock is associated with series of metasedimentary rocks and older granite. The dominant lithologic units in the study area are gneisses (which are regionally emplaced), ferruginous quartzites, granites and pegmatite [15] -[17] .
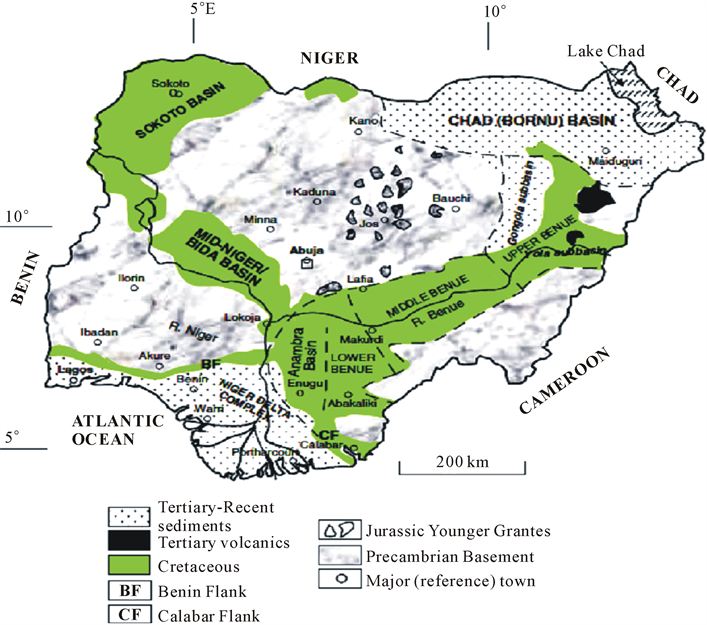
Figure 2. Geological map of Nigeria showing the major geological components (after Obaje et al. 2009).

Figure 3. Geological map of the Okene-Lokoja iron province. The insert shows the study area. (Modify after Fadare, 1983).
5. Remote Sensing Data
The Landsat thematic mapper imagery LANDSAT 5-TM used for this study was downloaded with path 189 and row 055 of the year 2006 from the Global Land Cover Facility homepage [18] . The raw data were geo-refe- renced by applying the Universal Tranverse Marcator (UTM) and afterward subset with the coordinates of the topographic sheets i.e. Kabba sheet 246 that covers the study area.
Remote Sensing Data Processing and Analysis
Image processing, enhancement and spectral analysis were carried out on the LANDSAT 5-TM imagery using ILWIS 3.2 software. To obtain the resulting imagery in Figure 4, the image enhancement operations performed

Figure 4. Landsat imagery over Okene and its environs showing colour composite of RGB 321.
include contrast stretching, spatial filtering i.e. edge detection and colour composite [19] -[21] . These were done to enhance sharpness of the satellite image for better visual clarification and to aid structural interpretation. Similarly, ArcGis 9.2 software was used to extract the lineaments and drainage network that covers the study area [22] [23] . The results of the satellite image analysis i.e. lineaments map and drainage network derived from LANDSAT 5-TM imagery are shown in Figure 5(a) and Figure 5(b) respectively. A total of 361 lineaments were extracted from the satellite image having a total length of 484.01 km. The rose (azimuth-frequency) diagram of the lineaments (Figure 6) prepared from the extracted lineaments shows the following trends: NE-SW, NNE-SSW, E-W, NNW-SSE and N-S directions. The NE-SW and NNE-SSW directions are the major trends in
 (a)
(a) (b)
(b)
Figure 5. (a) Lineament map of Okene and its environs; (b) Drainage networks map of Okene and its environs.
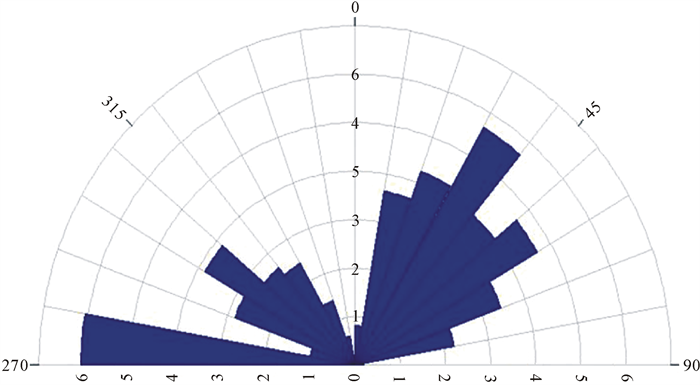
Figure 6. Rose (azimuth-frequency) diagram of lineaments orientations.
the area. The drainage network map in Figure 5(b) was superposition on the lineament map (Figure 5(a)) to produce a synthesis map (Figure 7). Its interpretation shows that the drainage network in the study area is struc- turally controlled.
6. Aeromagnetic Data
The aeromagnetic data used in this study were acquired by Fugro airborne survey services for the Nigeria Geological Survey Agency. It has line spacing of 400 m and flight lines direction of NW-SE at terrain clearance of 152.4 m. Afterward the removal of the International Geomagnetic Reference Field (IGRF), the data were gridded using minimum curvature gridding method with 125 m cell size to produce the total magnetic intensity (TMI) map in Figure 8.
The TMI map reveals the magnetic intensity distribution over the study area typified by low/negative and high/positive magnetic anomalies with values ranging from −119.37 to 179.46 nT. The map (Figure 8) was analyzed and interpreted in an attempt to delineate and characterize the subsurface structures in the area. The northeastern and southwestern parts of the study area are characterized by low magnetic field values and longer wavelength magnetic anomalies. According to [24] [25] , a low/negative magnetic peak values in low latitude magnetic region (specifically around the equator of which Nigeria is situated) represent typical anomalous signatures for faults and fracture zones. Therefore these areas may probably indicate fractured/faulted basement rocks. And frequently, groundwater flow through aquifers is influenced by the location of such structures i.e. fractures/faults which act as channels for its flow and distribution.
6.1. Aeromagnetic Data Analysis and Interpretation
The total magnetic intensity (TMI) data were further analyzed to improve the quality of the magnetic data and enable easier identification of fault, fracture and contact features [26] -[28] that might control the study area groundwater accumulation and flow. The derivative maps produced from the TMI enhancement procedures include upward continuation, downward continuation and second order vertical derivative.
6.1.1. Upward Continuation
The upward continuation filter operation allows the transformation of potential field data measured on one surface to some higher surface [29] i.e. in the case of this study from flight height of 152.4 m to higher height of 500 m (Figure 9(a)). This is expressed as;
 (1)
(1)
where h is distance in ground units and r is wavenumber in radians/m. The operation was realizable because its procedure retains mostly longer wavelengths at higher observation level while short-wavelength anomalies due

Figure 7. Synthesis map of lineaments and drainage network obtained after superposition of the lineament and drainage maps.

Figure 8. The total magnetic intensity map of Okene and its environs.
 (a)
(a) (b)
(b) (c)
(c)
Figure 9. (a) The upward continuation map of aeromagnetic data of Okene and its environs; (b) The downward continuation map of aeromagnetic data of Okene and its environs; (c) The second vertical derivatives map of aeromagnetic data of Okene and its environs.
to small size near surface structures and/or effect of cultural features were not resolved [30] .
The anomalies identified in the upward continuation derivative map (Figure 9(a)) are representative of magnetic properties of deep basement rocks and structures in the area. Hence, those magnetic anomalies of Ego, Chokochoko and Ogale are possibly as a result of deep seated regional structure.
6.1.2. Downward Continuation
For easy identification of short wavelength anomalies, the total magnetic intensity (TMI) data were downward continued to 20 m (Figure 9(b)). The process helps to maximize the response of formations and structures within the top few hundred meters of the crust, where groundwater reserves are concentrated. This filter is used with extreme caution as the shortest wavelengths and data noise are amplified exponentially [31] . Mathematically, it is given as;
 (2)
(2)
The derivative map (Figure 9(b)) shows the subtle short wavelength anomalies which are well pronounced when downward continued.
6.1.3. Vertical Derivative
The second vertical derivative map in Figure 9(c) was obtained by applying vertical derivative filter on the total magnetic intensity (TMI) data. This map allowed easier recognition of high frequency anomalies (shallow sour- ces) by removing series of deep anomalies represented by low frequency. It is expressed mathematically as;
 (3)
(3)
where n is the order of differential i.e. in this case its value is 2 and r is wavenumber in radians/m. Its anomaly patterns and trends (Figure 9(c)) and that of the downward continuation map (Figure 9(b)) were compared and found to correlate with the lineaments patterns and orientations in Figure 5(a) of the lineament map derived from the satellite imagery.
7. Spectral Analysis and Depth Estimation
The depth to top of geologic sources that produced the observed magnetic anomalies in the TMI map of the study area was determined using spectral analysis. In Figure 10(a), the calculated 2-D spectrum of the TMI data of the study area show the magnetic data to vary in frequency between 9.663 to 22.152 Hz. Its radially average power spectrum has shown a normal plot (Figure 10(b)) that has straight line segments which decreases in slope with increasing frequency. Radially averaged power spectra of magnetic data according to Blanco-Montenegro et al. [32] are expressed as function of wavenumber and are related to the depth to the bottom of the deepest magnetic source:
 (4)
(4)
zt and zb are depths to top and bottom of the magnetic sources respectively, K is a function of wavenumber, which is expressed in radians per unit distance. From the depth estimate curve (Figure 10(b)), the depths to the magnetic sources in the area ranged from 100 to 2500 m.
8. Electrical Resistivity Data
The critical idea of deploying electrical resistivity method of vertical electric sounding (VES) in this study was to delineate subsurface structures i.e. faults/fracture zones and being able to characterize subsurface layers. Noting that the weathered layer and weathered/fractured bedrock constitute the aquifer units in the study area, twenty four VES data with Schlumberger electrode configuration acquired from eight communities within the study area were interpreted and their sounding curves show three layer and four layer earth models. The three layers curves are characterized by H curve type while the four layers exhibits KH curve type. The H type is the most dominant curve type in the study area.
The interpreted subsurface layers include the top soil, weathered layer (which are clayey in some locations), weathered/fractured basement and fresh basement. Considering the result of the VES interpretation as
 (a)
(a)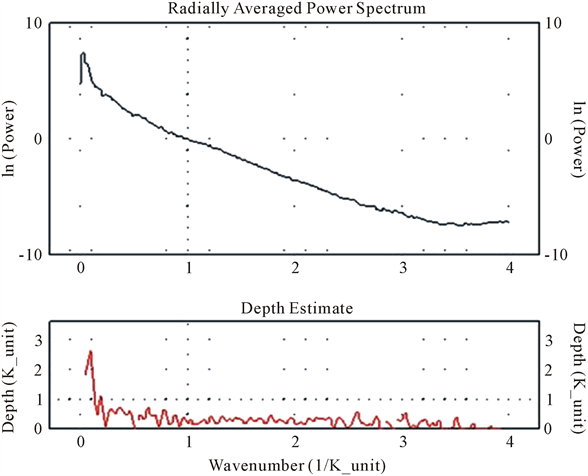 (b)
(b)
Figure 10. (a) The spectrum of the aeromagnetic data of Okene and its environs; (b) The radial average power spectrum of the aeromagnetic data of Okene and its environs.
represented using Figure 11, the thickness of the aquifer unit (weathered layer) varies enormously within the study area. Hence, it could be infer that the regions with greater thicknesses i.e. Ohakiti, Obangume and Ogaminana will yield more groundwater than the thin weathered regions i.e. Oduape and Osara.
9. Comparison of Results and Their Hydrological Implication
The satellite lineaments mapping, aeromagnetic intensity data analysis and interpretation of vertical electrical sounding results are known separately and collectively for their significant role in the delineation of potential sites for groundwater.
Comparing the synthesis map of lineaments/drainage network (Figure 7) and the total magnetic intensity (TMI) in Figure 8 (see Figure 12), the areas with high densities of lineament coincides majorly with low/nega- tive magnetic anomalies. This implies that the low/negative magnetic anomaly zones in the southwest, northeast and a small area in the central and southeastern part of the study area are good groundwater potential zones. The lineaments and the magnetic anomalies apart from their correlation in spatial location were also identified to have similar trend i.e. mainly NE-SW. These trends are indication of the direction of the geologic structures causing the magnetic anomalies and the general groundwater flowing direction. Consequently it can be inferred that the hydrologic system of the study area has a regional geological influence.
In addition, the areas with high densities of lineament and low magnetic intensity values were observed to coincide with the locations having thick weathered layer from the VES interpreted result. Based on the results of remote sensing and aeromagnetic data analyses, towns within the study area were categorized into three broad groundwater potential zones namely; high, medium and low (Table 1). The high zones were grouped base on high lineament density and low magnetic anomaly; medium zones were established on average lineament density and relative low magnetic anomaly; and the low zones based on low lineament density and high magnetic anomaly. A groundwater potential map of the study area (Figure 13) was further generated with the aids of Table 1 and the borehole yield data (Table 2) i.e. obtained in some localities within the study area.
10. Conclusions
The groundwater potential of the study area has been investigated successfully. Lineaments and drainage networks of the area were extracted and the azimuth-frequency plot of the lineaments shows dominant trends in the NE-SW and NNE-SSW directions.
The total magnetic intensity map (TMI) of the area was characterized by low/negative and high/positive magnetic anomalies. The TMI derivative maps i.e. upward/downward continuation and second order vertical

Figure 11. Bar chart plot of representative average weathered layer thickness of the study area generated from VES interpretation result.

Figure 12. Synthesis of lineaments, drainage network and total magnetic intensity maps of the study area.

Figure 13. Groundwater potential map of Okene and its environs.

Table 1. The distribution of towns in the study area into different categories based on lineament densities.
Table 2. Average borehole yield obtained in parts of the communities in the study area.
derivative allowed easier recognition of magnetic anomalies. The depth to magnetic sources in the area as determined from the magnetic interpretation range from 100 to 2500 m. The VES interpretation result delineates the area into three to four subsurface layers. The weathered layer and weathered/fractured bedrock constitute the aquifer units. In correlating all the results, the study area is categorized into three broad groundwater potential zones, namely high, medium and low groundwater potential zones.
References
- Senthil Kumar, G.R. and Shankar, K. (2014) Assessment of Groundwater Potential Zones Using GIS. Frontiers in Geosciences, 2, 1-10.
- Olorunfemi, M.O. and Fasuyi, S.A. (1993) Aquifer Types and the Geoelectric/Hydrogeologic Characteristics of Part of the Central Basement Terrain of Nigeria (Niger State). Journal of African Earth Sciences, 16, 309-317. http://dx.doi.org/10.1016/0899-5362(93)90051-Q
- Amadi, A.N. and Olasehinde, P.I. (2010) Application of Remote Sensing Techniques in Hydrogeological Mapping of Parts of Bosso Area, Minna, North-Central Nigeria. International Journal of the Physical Sciences, 5, 1465-1474.
- Pokharel, S.B. (2007) Remote Sensing and GIS Analysis of Spatial Distribution of Fracture Patterns in the Makran Accretionary Prism, Southeast Iran. Geosciences (Georgia State University) Theses, Paper 8. http://digitalarchive.gsu.edu/geosciences_theses/8
- Ayodele, O.S. and Odeyemi, I.B. (2010) Analysis of the Lineaments Extracted from LANDSATTM Image of the Area around Okemesi, South-Western Nigeria. Indian Journal of Science and Technology, 3, 31-36.
- Anudu, G.K., Essien, B.I., Onuba, L.N. and Ikpokonte, A.E. (2011) Lineament Analysis and Interpretation for As- sessment of Groundwater Potential of Wamba and Adjoining Areas, Nasarawa State, North-Central Nigeria. Journal of Applied Technology in Environmental Sanitation, 1, 185-198.
- Okereke, C.N., Onu, N.N., Ibe, K.K., Selemo, A.O.I., Opara, A.I., Ikoro, D.O., Ibeneme, S.I. and Oha, I.A. (2012) Analysis of Landsat and Aeromagnetic Data for Mapping of Linear Structures: A Case Study of Yola Area, Upper Benue Trough, Nigeria. International Journal of Engineering Research and Applications (IJERA), 2, 1968-1977.
- National Steel Raw Materials Exploration Agency, NSRMEA (1994) Preliminary Report on Ajabanoko Iron Ore De- posit. Unpublished.
- Obaje, N.G. (2009) Geology and Mineral Resources of Nigeria. Springer, Dordrecht Heidelberg London New York, 221 p.
- Rahaman, M.A. (1988) Recent Advances in the Study of the Basement Complex of Nigeria. In: Precambrain Geology of Nigeria, Geological Survey of Nigeria Publication, 11-43.
- Black, R. (1980) Precambrian of West Africa. Episodes, 4, 3-8.
- Rahaman, M.A. and Ocan, O. (1978) On Relationship in the Precambrian Migmatite-Gneiss of Nigeria. Journal of Mining and Geology, 15, 23-30.
- Rahaman, M.A. and Lancelot, J.R. (1984) Continental Crust Evolution in SW Nigeria: Constraints from U/Pb Dating of Pre-Pan-African Gneisses. In: Rapport d’activite 1980-1984, Documents et Travaux du Centre Geologique et Geophysique de Montpellier, 4, 41.
- Dada, S.S. (2006) Proterozoic Evolution of Nigeria. In: Oshi, O., Ed., The Basement Complex of Nigeria and Its Mineral Resources (A Tribute to Prof. M. A. O. Rahaman), Akin Jinad & Co., Ibadan, 29-44.
- Olade, M.A. (1978) General Features of a Precambrian Iron Deposit and Its Environment at Itakpe Ridge Okene, Nigeria. Transactions of Institution of Mining and Metallurgy, Section B, 87, 81-89.
- Fadare, V.O. (1983) Iron Ore Formation―The Okene-Ajaokuta-Lokoja Areas of Kogi State. A Potential Supply Base for Steel Plant at Ajaokuta. Journal of Mining and Geology, 20, 209-214.
- Annor, A.E. and Freeth, S.J. (1985) Thermo-Tectonic Evolution of the Basement Complex around Okene, Nigeria with Special Reference to Deformation Mechanism. Precambrian Research, 28, 269-281. http://dx.doi.org/10.1016/0301-9268(85)90034-8
- http://glcfapp.glcf.umd.edu:8080/esdi/index.jsp
- Leica Geosystems (1999) ERDAS Field Guide. 5th Edition, ERDAS, Inc., Atlanta.
- Lillesand, T.M. and Kiefer, R.W. (2000) Remote Sensing and Image Interpretation. John Wiley & Sons, New York.
- ITC (2001) Academic User’s Guide: International Institute for Aerospace Survey and Earth Sciences. Enschede.
- Dehls, J.F., Cruden, A.R. and Vigneresse, J.L. (1998) Fracture Control of Late Archean Pluton Emplacement in the Northern Slave Province. Journal of Structural Geology, 20, 1145-1154. http://dx.doi.org/10.1016/S0191-8141(98)00055-8
- Masoud, A. and Koike, K. (2006) Tectonic Architecture through Landsat-7 ETM+/SRTM DEM-Derived Lineaments and Relationship to the Hydrogeologic Setting in Siwa Region, NW Egypt. Journal of African Earth Sciences, 45, 467- 477. http://dx.doi.org/10.1016/j.jafrearsci.2006.04.005
- Parasnis, D.S. (1986) Principles of Applied Geophysics. Chapman Hall, London, 43-44.
- Fieberg, F.C. (2002) Ground Magnetic Investigations for Gold Prospecting in South-Western Nigeria. 62th Meeting of the German Geophysical Society, Hannover, 4 February 2002, 20.
- Hood, P.J. and Teskey, D.J. (1989) Aeromagnetic Gradiometer Program of the Geological Survey of Canada. Geophysics, 54, 1012-1022. http://dx.doi.org/10.1190/1.1442726
- Aboud, E., Goussev, S., Hassan, H., Supriyanto, S. and Ushijima, K. (2005) Horizontal Gradient and Band-Pass Filter of Aeromagnetic Data Image of Subsurface Structure. Example from Esh El Mellaha Area, Gulf of Suez, Egypt. Proceedings of the SEG/EGS/EPEX/EPA International Conference, Cairo 2005: Imaging the Future, Cairo, 16-19 May 2005, 1-5.
- Falebita, D.E., Olorunfemi, M.O. and Ojo, J.S. (2011) An Appraisal of the Geologic Structure beneath the Ikogosi Warm Spring in South-Western Nigeria Using Integrated Surface Geophysical Methods. Earth Sciences Research Journal, 15, 27-34.
- Nabighian, M.N., Grauch, V.J.S., Hansen, R.O., LaFehr, T.R., Li, Y., Peirce, J.W., Phillips, J.D. and Ruder, M.E. (2005) The Historical Development of the Magnetic Method in Exploration. Geophysics, 70, 33-61. http://dx.doi.org/10.1190/1.2133784
- Roest, W., Verhoef, J. and Pilkington, M. (1992) Magnetic Interpretation Using the 3-D Analytic Signal. Geophysics, 57, 116-125. http://dx.doi.org/10.1190/1.1443174
- Grant, F.S. and West, G.F. (1965) Interpretation Theory in Applied Geophysics. McGraw Hill Book Co., New York, 584.
- Blanco-Montenegro, I., Torta, J.M., Garcia, A. and Arana, V. (2003) Analysis and Modelling of the Aeromagnetic Anomalies of Gran Canaria (Canary Islands). Earth and Planetary Science Letters, 206, 601-616. http://dx.doi.org/10.1016/S0012-821X(02)01129-9