International Journal of Geosciences
Vol.5 No.6(2014), Article ID:45708,9 pages DOI:10.4236/ijg.2014.56053
Physicochemical Properties of Sewage Sludge from Gaza
Ibrahim Y. El-Nahhal1, Husam Al-Najar1, Yasser El-Nahhal2
1Faculty of Civil Engineering, The Islamic University Gaza, Gaza Strip, Palestine
2Faculty of Science, The Islamic University Gaza, Gaza Strip, Palestine
Email: y_el_nahhal@hotmail.com
Copyright © 2014 by authors and Scientific Research Publishing Inc.
This work is licensed under the Creative Commons Attribution International License (CC BY).
http://creativecommons.org/licenses/by/4.0/


Received 15 March 2014; revised 12 April 2014; accepted 1 May 2014
ABSTRACT
This study characterized the physicochemical properties of sewage sludge collected from Gaza wastewater treatment plant. Sludge samples were collected from the drying beds, air-dried, sieved through 2 mm and stored in plastic bags at room temperature. Sludge density, particle size distribution, water holding capacity, void volume, pH, EC, total organic carbon and hydrophobicity were determined. Results showed the bulk density is about 1.18 g/cm3 whereas the real density is 2.12 g/cm3 and void volume is 50%; Particle size distribution showed that the major size of sludge is sand-like size (630 - 200 µm) and the minor size is silt-like size (200 - 20 µm) and clay-like size is less than 20 µm. Sludge has an acidic pH reaction (6.78 ± 0.02) with an electric conductivity equal to (2.49 ± 0.04) mS∙cm−1. The hydrophobicity of sludge is very high, water drop penetration time (WDPT) is 114.77 ± 18.78 sec with a radius of 0.44 ± 0.08 cm. In the way around, oil drop penetration time (ODPT) of sludge is 5.05 ± 1.28 sec with a radius of 1.25 ± 0.14 cm. The WDPT/ODPM ration has very high value 22.73 indicating extreme hydrophobicity. High value of hydrophobicity may reduce water filtration in soil when sludge applied for agriculture. These results suggest that sludge application to soil may change the physicochemical properties of soil.
Keywords:Sludge, Hydrophobicity, Bulk Density, Particle Size, Water Holding Capacity, Void Volume

1. Introduction
Gaza Strip (GS) has a coastline of 40 km at the eastern extreme of the Mediterranean and on the edge of the Sinai Desert. GS has a total area of 365 square kilometers (MOPIC, 1998) and the population is estimated to be around 1,500,000 people. Sludge (biosolids) may be defined as the matter which refers to the residual, semisolid material left from industrial wastewater, or sewage treatment plants. When fresh sewage or wastewater is added to a settling tank, approximately 50% of the suspended solid matter may settle out in a few hours. The collection of the above mentioned solids may be known as raw sludge [1] . Sludge may be dried and incorporated with some carbonaceous materials to produce a suitable composted material for the use in the agriculture to increase the production and improve the soil properties.
Chemical and biological compositions of sewage sludge depend on the wastewater composition [2] . Usually, it is rich in Organic Mater (OM) and plant nutrients such as nitrogen (N), phosphorus (P) and calcium (Ca) [3] and may improve soil physical, chemical and biological properties, such as porosity, aggregate stability, bulk density, soil fertility, water movement and retention [4] . There are four wastewater disposal and treatment facilities in Gaza strip, Beit Lahia (BLWWTP), Gaza City (GWWTP), Khan Younis (KHYWWTP), and Rafah (RWWTP), but none of them is functioning effectively [5] . They are not sophisticated treatment technology and they consist of anaerobic lagoons, aerated lagoons and maturation ponds. GWWTP is the only treatment facility which has trickling filters. The effluent from Gaza and Rafah treatment plants is mostly discharged into the Mediterranean Sea. In the case of the Beit Lahia wastewater treatment plant, a substantial quantity of wastewater infiltrates into the ground, contaminating soil and groundwater in the area. High level of nitrate has recently been detected from the aquifer, and it is most likely that the excess effluent is responsible for the deterioration of the water quality of the aquifer [6] . The GWWTP is located in Sheikh Ejleen Area southern Gaza city. It is expected that, large amounts of sludge are being produced from Gaza wastewater treatment plants. Previous study [7] reported that huge quantities of sludge (30,000 ton) were produced annually and this required a minimum of 30,000 dunums for its accumulation. Koenig et al., [8] studied the following physical and geotechnical properties: 1) vane shear strength; 2) consolidation characteristics such as compression index, compressibility factor, coefficient of consolidation and compressibility coefficient; and 3) hydraulic characteristics such as permeability and intrinsic resistance. They found that predictive logarithmic relationships may be established among the tested properties. In the same context, Mikkelsen and Keiding [9] investigated correlations between sludge composition, structure and dewatering properties and found out that the fraction of extracellular polymeric substances in sludges was the most important parameter with respect to sludge structure.
The mechanical properties of dewatered sewage sludge were previously investigated [10] . He found that moderately digested sludge material has a typical specific gravity of solids value of 1.55, and loss on ignition (LOI) value of 70% dry mass, while strongly digested sludge has a lower LOI value of 55% dry mass, and a higher specific gravity of solids value of about 1.72. Recent study [11] investigated the effects of acid pretreatment (pH 6-1) using HCl on subsequent digestion and dewatering of waste activated sludge (WAS). They concluded that pretreatment with pH 2 was the most effective. This yielded the same biogas after 13 days as compared to untreated WAS at 21 days digestion. They suggested that in dewatering process, the acid pretreated WAS required 40% less cationic polymer addition to achieve the same cake solid content. Accordingly, the current study is designed to characterize the physicochemical properties of sludge produced in GWWTP.
2. Materials and Methods
2.1. Sludge Sampling
A representative sludge samples with a volume of 20 L each were collected from different locations from the drying beds in the Sheikh Ejleen Waste Water Treatment Plant.
The samples were air-dried in the month of June using solar radiation, crushed and mixed together to insure homogeneity of the sludge. The dried sludge samples were sieved through 2 mm sieve and mixed again and kept in plastic bags for further experimental work.
2.2. Sludge Dry Mass and Water Content
With slight modification of Wilke method [12] , the sludge dry mass and water content were determined as follows. Air dried sludge samples were dried at 105˚C ± 5˚C for 24 h. Then the samples were transferred to a quick fit glass jar for cooling to avoid humidity absorbance. The samples were then weighted at room temperature to collect the dry weight. The differences in masses before and after drying are a measure for the water content of sludge. The water content was calculated on gravimetric (g water/g sludge) or on volumetric basis (cm3 water/cm3 sludge).
2.3. Water Holding Capacity
With a slight modification to the procedure described by El-Nahhal et al. [13] , columns techniques were used. In this technique, 0.5 L of air dried sludge was transferred to small columns with 10 cm diameter. The columns were irrigated with 0.25 L with distilled water and left for 24 h to equilibrium. The sludge samples were weighted before and after irrigation to collect the water content. The leachate was collected and weighted to know the equilibrium water capacity of the columns.
2.4. Bulk Density
The bulk density was determined in the laboratory using the mass per unit volume technique by filling 0.5 L plastic pails previously weighed. Once filled, pails were shaked several times to insure complete filling. Between 4 and 8 measures were done on each sample to ensure repeatability. The bulk density on the dry matter basis was calculated after moisture content [14] (Agnew and Leonard, 2003).
2.5. Particle Size Distribution
Particle size distribution was obtained using the hydrometer method of analysis [15] . The samples passed through the 2 mm sieve to insure that no aggregates were retained on the sieve. Fifty grams of air-dried sludge were transferred to a 500 mL beaker containing 50 mL Kalgon solution and 250 mL distilled using a soil blender. The suspensions were homogenized for 5 min. The volume of the suspension was completed to 1 L with distilled water and transferred to the sedimentation cylinder. A plunger was used to stir the suspension for 2 minutes then the hydrometer was gently immersed in the cylinder and allowed for stabilization. The hydrometer readings were collected after 40 seconds, and again after 2 hours. The temperature of the suspension was also recorded at each reading for correction factors. Sand fraction-like particle size was calculated according to the equation used for hydrometer and likewise Silt fraction-like particle size and clay fraction-like particle size.
2.6. Sludge Hydrophobicity
The water drip penetration time (WDPT) method [16] was used to quantify the degree of water repellency (WR) of the sludge. This procedure involved placing a drop of water on the sludge surface and measuring the time needed for its penetration. The degree of hydrophobicity was evaluated from the WDPT results according to Bauters et al. [17] . An amount of sludge was put on a big dish and distilled water drops (50 µm) were taken by the Jencons Sealpette instrument and put on the surface of the sludge. Photos for the water drips were taken. Oil drip penetration time was taken as a standard deviation of hydrophobicity.
2.7. EC and pH Measurements
EC (mS∙m−1) and pH values were measured from water extract (1:5 w/v) on wet samples, using an electrical conductivity probe and a pH electrode, respectively.
2.8. Determination of Total Organic Matter
Total organic matter (TOM) was determined by weight loss on ignition heating for 4 h in a muffle furnace at 560˚C after heating at 250˚C 30 min. Mineral matter (%MM) is %MM = 100-%TOM.
2.9. Statistical Analysis
The samples were in three replicates: mean and standard deviation were calculated, low standard deviation indicate homogeneity of the results and accuracy of work.
3. Results and Discussion
3.1. Density and Void Volume
The bulk density of sludge is about 1.18 ± 0.04 g/cm3 which is nearly half the real density. The explanation of these data is that bulk density includes void volume, some water vapor and other gases which contribute to decreasing the density. These results agree with O’kelly [10] who found that moderately digested sludge material has a typical specific gravity of solids value of 1.55. The similarity of densities of sludge and soil suggest that sludge sample contained high fraction of solid materials which may be sand. Furthermore, the void volume of sludge is about 50% of the total volume as shown in Table 1.
This may indicate high porosity of sludge, in addition this could contribute to the aeration of sludge. This is in agreement with previous report [10] who found that re-hydration of dry sludge caused the bulk density to double. As the bulk density indicates the solid material volume. The presented results agree with previous study [18] who analyzed the fractal structure of activated sludge and found that the sludge was constituted by a series of clusters with different sizes and has various holes and gaps that formed a range of pore structures which enabled sludge to have a high void volume. Such a fact makes the sludge to be used in agriculture to store irrigation water and keep good aeration to the soil. Thus, it improves the soil texture. Our results agree with Hu et al. [19] who found similar bulk density of sludge (1.05 g/cm3).
3.2. Water Holding Capacity
Water holding capacity or water retaining capacity is one of the main parameters to determine the suitability of sludge to agricultural lands. The average moisture content of sludge on air dry basis is about 1.81% ± 0.06% which is several times higher than sand (0.14% + 0.02%). In addition water holding capacity of sludge is about 54.45% ± 1.1%. This indicates that water holding capacity of sludge is nearly 2 times higher than soil water holding capacity as shown in Table 2.
These results lead to the conclusion that if the sludge is used as a conditioner for any soil, it will increase the water holding capacity. Consequently, a reduction of irrigation water in agriculture may occur. The explanation of these results is that the sludge has more porosity because of its fine particles and less permeability. These results are in accord with the data in Table 1.
3.3. Hydrophobicity of Sludge Samples
It has been reported that the sludge water drip penetration time (WDPT) was 114.77 ± 16.76 seconds and the average wetted radius was 0.44 ± 0.09 cm. Meanwhile, sludge oil drip penetration time (ODPT) was 5.05 ± 1.26 seconds and the average wetted radius was 1.25 ± 0.14 cm. On the contrary, the WDPT of sand was 0.86 ± 0.22 sec(s) and the average wetted radius was 1.167 ± 0.164 cm whereas the sand ODPT was 10.11 ± 2.02 sec(s) and the average wetted radius for the oil drops on sand was 1.07 ± 0.14. In addition, the ratio WDPT/ODPT of sludge is 22.73 which is higher than 1 and the ratio WDPT/ODPT of sand is 0.08 sec(s) which is much lower than 1 as shown in Table 3.
This means that the water drop needs more time than the time needed for an oil drop to penetrate the sludge surface. This leads to the conclusion that the sludge is a hydrophobic more than sand indicating that there may be retardation and/or reduction in the infiltration rates of rainfall to the aquifer if applied in agriculture [16] [20] [21] . This in turn, may lead to increased surface runoff [22] , soil erosion [23] , which may cause inhomogeneous

Table 1. Bulk and true density and void volume.
Table 2. Water holding capacity and moisture content for sludge.
distribution of water and nutrients in the root zone of crop plants and may accelerate pollutant transport to the ground water [24] -[26] . Our results agree with previous reports [17] , who found similar results in drop penetration for TWW in agricultural irrigation. Furthermore, sand WDPT was 0.86 ± 0.22 seconds and sand ODPT was 10.11 ± 2.02 seconds and the ratio WDPT/ODPT was 0.08 which is less than 1 meaning that the WDPT is less than the ODPT for sand. This indicates that sand has hydrophilic surfaces. The photos of water drop before and after penetration on the sludge surface are shown in Figure 1.
It is obvious from Figure 1 that water drop is stayed on the surface of the sludge for longer time due to the water repellency with the sludge surface. It was not possible to get a photo for water drop in sand because it disappeared immediately from surface as shown from the presented results in Table 3.
A comparison between water drop and oil drop sludge aggregates is shown in Figure 2.
It is obvious from Figure 2 that sludge water aggregates are smaller than oil sludge aggregates due to the hydrophobicity of sludge surface, water diffusion diameter in sludge is smaller that oil diffusion diameter as shown in Table 3. Accordingly, the aggregates size of the oil drop is larger than in sand. The explanation of these results is that sludge samples contain high fraction of organic matter that make a layer that prevents water penetration due to the hydrophobicity of water. Furthermore, in chemistry, the like dissolve like. This means that hydrophobic solvent dissolve hydrophobic (organic) materials. And hydrophilic solvent (water) dissolve hydrophilic materials (e.g. NaCl). Due to surface tension and bi-bonds and hydrogen bond interactions, it is hardly to dissolve organic material or NaCl in organic solvent. For water and sludge this is like two different solvents in the interphase. Accordingly, the values of WDPT were very high due to high fraction of organic carbon. Similar results were observed when TWW was used for irrigation [27] . The low value of ODPT is due to possible dissolving of oil drop in the organic layer in sludge.
3.4. Particles Size Distribution of Sludge Samples
Particle size distribution of sludge is shown in Figure 3. It is obvious that the large size particles (630 - 200 µm) have the highest percent size fraction which is nearly equal to 90% while the medium size particles (200 - 20 µm) have percent size fraction which is nearly equal to 10% and the fine size particles (<20 µm) have percent size fraction which nearly is equal to 3%. The medium size particles are nearly similar.
These results can be attributed to the fact that large size particles may be sand small gravels or other aggregates. The explanation of these results is that the large size fraction may be consisting of small size particles that
Table 3. Average water and oil drop penetration time ± standard deviation.
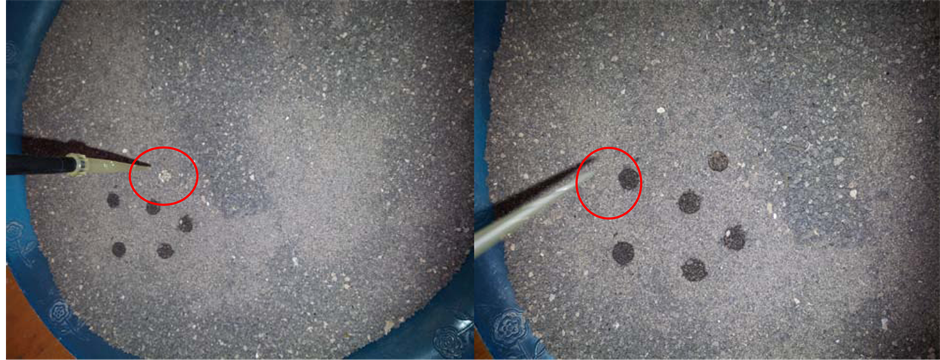
Figure 1. Water drop penetration, left photo shows water drop at time zero, right photo shows penetrated drop.
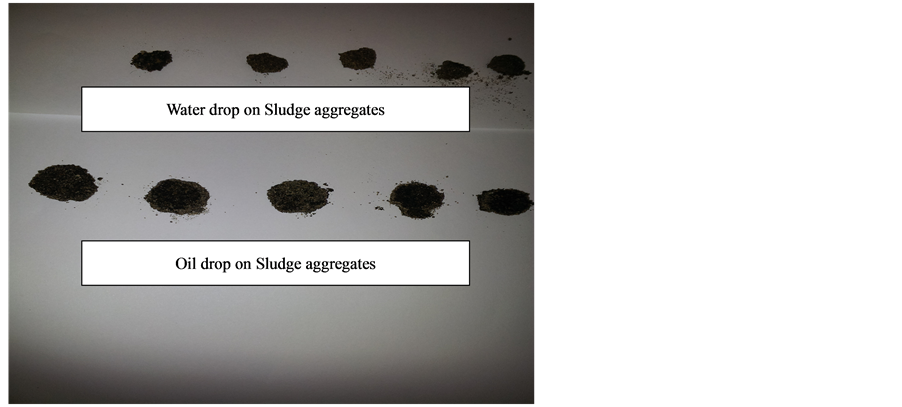
Figure 2. Water and oil drop on sludge aggregates.
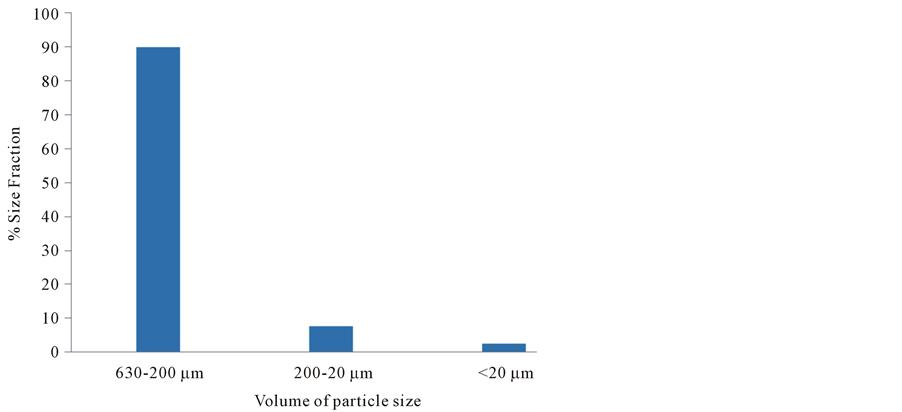
Figure 3. Particle size distribution of sludge samples as percent fraction.
aggregate together throughout cementing materials which make them stable against fractionation. The presented results agree with Verawaty et al. [28] who studied the particle size growth in aerobic granular sludge systems and revealed that granules in the reactors did equilibrate towards a common critical size of around 600 - 800 μm. Further supports to the presented results come from the results of Ruan and Liu [18] who analyzed the fractal structure of activated sludge flocs using the small-angle light scattering (SALS) experiment and revealed that the sludge floc was constituted by a series of clusters with different sizes and has various holes and gaps and there were a range of pore structures within the sludge floc.
3.5. pH, EC and TDS Values of Sludge Samples
As shown in Table 4, the sludge samples have an average value of pH equals to 6.78 with a standard deviation of 0.02. This value is approximately in the acidic range of pH.
This result can be explained by the fact that sludge samples contain large fraction of organic nitrogen (Data not shown) which may be decomposed into amino acids that maybe ionized and produced hydrogen ion that is responsible of the acidity. However, this value of pH indicates that the sludge acidity is not so severe and it is in
Table 4. pH and EC values of sludge samples.
Table 5. Total organic carbon and ash percents.
the acceptable range in terms of agricultural use [29] .
The importance of pH value of sludge emerges from the fact that the solubility of heavy metals in sludge samples is pH-dependent. Accordingly, acidic media may enhance the solubility of heavy metals in sludge samples and make them dynamically toxic. Thus, high risk may be associated with acidic pH range and the opposite is true for alkaline pH. It is obvious that EC value of the sludge samples is 2.49 ± 0.04 mS∙cm−1 as shown in Table 4. This may be due to the accumulation of high soluble salts in the sludge samples which comes from the nature of the treated waste water, where Gaza is known for its high saline wastewater [5] . This EC value indicates a high salinity and also indicates that a large fraction of natural salts are available in sludge. This value of EC indicates that the sludge cannot be applied in all agricultural crops due to this high salinity. Moreover, the importance of EC value emerges from the fact that it represents all soluble salts in sludge at dry conditions as in Gaza this may enhance the accumulation of salts on the surface of sludge samples or soil treated with sludge. This situation may lead to the loss of soil productivity. Our explanation is supported by the results of [30] who found rather saline EC (14 mS∙cm−1) of the saturated paste extract. It can be seen from Table 4 that the Total Dissolved Salts (TDS) value of the sludge samples is 256.4 ± 47.05 mg/l. This value of TDS is not so high.
3.6. Organic Fraction of Sludge
As shown in Table 5, the percent organic fraction is about 89.53% ± 0.92% and ash% is about 10.47% ± 0.93%. The high fraction of organic matters in sludge is responsible for the high values of WDPT. This may enhance water repellency and water runoff. Furthermore, this high fraction of organic matters is in accord with the fraction of Total Kjeldahl Nitrogen (TKN) (data not shown).
Our results agree with the recent report [31] who evaluated the nutrients removal from the supernatant originating from the anaerobic digestion of the organic fraction of municipal solid waste using biological means. They reported that such effluents are characterized by high nutrient content, because organic and particulate nitrogen and phosphorus are hydrolyzed in the anaerobic digestion process and needs adequate post-treatment such as physicochemical and biological processes.
4. Conclusions
Our approach is based on determination of physical, chemical and biological properties of sludge. We took a representative sample from different locations from Sheikh Ejleen WWTP. It can be seen that the bulk density of sludge is nearly low 1.18 ± 0.04 g/cm3 (Table 1) with a high fraction of organic carbon which is 89.53 ± 0.92 (Table 5) and high hydrophobicity (WDPT equals 114.77 ± 16.76 sec).
The pH value of sludge is slightly in the acidic range which equals 6.78 ± 0.02 (Table 4) but its application in soil did not make significant changes in soil pH (data not shown).
References
- Miller, M.C. (2011) Microbiological Safety of Organic Fertilizers Used for Production. MS.C. Thesis, Clemson University, Clemson.
- de Melo, W.J., Marques, M.O., Ferreira, M.E., de Melo, G.M.P. and de Melo, V.P. (2002) Chemical Properties and Enzyme Activity in a Sewage Sludge Treated Soil. Communications in Soil Science and Plant Analysis, 33, 1643-1650. http://dx.doi.org/10.1081/CSS-120004305
- Hue, N.V. (1988) Residual Effects of Sewage Sludge Application on Plant and Soil-Profile Chemical Composition. Communications in Soil Science and Plant Analysis, 19, 1633-1643. http://dx.doi.org/10.1080/00103628809368040
- Silveira, M.L.A., Alleoni, L.R.F. and Guilherme, L.R.G. (2003) Sewage Sludge and Heavy Metals in Soils. Scientia Agricola, 60, 793-806. http://dx.doi.org/10.1590/S0103-90162003000400029
- Palestinian Water Authority (PWA) (2013) Strategy for Sustainable Management of Biosolids at Palestinian Wastewater Treatment Plants. TPAT Project, Draft version.
- Abu-Jalalah, S. (1999) Wastewater Treatment in Gaza. http://www.mofa.go.jp/region/middle_e/peaceprocess/ewg/mission9903/gaza2.htm
- Nassar, A., Smith, M. and Afifi, S. (2005) Sludge and Effluent Reuse Study for Gaza Central Area. KFW Report.
- Koenig, A., Kay, J.N. and Wan, I.M. (1996) Physical Properties of Dewatered Wastewater Sludge for Landfilling. Water Science and Technology, 34, 533-540. http://dx.doi.org/10.1016/0273-1223(96)00621-X
- Mikkelsen, L.H. and Keiding, K. (2002) Physico-Chemical Characteristics of Full Scale Sewage Sludges with Implications to Dewatering. Water Research, 36, 2451-2462. http://dx.doi.org/10.1016/S0043-1354(01)00477-8
- O’Kelly, B.C. (2005) Mechanical Properties of Dewatered Sewage Sludge. Waste Management, 25, 47-52. http://dx.doi.org/10.1016/j.wasman.2004.08.003
- Devlin, C.D., Esteves, R.R.S., Dinsdale, M.R. and Guwy, J.A. (2010) The Effect of Acid Pretreatment on the Anaerobic Digestion and Dewatering of Waste Activated Sludge. Bioresource Technology, 102, 4076-4082. http://dx.doi.org/10.1016/j.biortech.2010.12.043
- Wilke, M.B. (2005) Determination of Chemical and Physical Soil Properties. In: Margesin, R. and Schinner, F., Eds., Manual for Soil Analysis, Monitoring and Assessing, Soil Bioremediation, Springer-Verlag Berlin Heidelberg, Germany, 47-95.
- El-Nahhal, Y., Nir, S., Polubesova, T., Margulies, L. and Rubin, B. (1998) Leaching, Phytotoxicity and Weed Control of New Formulations of Alachlor. Journal of Agricultural Food Chemistry, 46, 3305-3313. http://dx.doi.org/10.1021/jf971062k
- Agnew, J.M. and Leonard, J.J. (2003) The Physical Properties of Compost. Compost Science & Utilization, 11, 238- 264. http://dx.doi.org/10.1080/1065657X.2003.10702132
- Standards Association of Australia. AS 1289.C6.2 (1976) Determination of the Particle Size Distribution of a Soil: An Analysis by Sieving in Combination with Hydrometer Analysis.
- Letey, J. (1969) Measurement of Contact Angle, Water Drop Penetration Time, and Critical Surface Tension. Proceedings of a Symposium on Water Repellant Soils, Riverside, 6-10 May 1968, 43-47.
- Bauters, T.W.J., Dicarlo, D.A., Steenhuis, T.S. and Parlange, J.Y. (1998) Preferential Flow in Water Repellent Sands. Soil Science Society of America Journal, 62, 1185-1190. http://dx.doi.org/10.2136/sssaj1998.03615995006200050005x
- Ruan, X.D. and Liu, J.X. (2013) Analysis of the Fractal Structure of Activated Sludge Flocs. Huan Jing Ke Xue, 34, 1457-1463.
- Hu, S.H., Hu, S.C. and Fu, Y.P. (2012) Resource Recycling through Artificial Lightweight Aggregates from Sewage Sludge and Derived Ash Using Boric Acid Flux to Lower Co-Melting Temperature. Journal of the Air & Waste Management Association, 62, 262-269. http://dx.doi.org/10.1080/10473289.2011.646051
- Feng, G.L., Letey, J. and Wu, L. (2001) Water Ponding Depths Affect Temporal Infiltration Rates in Water-Repellent Sand. Soil Science Society of America Journal, 65, 315-320. http://dx.doi.org/10.2136/sssaj2001.652315x
- Arye, G., Tarchitzky, J. and Chen, Y. (2011) Treated Wastewater Effects on Water Repellency and Soil Hydraulic Properties of Soil Aquifer Treatment Infiltration Basins. Journal of Hydrology, 397, 136-145. http://dx.doi.org/10.1016/j.jhydrol.2010.11.046
- Burch, G.J., Moore, I.D. and Burns, J. (1989) Soil Hydrophobic Effects on Infiltration and Catchment Runoff. Hydrological Processes, 3, 211-222. http://dx.doi.org/10.1002/hyp.3360030302
- Shakesby, R.A., Doerr, S.H. and Walsh, R.P.D. (2000) The Erosional Impact of Soil Hydrophobicity: Current Problems and Future Research Directions. Journal of Hydrology, 231-232, 178-191. http://dx.doi.org/10.1016/S0022-1694(00)00193-1
- Wang, Z., Feyen, J. and Ritsema, C.J. (1998) Susceptibility and Predictability of Condition for Preferential Flow. Water Resources Research, 34, 2169-2182. http://dx.doi.org/10.1029/98WR01761
- Carrillo, M.L.K., Letey, J. and Yates, S.R. (2000a) Unstable Water Flow in Layered Soils: I. Effect of a Stable WaterRepellent Layer. Soil Science Society of America Journal, 64, 450-455. http://dx.doi.org/10.2136/sssaj2000.642450x
- Carrillo, M.L.K., Letey, J. and Yates, S.R. (2000b) Unstable Water Flow in Layered Soils: II. Effect of an Unstable Water-Repellent Layer. Soil Science Society of America Journal, 64, 456-459. http://dx.doi.org/10.2136/sssaj2000.642456x
- Wallach, R., Ben-Arie, O. and Graber, E.R. (2005) Soil Water Repellency Induced by Long-Term Irrigation with Treated Sewage Effluent. Journal of Environmental Quality, 34, 1910-1920. http://dx.doi.org/10.2134/jeq2005.0073
- Verawaty, M., Tait, S., Pijuan, M., Yuan, Z. and Bond, P.L. (2013) Breakage and Growth towards a Stable Aerobic Granule Size during the Treatment of Wastewater. Water Research, 47, 5338-5349. http://dx.doi.org/10.1016/j.watres.2013.06.012
- Sial, R.A., Chaudhary, M.F., Abbas, S.T., Latif, M.I. and Khan, A.G. (2006) Quality of Effluents from Hattar Industrial Estate. Journal of Zhejiang University SCIENCE B, 7, 974-980. http://dx.doi.org/10.1631/jzus.2006.B0974
- Novak, J. and Trapp, S. (2005) Growth of Plants on TBT-Contaminated Harbour Sludge and Effect on TBT Removal (10 pp). Environmental Science and Pollution Research, 12, 332-341. http://dx.doi.org/10.1065/espr2005.08.282
- Malamis, S., Katsou, E., Di Fabio, S., Bolzonella, D. and Fatone, F. (2013) Biological Nutrients Removal from the Supernatant Originating from the Anaerobic Digestion of the Organic Fraction of Municipal Solid Waste. Critical Reviews in Biotechnology, Published Online. http://dx.doi.org/10.3109/07388551.2013.791246