International Journal of Geosciences
Vol.5 No.2(2014), Article ID:43165,10 pages DOI:10.4236/ijg.2014.52016
Gravity Survey on the Mizuho Plateau, East Antarctica: SEAL Seismic Exploration in 2001-2002
Shigeru Toda1*, Hiroki Miyamachi2, Masaki Kanao3, Takeshi Matsushima4, Masamitsu Takada5, Atsushi Watanabe6, Mikiya Yamashita71Department of Earth Sciences, Faculty of Education, Aichi University of Education, Kariya, Japan
2Department of Earth and Environmental Sciences, Faculty of Science, Kagoshima University, Kagoshima, Japan
3National Institute of Polar Research, Tokyo, Japan
4Shimabara Observatory, Institute of Seismology and Volcanology, Faculty of Sciences, Kyushu University, Shimabara, Japan
5Institute of Seismology and Volcanology, Graduate School of Science, Hokkaido University, Sapporo, Japan
6Earthquake Research Institute, The University of Tokyo, Tokyo, Japan
7Institute for Research on Earth Evolution, Japan Agency for Marine-Earth Science and Technology, Yokohama, Japan
Email: *shigeru@auecc.aichi-edu.ac.jp, miya@sci.kagoshima-u.ac.jp, kanao@nipr.ac.jp, mat@sevo.kyushu-u.ac.jp, takada@sci.hokudai.ac.jp, atsushi@eri.u-tokyo.ac.jp, mikiya@jamstec.go.jp
Copyright © 2014 Shigeru Toda et al. This is an open access article distributed under the Creative Commons Attribution License, which permits unrestricted use, distribution, and reproduction in any medium, provided the original work is properly cited. In accordance of the Creative Commons Attribution License all Copyrights © 2014 are reserved for SCIRP and the owner of the intellectual property Shigeru Toda et al. All Copyright © 2014 are guarded by law and by SCIRP as a guardian.
Received December 2, 2013; revised January 1, 2014; accepted February 2, 2014
Keywords:Gravity Survey; Mizuho Plateau; Bedrock Elevation; Bouguer Gravity Anomaly; Crustal Thickness
ABSTRACT
A gravity survey on Mizuho Plateau was carried out in austral summer of 2001-2002 by the 43rd Japanese Antarctic Research Expedition (JARE-43), as one of the geophysical measurements of deep seismic exploration. Gravity measurements were conducted at 151 points in approximately 1 km interval along the 150 km profile. Considering the gravity effect from the ice-sheet, Free-air and Bouguer anomalies were calculated by using precise GPS locations. Furrowed and basin-like negative Free-air anomalies were observed in middle and northern parts of the profile. Bouguer anomalies were calculated by two bedrock elevation data obtained from seismic refraction and radio-echo sounding. High resolution model for bedrock elevation by radio-echo sounding was applied in determining the crustal thickness.
1. Introduction
Several geophysical investigations have been carried out to understand the physical characteristics beneath the continental ice-sheet on Mizuho Plateau, East Antarctica by the Japanese Antarctic Research Expedition (JARE). The Mizuho Plateau is a part of the Paleozoic LützowHolm Complex (LHC), which is known as a region which experienced a metamorphic event in 550 Ma [1]. Before this study, land traverse gravity surveys were conducted for several times on the Plateau since 1961 [2-5]. A significant inclination of the Moho discontinuity from inland plateau area to the coast along the Mizuho— Dome-F routes was analyzed by the previously obtained gravity data [6]. In these previous studies, however, a station spacing of the gravity measurements was about a few km or larger, therefore it requires that the station interval be more dense to address detail discussion about the fine structure.
A multidisciplinary geosciences project on “Structure and Evolution of the East Antarctic Lithosphere (SEAL)” had been conducted in the Western Enderby Land— Eastern Dronning Maud Land in a framework of JARE [7,8]. As a main component of the SEAL project, the JARE-41 conducted deep seismic exploration (refraction and wide-angle reflection surveys), as well as the gravity measurements with a dense station distribution along the Mizuho traverse routes in austral summer of 1999-2000 [9]. A P-wave velocity structure of the ice-sheet and uppermost crustal layer along the profile were obtained by analyzing the recorded travel-time data [10]. [11] obtained gravity anomalies beneath the Mizuho traverse routes. The estimated density model by [11] indicates that the Moho discontinuity slightly declines about 1 km from coast to inland over 200 km in length.
In succession to the JARE-41 field operation, a similar seismic exploration was held on the Mizuho Plateau by the JARE-43 in austral summer of 2001-2002. The specifications of the seismic observations and instrumentations were the same as those of JARE-41. The survey profile of JARE-43 intersects the JARE-41 profile at “H176” point and spreads out to NNE-SSW direction with 150 km in length (Figure 1). More detailed specifications of the JARE-43 seismic surveys are referred to [12]. Dense gravity measurements were also conducted along the JARE-43 profile. In this paper, we represent the details of the gravity measurements, and demonstrate the obtained Free-air and Bouguer gravity anomalies along the survey line by JARE-43.
2. Gravity Survey
2.1. Gravity Measurements
The land traverse gravity measurements were conducted using a SCINTREX (CG-3M; model: 858011, serial No. 9507278) gravimeter at 1 km interval along the survey line. The number of measurement points was 151 (Table
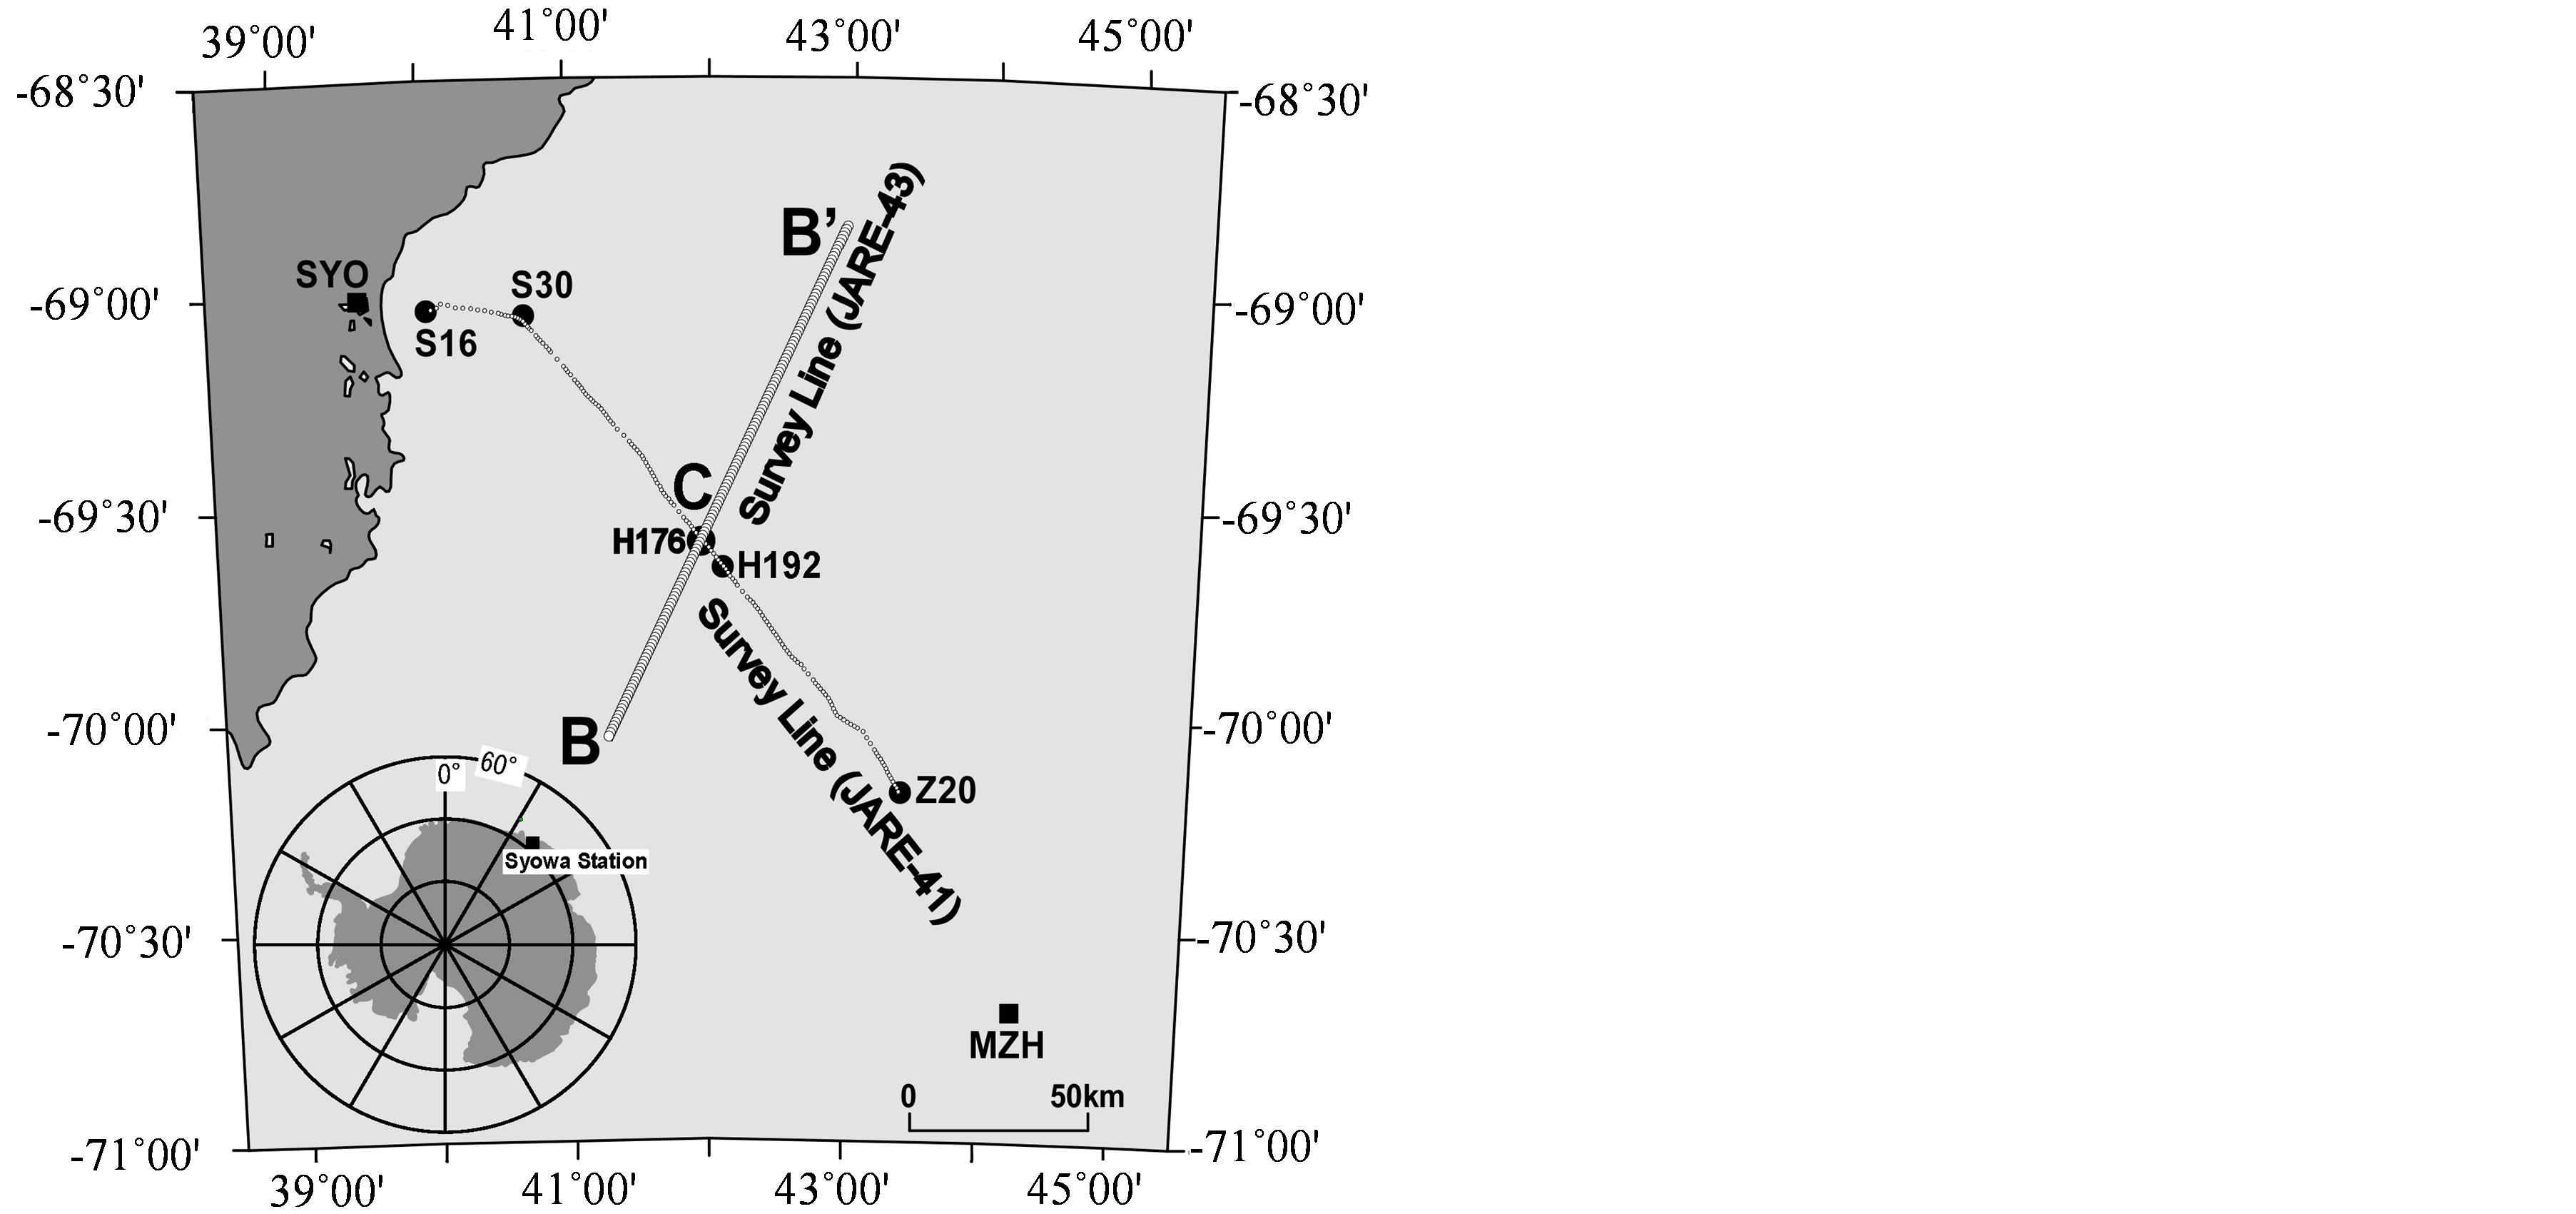
Figure 1. Map showing the JARE-43 gravity survey profile. Small open circles indicate 151 measurement points. Solid line denotes the JARE-41 survey profile. Large solid circles and squares show important route points (S16 and H176) and the Japanese Antarctic Stations (Syowa: SYO; Mizuho: MZH), respectively.
1). Since the survey line was located over 100 km apart from the gravity reference point at Syowa Station (SYO; 69.0S, 39.6E), we set up two temporal gravity reference points at both S16 and H176. These reference points were linked to the absolute gravity point (IAGBN-A) at SYO and gravity values of the points were determined using the absolute gravity value of 982524.327 mgal [13]. In the gravity measurements, we did not adopt the closed loop method which was usually used in conventional gravity surveys. Instead, we carried out the gravity measurements more than twice at several stations including S16 and H176 reference points. If the three successive measurements agreed within a certain allowance revel (10 micro-gal), the final gravity value at the point was determined to be a mean value of these three measurements. The drift rate throughout the total measurement period of 48 days was 0.47 mgal/day and we found no significant jumps in reading the values. Figure 2 shows the drift rate throughout the measurement period by joining the reading values at S16 and H176.
2.2. GPS Measurements
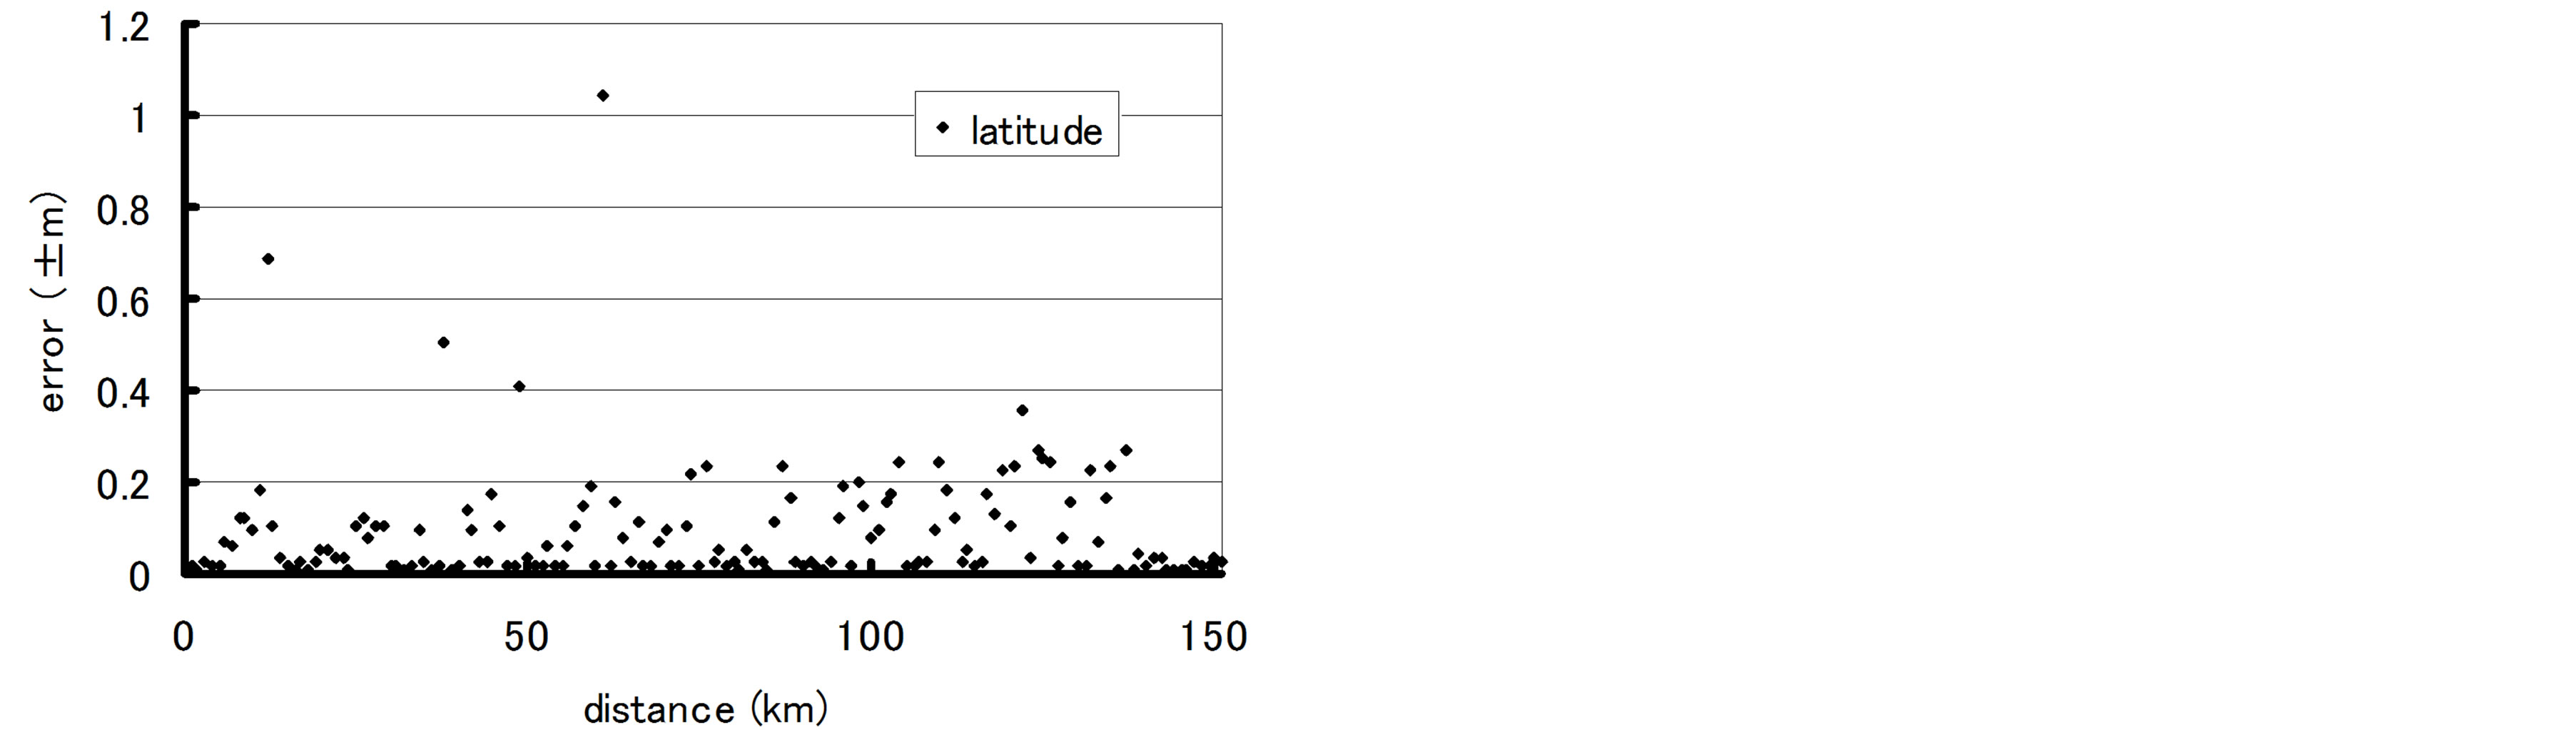
In order to determine precise positions of the gravity points, we used dual-frequency GPS (Ashtech Z type recievers). To determine coordinates of a point, we recorded 20 minutes GPS data for every 5 s sampling interval. The coordinates of almost the points were precisely calculated on the WGS-84 ellipsoid by rapid static positioning method between the each point and the permanent GPS station at SYO. In contrast, the coordinates of a few numbers of points were calculated by means of “autogipsy” on the basis of the global GPS database (http://gipsy.jpl.nasa.gov). Figure 3 represents the errors in the positioning calculating procedure. Elevation errors in almost all points were achieved less than 0.3 m; which corresponds to the errors in free-air anomalies of about 0.1 mgal.
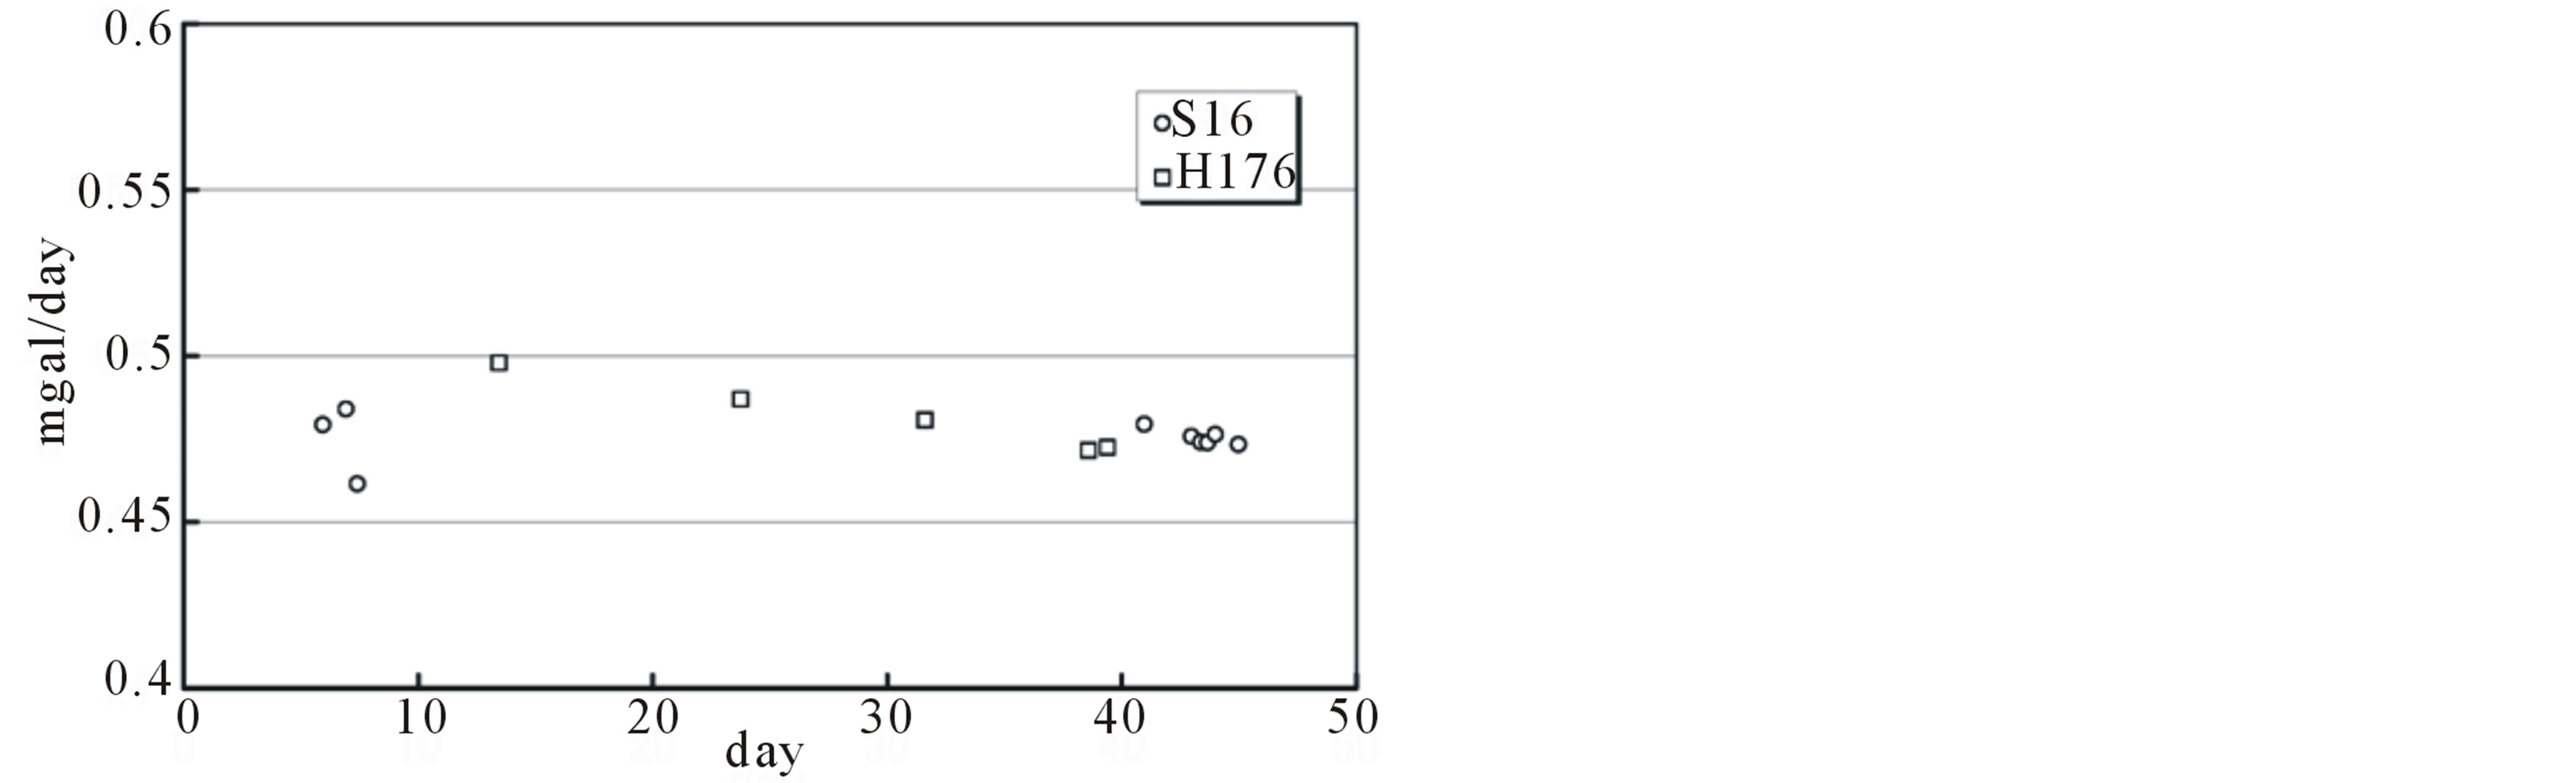
Figure 2. A drift rate throughout the measurement period in 2001-2002 survey. The approximately the same value in 0.47 mgal/day was obtained from both the results at S16 and H176 observation points.

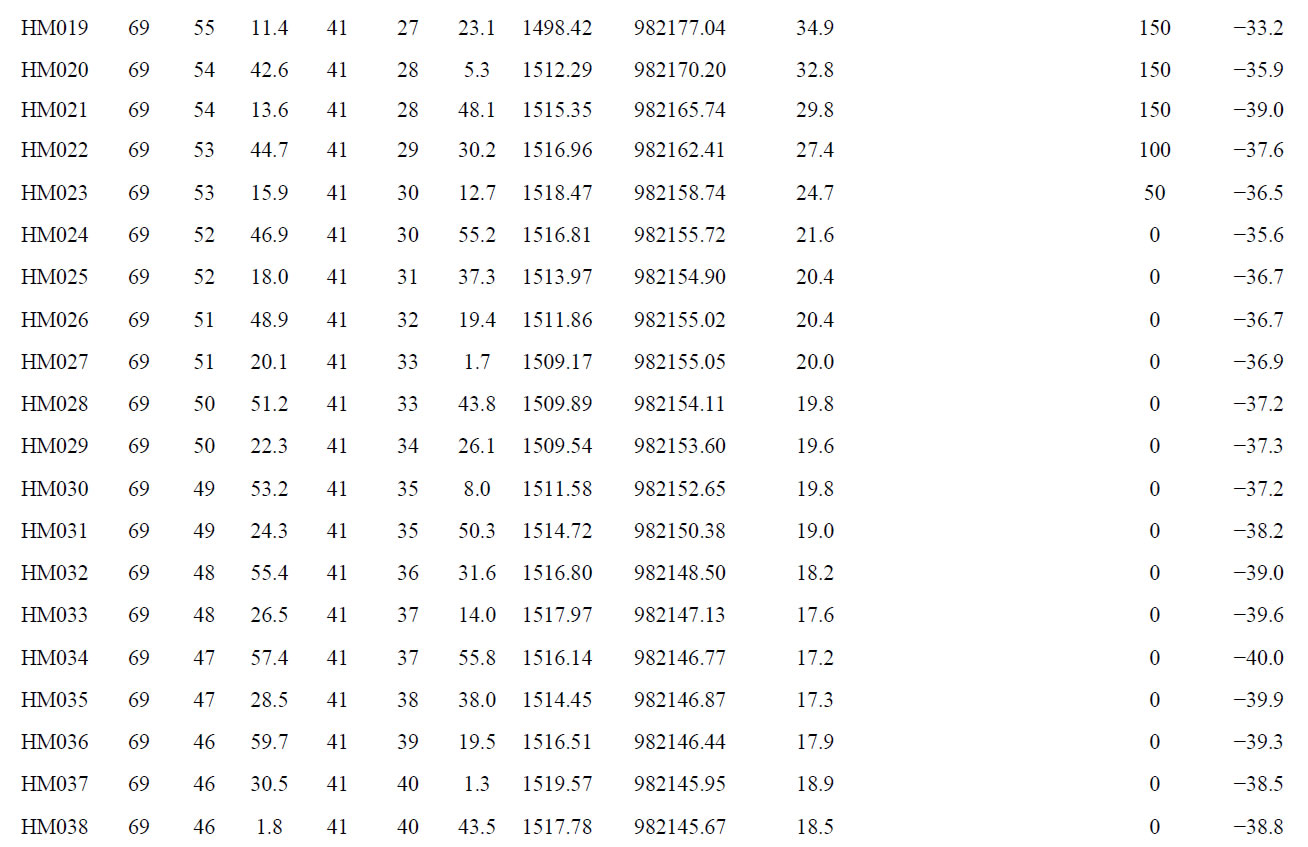
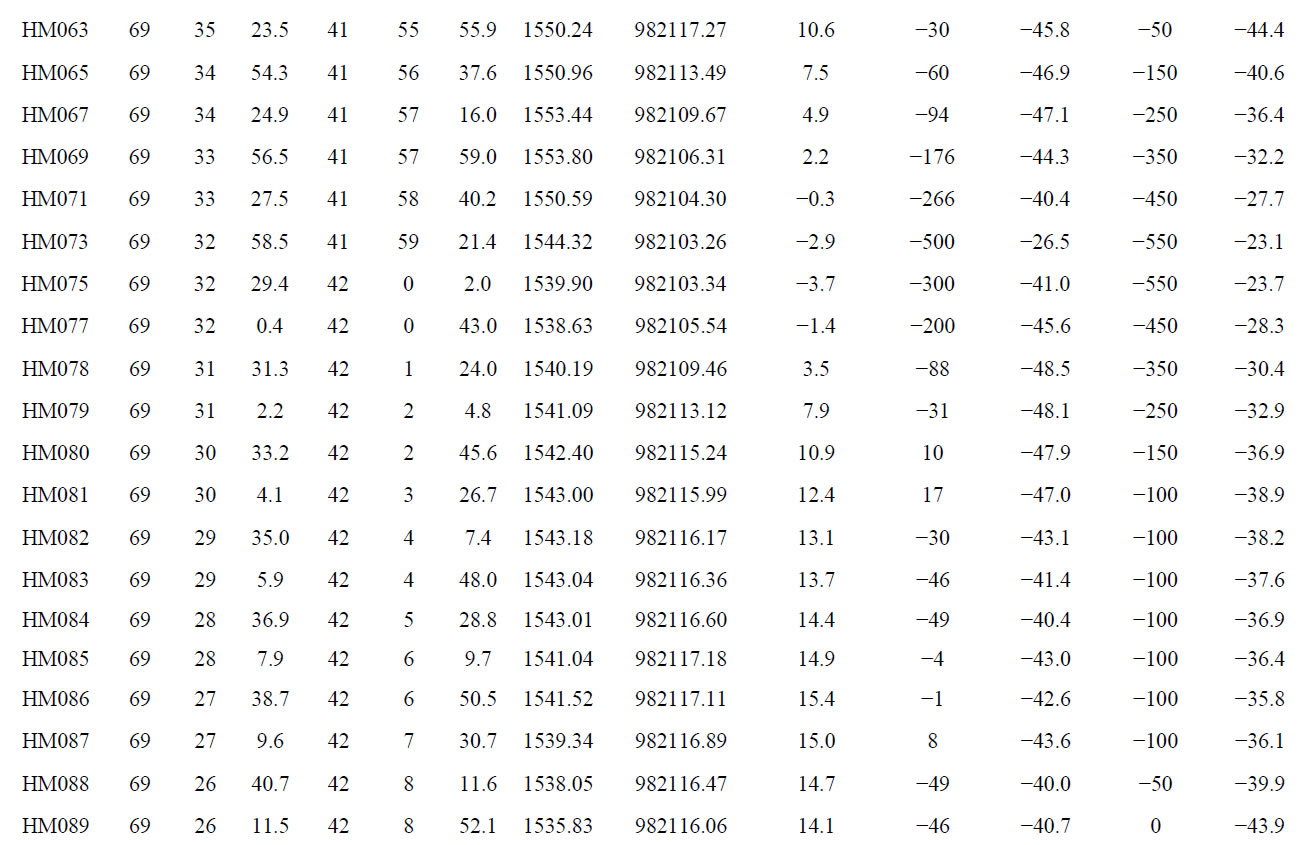
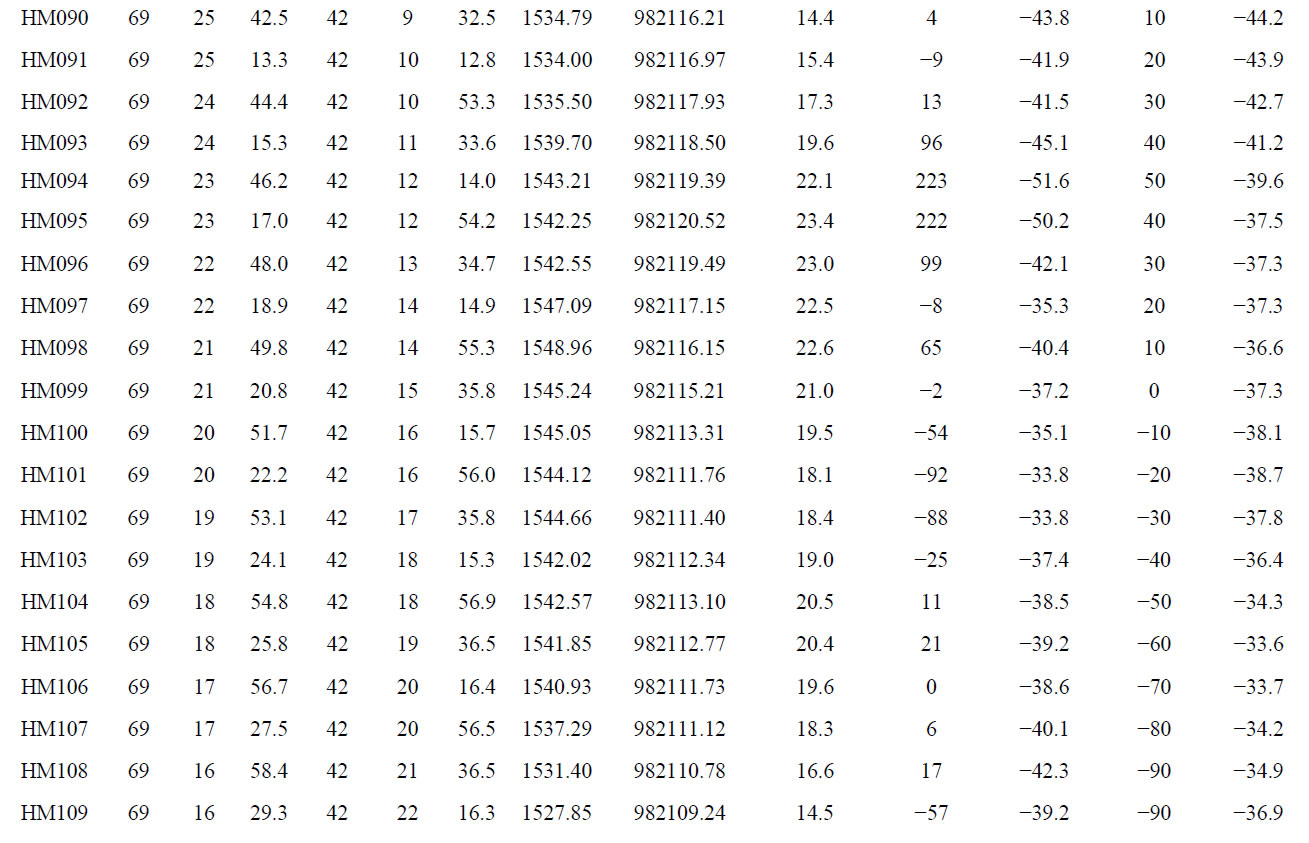
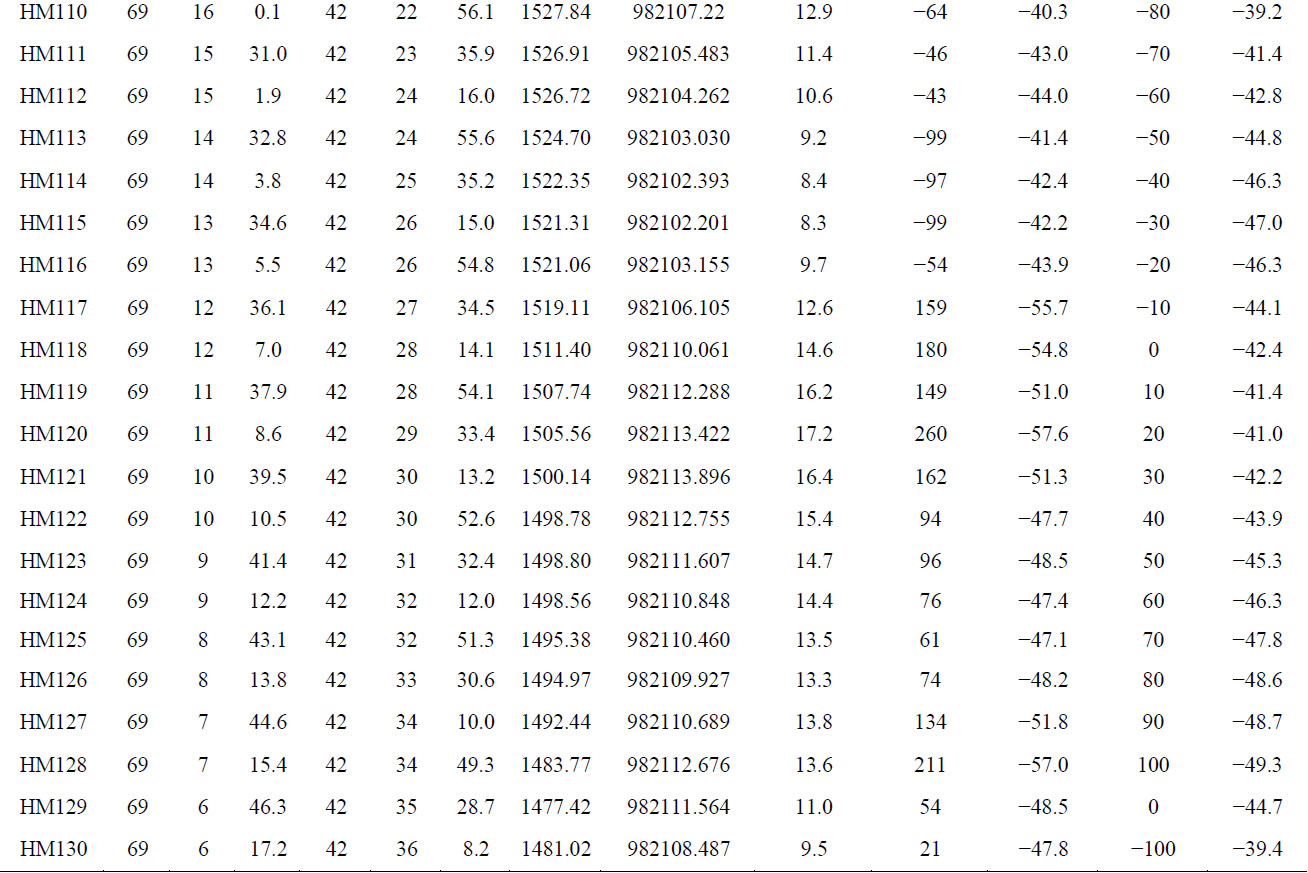

Table 1. Results of the gravity survey on the Mizuho Plateau in 2001-2002 operation by JARE-43.
3. Gravity Anomaly Calculations
3.1. Methods
The Free-air anomaly  is calculated by the following formula,

where g is the measured gravity value (in mgal), ![]() is the normal gravity defined on the reference ellipsoid 1980 (in mgal), and H is the WGS-84 ellipsoidal height of the gravity point (in meter). Then, the simple Bouguer anomaly
is the normal gravity defined on the reference ellipsoid 1980 (in mgal), and H is the WGS-84 ellipsoidal height of the gravity point (in meter). Then, the simple Bouguer anomaly ![]() is calculated by the formula,
is calculated by the formula,
 where G is the Newton’s gravitational constant,
  is the density of bedrock assumed to be 2.55 or 2.75 g/cm3 so as to correspond to the final density models;
 ![]() is the density of the ice assuming as 0.9 g/cm3, and h is the elevation of the bedrock in meter.
is the density of the ice assuming as 0.9 g/cm3, and h is the elevation of the bedrock in meter.
3.2. Ice-Sheet Surface and Bedrock Elevations
In order to calculate the simple Bouguer anomaly, it is necessary to remove the effect of the ice-sheet overlaying
 (a)
(a)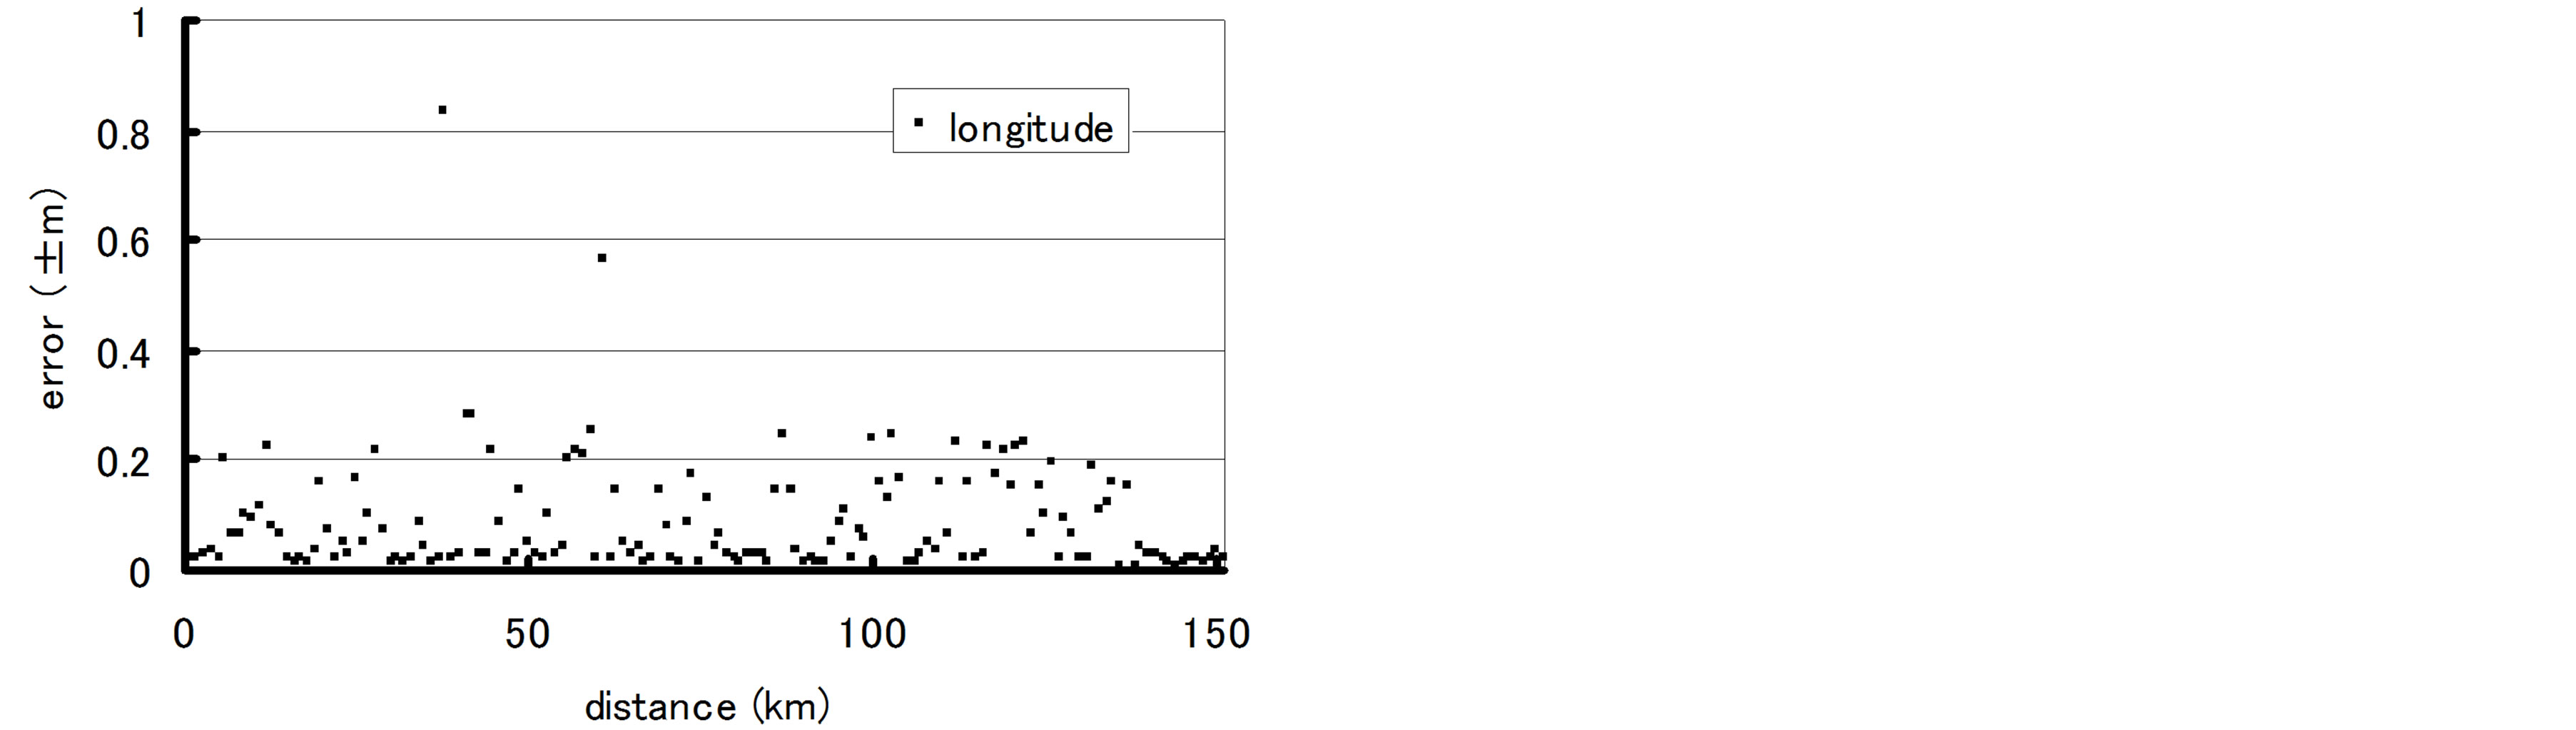 (b)
(b)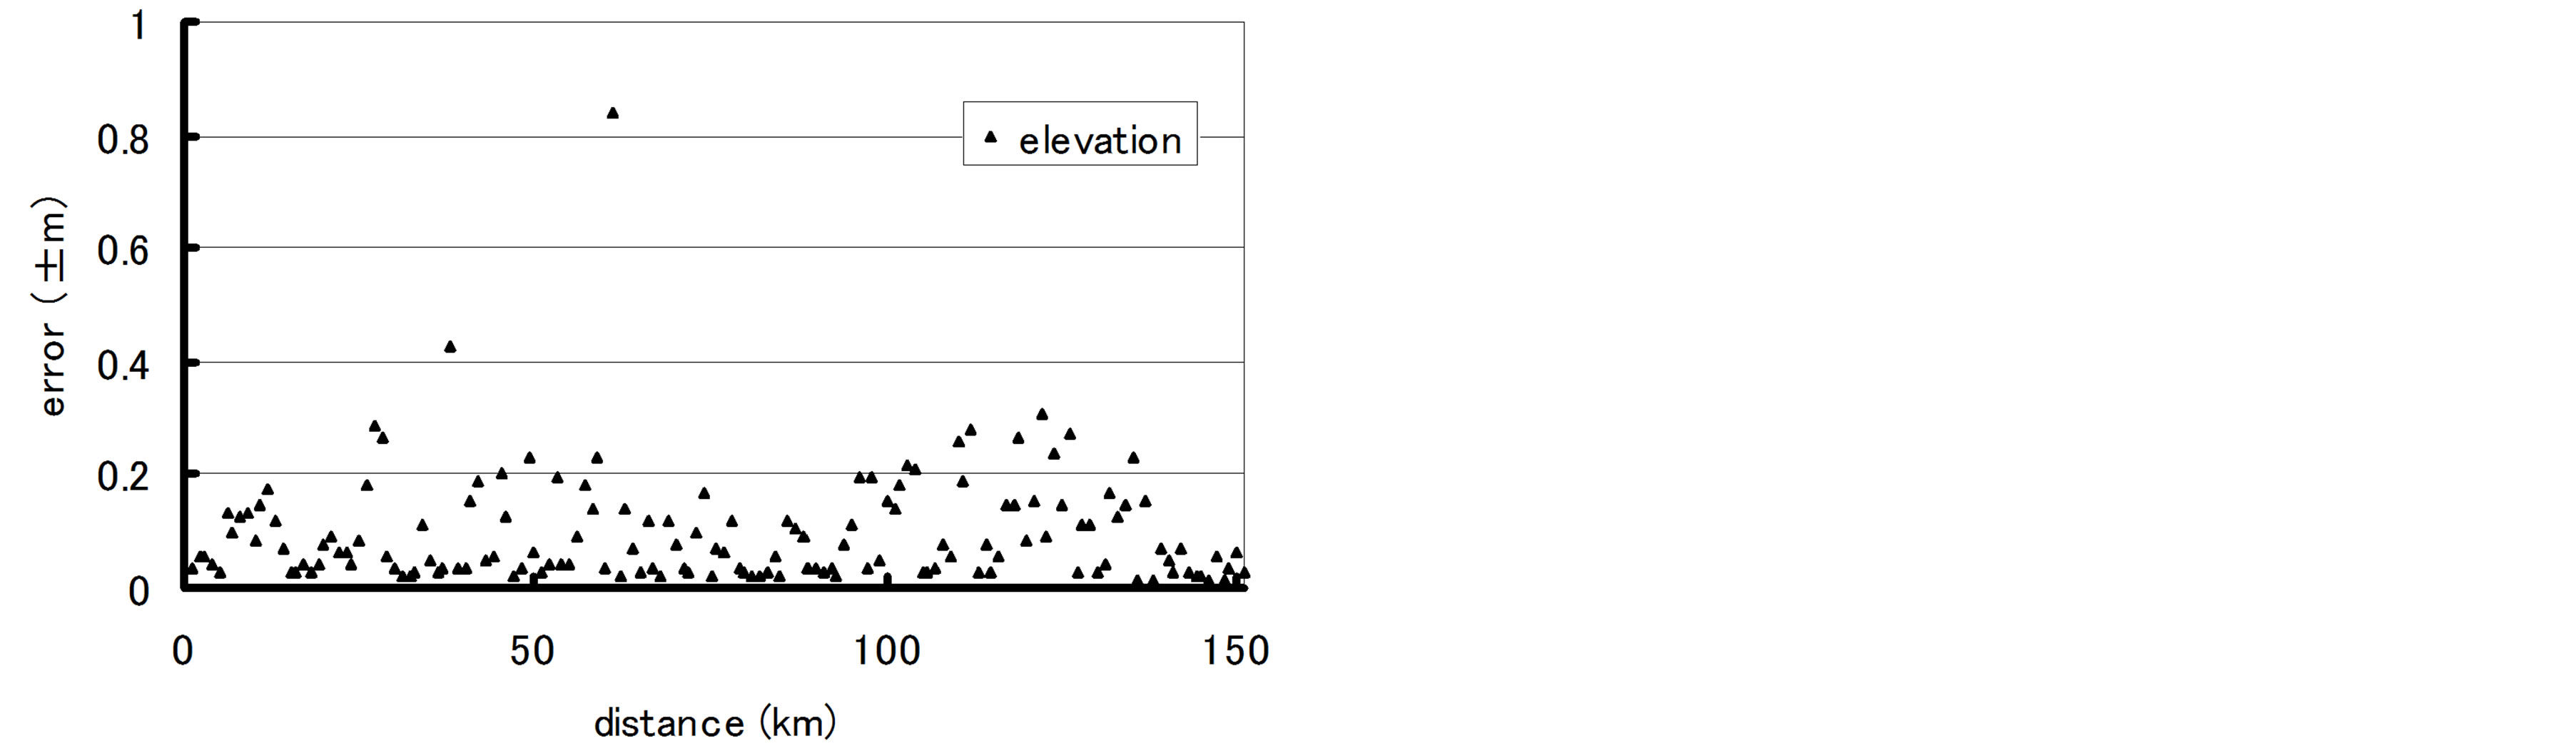 (c)
(c)
Figure 3. Calculated GPS positioning errors of all stations. ((a) latitude; (b) longitude; (c) elevation).
the bedrock surface. Two kinds of dataset for the bedrock elevation (that is reduced from ice-sheet surface to the ice-sheet thickness) beneath the survey line are available. The one is a result from the radio-echo sounding simultaneously conducted at the survey ([14], Figure 4), the other is obtained from seismic travel-time analysis [15]. Figure 5 shows the distribution of surface elevation and bedrock elevation of these two data sets. It is clear that the bedrock elevations obtained by seismic travel-time analysis is generally deeper than those obtained by the radio-echo sounding. It is noted that the maximum errors technically anticipated are 100 m for the radio-echo sounding [16], and 350 m for the seismic data [10]: These maximum elevation errors could firmly produce the Bouguer anomalies about 7 mgal and 25 mgal, respectively.
It is also noted that the bedrock elevations from radioecho sounding were not actually determined at several points, due to a mechanical trouble of the radar instrument. Moreover, there were several places where no reflected signals from the bedrock by the radio-echo sounding, in particular around the points over the furrowed bedrock topography in central part of the profile (point C in Figure 5, the cross-section between two profiles by JARE-41 and -43). This furrowed bedrock topography was also observed at the Mizuho traverse routes by both the radio-echo sounding and the seismic traveltimes for JARE-41 analyses [10,16]. Unfortunately, it may be difficult to make accurate evaluation for which elevation model could be geophysically and glaciologically more plausible. Therefore, in this paper, we shall calculate the simple Bouguer gravity anomalies by applying for both these two bedrock elevation models.
3.3 Free-Air and Bouguer Anomalies
Table 1 shows the coordinates, observed gravity values, obtained Free-air and Bouguer anomalies, together with bedrock elevations at the gravity measured points. Freeair and Bouguer gravity anomalies are also illustrated in Figures 5 and 6, respectively. Figure 5 indicates a fine correlation between the Free-air gravity anomalies and the bedrock topography along the profile. Free-air gravity anomaly varies in +38 and −3 mgal. Furrowed negative free-air anomalies around H176 (point C in Figure 5) implies an existence of a valley structure as seen in the same manner for the bedrock topography. Around this valley, there is no reflected signal recorded from the bedrock by the radio-echo sounding data.
The calculated Bouguer gravity anomalies varies in −10 to −60 mgal (Figure 6). Variation in Bouguer anomalies in adjacent measurement points might be caused chiefly by those of bedrock elevation retrieved from both radio-echo soundings and seismic surveys. Hereafter, therefore, we discuss about the characteristics of Bouger anomalies in long period wave-length over few tens of km while constructing the crustal density models. The short-period wavelength variations in Bouguer anomalies
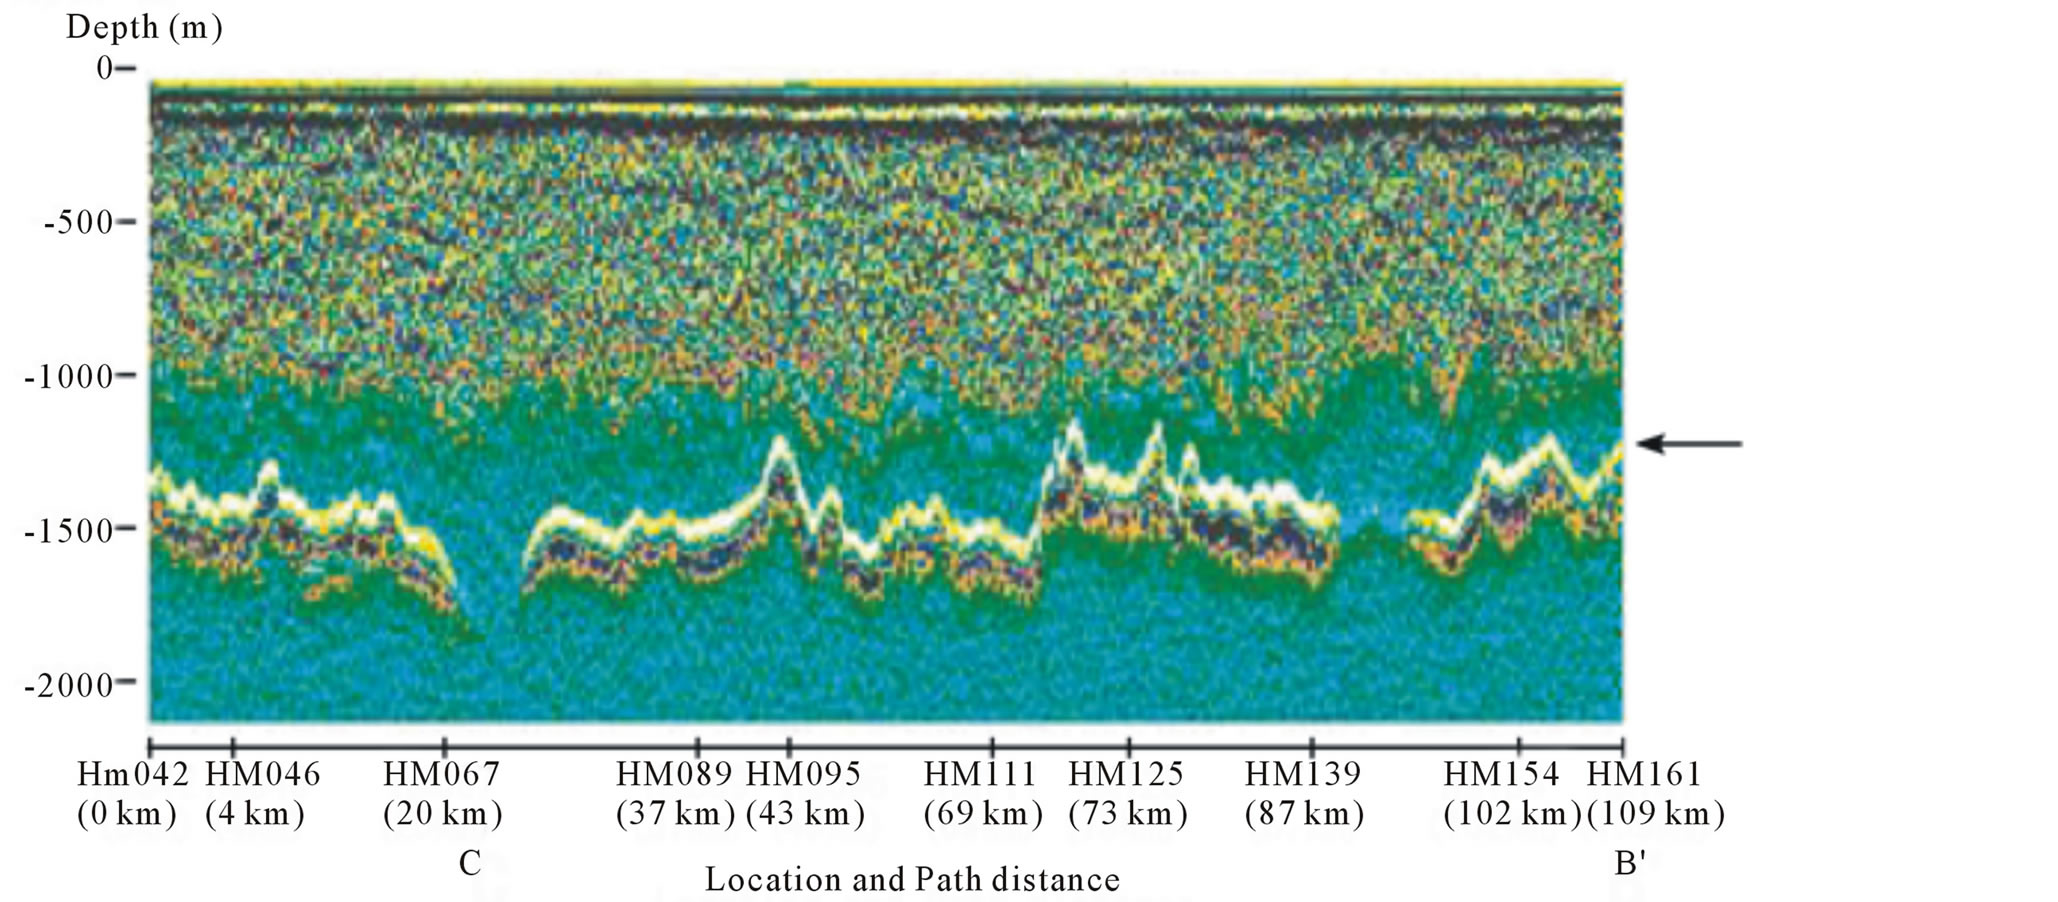
Figure 4. Reflection images of inner structure for the ice-sheet and bedrock topography obtained from radio-echo sounding along the seismic/gravity profile [14]. Black arrow (right hand side in the figure) indicates the reflected echoes from the bedrock surface.

Figure 5. Surface elevation and bedrock topography, together with Free-air gravity anomalies along the survey profile. Small open circles indicate surface elevation determined by GPS measurements. Large solid and open squares indicate the bedrock topography obtained from radio-echo sounding [14] and from the seismic refraction survey [15], respectively. Small solid circles indicate the Free-air gravity anomalies.

Figure 6. Bouguer gravity anomalies along the survey profile. Solid and open squares indicate the anomalies calculated from the radio-echo sounding [14] and from the seismic refraction survey [15], respectively.
supposed to be caused by the small scale heterogeneity in topmost crustal layer including sediments, otherwise a mixture layer composed from ice and moraine rocks spreading over the bedrock beneath continental ice sheet. The negative gravity anomaly suggests the evidence of the thick crust, or the existence of low-density materials are underlying. The Bouguer anomalies in the south and the central parts of the profile have not so much variations and it means that the density discontinuity of the deeper part of the crust could be in less horizontal variation. On the contrary, the low velocity zone in the upper crust at the northern profile (B’ in Figure 6) is implied by the increasing Bouguer anomalies. A “ridge shaped” Bouguer anomalies at H176 (C in Figure 6) is probably related to the underlying furrowed bedrock topography.
4. Discussion
As a main program of the SEAL deep exploration in austral summer in 2001-2002 by JARE-43, wide-angle reflection and refraction survey was carried out along the seismic profile on the Mizuho Plateau. [15] proposed velocity variations and three prominent seismic velocity boundaries along the profile. The P-wave velocities of the upper crust was identified to have lateral variations of 5.9 km/s in the north, 6.0 km/s around the point C (H176), and 6.1 - 6.2 km/s in the center and south of the profile. The first boundary was determined by reflection phases at 19 km in depth between the upper and the middle crust. The second boundary was recognized by reflected waves from the lower crust at 30 km in depths. The third boundary was determined by prominent reflection phases from the Moho at 40 km in depths. However, the inclination of the Moho boundaries are not identified without any significant seismic phase information, because they cannot detect the refracted waves from the Moho (Pn waves) by the experiment caused by the short length less than 200 km over the whole profile. Shallow part of the crust velocity model by [15] corresponds to the gravity-based model from this study. Lateral variations in P-wave velocities in the upper crust can be explained by assuming the low-density material in the topmost crust. For further study, we might investigate the validity of this boundary’s variation by means of a comparison with the other available geophysical data such as geomagnetic anomalies, satellite gravity, together with detail reflection imaging.
5. Conclusion
A gravity survey was carried out on the Mizuho Plateau as one of the geophysical measurements by the SEAL exploration in 2001-2002. The gravity measurements were conducted along the seismic profile of 150 km in length. Free-air and Bouguer anomalies were calculated using the precise locations determined by GPS observations, by considering the effect of thick ice-sheet. The furrowed and basin-like negative Free-air anomalies were obtained in the central and northern parts of the profile. The crustal thickness was demonstrated so as to fit the observed Bouguer anomalies. Our gravimetric results are almost corresponding to the P-wave velocity structure by refraction and wide-angle reflection study [15].
Acknowledgements
The authors would like to express sincere thanks to the involved members of the JARE-43 seismic survey for their great efforts to carry out the field operations: Messrs D. Kamiya, T. Nakamura, N. Yoshida, Y. Takahashi, M. Yanagisawa, N. Ishizaki, K. Nakano, T. Yasuhara, S. Iwano and K. Horiguchi. They are also grateful to the expedition members of the JARE-43 (lead by Profs. F. Nishio and the sub leader Prof. K. Kamiyama), members of JARE-42 (the leader Prof. Motoyoshi) and crews of icebreaker “Shirase” (the captain Y. Ishikado). They wish to express their sincere thankfulness to Profs. K. Kaminuma, K. Shibuya, Y. Nogi and other staffs of the National Institute of Polar Research. They would also like to express sincere acknowledgments to Prof. Y. Fukuda of Kyoto University for his fruitful suggestions for analyzing the data.
REFERENCES
[1] Y. Hiroi, K. Shiraishi and Y. Motoyoshi, “Late Proterozoic Paired Metamorphic Complexes in East Antarctica, with Special Reference to the Tectonic Significance of Ultramafic Rocks,” In: M. R. A. Thomson, et al., Eds., Geological Evolution of Antarctica, Cambridge University Press, Cambridge, 1991, pp. 83-87.
[2] K. Yanai and S. Kaminuma, “Measurement of Gravity along the Traverse Routes Syowa-South Pole,” JARE Sci. Rep., Spec., Vol. 2, 1971, pp. 131-150.
[3] T. Nagao and K. Kaminuma, “Gravity Survey in the Mizuho Plateau,” JARE Data Reports, Vol. 132, 1988, pp. 1-32.
[4] K. Kamiyama, T. Furukawa, H. Maeno, T. Kishi and M. Kanao, “Glaciological Data Collected by the 33rd Japanese Antarctic Research Expedition in 1992,” JARE Data Reports, Vol. 194, 1994, pp. 1-67.
[5] T. Higashi, M. Kanao, H. Motoyama and T. Yamanouchi, “Gravity Observations along the Traverse Routes from Syowa Station to Dome Fuji Station, East Antarctica,” Polar Geoscience, Vol. 14, 2001, pp. 226-234.
[6] M. Kanao, K. Kamiyama and K. Ito, “Crustal Density Structure of the Mizuho Plateau, East Antarctica from Gravity Survey in 1992,” Polar Geoscience, Vol. 7, 1994, pp. 23-36.
[7] M. Kanao, M. Ishikawa, M. Yamashita, K. Kaminuma and L. D. Brown, “Structure and Evolution of the East Antarctic Lithosphere: Tectonic Implications for the Development and Dispersal of Gondwana,” Gondwana Research, Vol. 7, No. 1, 2004, pp. 31-41. http://dx.doi.org/10.1016/S1342-937X(05)70304-X
[8] M. Kanao, A. Fujiwara, H. Miyamachi, S. Toda, M. Tomura, K. Ito and T. Ikawa, “Reflection Imaging of the Crust and the Lithospheric Mantle in the Lützow-Holm Complex, Eastern Dronning Maud Land, Antarctica, Derived from the SEAL Transects,” Tectonophysics, Vol. 508, No. 1-4, 2011, pp. 73-84. http://dx.doi.org/10.1016/j.tecto.2010.08.005
[9] H. Miyamachi, H. Murakami, T. Tsutsui, S. Toda, T. Minta and M. Yanagisawa, “A Seismic Refraction Experiment in 2000 on the Mizuho Plateau, East Antarctica (JARE-41),” Antarctic Report, Vol. 45, 2001, pp. 101- 147.
[10] T. Tsutsui, H. Murakami, H. Miyamachi, S. Toda and M. Kanao, “P-Wave Velocity Structure of the Ice Sheet and the Shallow Crust Beneath the Mizuho Traverse Routes, East Antarctica, from Seismic Refraction Analysis,” Polar Geoscience, Vol. 14, 2001, pp. 195-211.
[11] S. Toda, H. Miyamachi, H. Murakami, T. Tsutsui and M. Kanao, “Gravity Survey along the Mizuho Traverse Routes, East Antarctica: SEAL Seismic Exploration in 1999-2000,” International Journal of Geosciences, Vol. 4, No. 10, 2013, pp. 1392-1400. http://dx.doi.org/10.4236/ijg.2013.410136
[12] H. Miyamachi, S. Toda, T. Matsushima, M. Takada, Y. Takahashi, D. Kamiya, A. Watanabe, M. Yamashita and M. Yanagisawa, “A Seismic Refraction and Wide-Angle Reflection Exploration in 2002 on the Mizuho Plateau, East Antarctica,” Antarctic Report, Vol. 47, 2003, pp. 32- 71.
[13] K. Kaminuma, K. Tsukahara and S. Takemoto, “Absolute Gravity Value Measured at Syowa Station, Antarctica,” Bulletin of the D’Information BGI, Vol. 80, 1997, pp. 26- 29.
[14] M. Takada, S. Toda, D. Kamiya and H. Miyamachi, “The Ice Radar Survey along the JARE-43 Seismic Exploration Profile in the Mizuho Plateau, East Antarctica,” Antarctic Report, Vol. 47, 2003, pp. 380-394.
[15] H. Miyamachi, S. Toda,, T. Matsushima, M. Takada, A. Watanabe, M. Yamashita and M. Kanao, “Seismic Refraction and Wide-Angle Reflection Exploration by JARE- 43 on Mizuho Plateau, East Antarctica,” Polar Geoscience, Vol. 16, 2003, pp. 1-21.
[16] H. Maeno, K. Kamiyama, T. Furukawa, O. Watanabe, R. Naruse, K. Okamoto, T. Suitz and S. Uratsuka, “Using a Mobile Radio Echo Sounder to Measure Bedrock Topography in East Queen Maud Land, Antarctica,” Polar Meteorology and Glaciology, Vol. 8, 1994, pp. 149-160.
NOTES
*Corresponding author.