International Journal of Geosciences
Vol.5 No.4(2014), Article ID:45271,11 pages DOI:10.4236/ijg.2014.54037
An Optical High and Medium Spatial Resolution Approach for Erosion-Prone Areas Assessment in Mustang, Nepal
Kabir Uddin, Madhav Dhakal, Govinda Joshi
International Centre for Integrated Mountain Development, Kathmandu, Nepal
Email: kuddin@icimod.org
Copyright © 2014 by authors and Scientific Research Publishing Inc.
This work is licensed under the Creative Commons Attribution International License (CC BY).
http://creativecommons.org/licenses/by/4.0/


Received 11 September 2013; revised 12 October 2013; accepted 13 November 2013
ABSTRACT
Every year during the rainy season, water-induced soil erosion poses serious spatial-environmental problems, causing heavy damage to agricultural lands, sedimentation in reservoirs, and water quality problems in nearby surface water bodies, from the plains to the mountain areas in Nepal. The goal of this study is to identify potential areas for soil erosion in sub and macro watershed in Mustang, Nepal using remote sensing (RS) and geographic information systems (GIS) techniques. The study examines the possibility of advanced mapping of soil erosion-prone areas using a high spatial resolution image of QuickBird satellite and medium spatial resolution of Landsat satellite. The satellite image was classified using object-based image analysis (OBIA) techniques, taking into account spectral, spatial, and context information as well as hierarchical properties. The resulting land cover classification was thereafter combined with additional data in ArcGIS, where the input layers were reclassified and all classes of the input layers were ranked according to their proneness to soil erosion. Soil erosion-prone areas were delineated in five classes ranging from “very high” to “very low”. Using high spatial resolution image the study revealed that 22% area categorized as “high erosion-prone” areas and 5% as “very high” or “extremely erosion-prone”. Using medium resolution image the study exposed that 27% area categorized as “high erosion-prone” areas and 6% as “very high” or “extremely erosion-prone”. Comparison between two analysed erosion results almost all the erosion zone area was very close excluding medium erosion-prone category. The study proved GIS modeling techniques can successfully identify soil erosion-prone areas. The soil erosion-prone map produced out of the exercise can be used in decision making, particularly in selecting conservation measures to reduce soil loss.
Keywords:Remote Sensing, GIS, OBIA, Soil Erosion, Watershed

1. Introduction
Alterations in land use and land cover have increased erosion rates in many areas of the world, causing considerable land and environmental degradation. Soil erosion is a worldwide environmental problem that degrades soil productivity and water quality, causes sedimentation and increases the probability of floods [1] -[3] . The main causes of soil erosion are inappropriate agricultural practices, deforestation, overgrazing, land abandonment, forest fires, and construction activities [4] -[6] . Land degradation stems from a combination of changes in land use including agricultural intensification. Erosion may also be exacerbated in the future because of a more vigorous hydrologic cycle as a result of climate change [7] -[10] . Due to the diverse topographic characteristics, geology and geomorphology mountain region reported to have high vulnerability to soil erosion. The entire Himalayan region is afflicted with a serious problem of soil erosion and rivers, flowing through this region, transport a heavy load of sediment [11] -[16] .
Nepal is one of the most affected areas by soil erosion, sediment transport and land degradation. The land and water resources of the watershed level are in risk due to the rapid growth of population, deforestation, soil erosion, sediment deposition, controlling natural drainage and flooding [17] -[21] . Spatial and quantitative information on soil erosion on a watershed scale contributes significantly to the planning for soil conservation, erosion control, and management of the watershed environment. In this context, as part of adaptation strategies on several soil and water conservation initiatives reliable quantitative information is required on soil loss. Research on erosion topics has a long scientific history and in the last few decades there have been several attempts to determine soil erosion at basin scale in Nepal [22] -[26] . This kind of information is generated using Universal soil loss equation (USLE), curve number methods, direct field sediment measurements and are often available at watershed and catchment level [27] -[30] . The application of such methods at sub and macro watershed level would have been a difficult proposition due to intensive spatial data requirements on soil, historical rainfall patterns, and land cover management and practices factor followed. No such efforts are available and widely used at sub and macro watershed level across the region. Therefore soil erosion risk area mapping using parameters that are sensitive to soil erosion (e.g. terrain and vegetation indices) could be an alternative proposition [31] -[34] and such kind of data would be useful for spatial planning process for soil conservation in sub and macro watersheds. Produced products will have potential use to a wide variety of community user groups, local level organisations focusing on field level planning. ICIMOD as a regional knowledge development centre is focusing to develop value added thematic products as a service to HKH community of planners using the potential of public domain geospatial data.
2. Methodology
2.1. Study Area
Delineation of geographic area of watersheds is first step in watershed prioritization and management. Watershed could be classified into a number of groups depending upon the mode of classification. The usually accepted five levels of watershed delineation based on geological area and with the five types watershed macro Watershed (>500 Km2) and Sub watershed (100 to 500 Km2) [35] [36] . During the watershed delineation in ArcGIS consecutively filled DEM, flow direction, sink, flow accumulation, set null, stream link, stream order, and watershed command were used. Both sub and macro watershed is situated along one of the main tributaries of the Kali Gandaki River in the northern part of Mustang district, Nepal. Location of delineated watershed can be seen from the Figure 1. The total area of the sub watershed and macro is accordingly 33.56 Km2 and 853.96 Km2. The boundary coordinates of the sub watershed and macro accordingly 83.70 to 83.78 East longitudes 28.86 to 28.80 North latitudes and 83.50 to 83.94 East longitudes 28.88 to 28.50 North latitudes. Based on the ASTER digital elevation model (DEM), minimum elevation of the sub watershed is 2778 m and maximum elevation 5575 m; the slopes ranges from 54 to 0 degrees. Figure 2 shows that three main villages can be found along the sub watershed—Panglin, Phalyak and Dhagarjung. Minimum elevation of the macro watershed is 1268 m and maximum elevation 7824 m and slope ranges from 73 to 0 degrees. Sub and macro watershed area (Mustang district) is well known for its pristine biodiversity, spectacular scenery, and the world’s deepest gorge, the Kali Gandaki. Mean annual rainfall and number of rainy days in Mustang district is reported as 480 mm, and 61 days respectively.
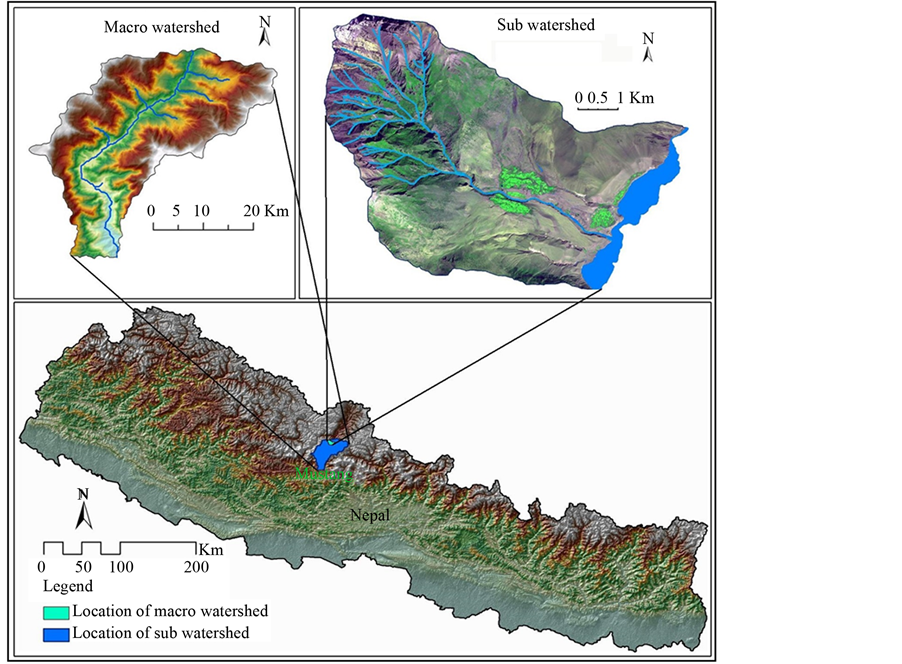
Figure 1. Location map of study area.

Figure 2. Virtual view of sub and macro watershed.
2.2. Data Used
The increased access and diversity of public domain geospatial information of multi resolution satellite data, digital elevation information and web enabled dissemination systems have enhanced the potential of developing customised thematic products. In this context an immense scope exists to demarcate relative differences in soil proneness at watershed level using publicly available Landsat Thematic Mapper TM satellite data and Advanced Space Borne Thermal Emission and Reflection Radiometer (ASTER) based digital elevation. The current study evaluates the process of developing such products and their information value at different scales across contrasting watersheds of Nepal using multi resolution satellite data. As sub watershed comparatively smaller, for that very high spatial resolution (2.4 m) satellite image from the QuickBird satellite and for macro watershed medium spatial resolution (30 m) satellite image from the Landsat satellite (path 142 and row 40) was used to generate land cover map. ASTER digital elevation model of 30 meter resolution was used during the analysis.
2.3. Land Cover Data Preparation
A hierarchical classification scheme adopted for land cover mapping at sub and macro watershed land cover mapping. For QuickBird images XXI number classes and for TM images XII number classes were generated. Using QuickBird images major cover classes attempted are Broadleaved closed forest, Broadleaved open forest, Needleleaved closed forest, Needleleaved open forest, Shrub land closed, Shrub land open, Shrub land sparse, Shrub land savannah, Orchard, Grass land closed, Grass land open, Grass land sparse, Crop land, Fallow land, Barren soil, Barren rock, River, Lake, Snow/ice, Settlement and Road. Using TM images major cover classes attempted are Broadleaved closed forest, Broadleaved open forest, Needleleaved closed forest, Needleleaved open forest, Shrubland, Grassland, Agriculture, Barren area, Lake, River, Snow/glacier and Built-up area. Land cover information was derived consists of pre-processing and classification using object based algorithms. The QuickBird image was ortho-rectified into UTM, Zone 44 based on ASTER DEM and RPC file of the QuickBird image. After that QuickBird and TM images analysed for land cover mapping in eCognition developer software was using object-based image analysis (OBIA). Workflow of image classification as can be seen from the Figure 3.
Numerous studies have shown that an object-based approach yields better classification results with higher degree of accuracy compared to pixel-based methods. This is because of OBIA considered both spectral and spatial information in image objects [37] -[43] . The basic step in object based image analysis is to derive homogeneous image objects through segmentation. Multi-resolution segmentation, a region-based local mutual best fitting segmentation approach [44] implemented in the eCognition software, groups areas of similar pixel values into objects, was used. Under this system homogeneous areas result in larger objects, heterogeneous areas in smaller ones several segmentations were tested using different parameters until the results were satisfying. During the classification, information on spectral values, vegetation indices like the normalized difference vegetation index (NDVI), normalized difference snow and ice index (NDSII), land water mask (LWM) created through band rationing, slope and texture information, were used. With each image object assigned rules a specific class, a continuous land cover map can be derived. Objects with an area smaller than the defined minimum mapping unit were merged with other objects. The classified land cover map of watershed was exported to a raster file format for further use in soil erosion prone areas modelling. TM based land cover is made on same principle.
2.4. Soil Erosion Assessment
While rainfall and soil are the primary driving variables for the cause of soil erosion, the land cover and topography are the regulators of the level of erosion. The study does not have any support data on spatial variability
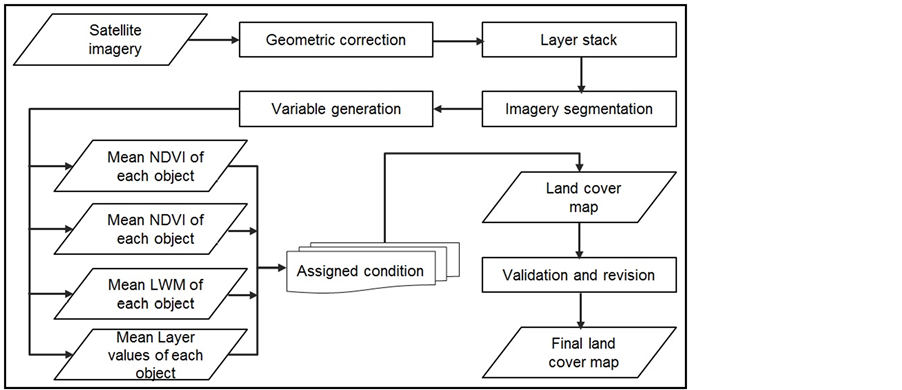
Figure 3. Workflow of image classification.
on rainfall and soil to include in proneness assessment. Considering this, emphasis is given to delineate erosion proneness areas using land cover and topographic information and NDVI [31] . Land cover is rated as one of the most important factors affecting the intensity and frequency of overland flow and surface wash erosion [27] [45] [46] . The roots of plants and trees interlock and interlace to bind soil particles and reduce the erosive effect of raindrops on bare soil and barring the free flow of water over the soil, thus preventing flowing water from eroding the soil. It is the most dynamic factor in a watershed, which can be readily altered to control the loss of water and soil. Therefore the erosion proneness is perceived to be very high over the area with no vegetal cover and low with areas having perennial vegetal cover. The different land cover classes obtained using high and medium resolution data are accordingly scaled from low to high in terms of erosion proneness. Higher values were assigned to bare soil, agricultural land, and human habitation land use categories. Lower values were assigned for scrubs and least values for forests.
Several soil chrono sequenced sampling studies have revealed a fact that rapid land cover dynamics over an area change the soil development and effecting the stability of a given soil type. These processes change at decadal time scales. In view of this greenness values from NDVI (1990 and 1999) considered an important variable in weighing the erosion proneness area. NDVI is calculated based on Landsat TM reflectance values over red and near infra-red regions which are sensitive to greenness stock levels. Higher the greenness values and lowers the erosion proneness and vice versa. The areas which do not have undergone any land cover change over the last thirty years are rated as low erosion proneness areas.
Slopes are important variable of landform that affects erosion processes for all types of soil erosion. The effect of the slope gradient’s high value on soil erosion and sediment losses is so significant that it revokes the protection provided by vegetation or soil properties [47] [48] . When slope gradient is steep (25%), soil erosion increases significantly, probably because the dense protective cover of annual plants decreases and shrub vegetation cover increases. At the same time, bare soil surface below the shrubs’ foliage also increases, while dry stone terraces supporting soil material and runoff water collapse [49] . In order capture such slope based impacts on erosion; percentage slope map was generated at 30m spatial resolution using ASTER DEM. The higher slope % classes were rated with high proneness values. The distance to 3rd and 4th order streams was also calculated using Euclidean distance function and faraway from 3rd and 4th order streams were given low weightage to erosion proneness.
The logic based rules were constructed using spatial data on land cover type, greenness value of NDVI, slope and distance to streams in the ArcGIS ModelBuilder. The ModelBuilder is a graphic programming environment within ArcGIS. The tool box has a large set of geo-processing tools which can be used to address complex geographical analysis. ModelBuilder is an easy to use application for creating and running workflows containing sequence of tools. Developed model helps to manage and automate the geo processing workflow and can be run multiple times to assess the results on iterative process. Land cover, NDVI and slope and Euclidean distance of drainage were reclassified in the Model Builder to rank the classes of the input layers according to their vulnerability to soil erosion. Once all layers were reclassified and each assigned a rank, using the weighted overlay tool in ModelBuilder the input layers have been given equals weights. The classes of each dataset were ranked in a scale of 1-4, “1” being the highest ranking and “5” the lowest, or 5: Very high, 4: High, 3: Medium, 2: Low, and 1: Very low. The ranks of each class for a given cell were linearly summed to get value representing Erosion Prone. From Figure 4 it can be seen steps followed in carrying out a soil erosion prone area analysis in ArcGIS ModelBuilder. The output map on soil erosion proneness was developed at output resolution of 30 meters.
3. Results and Discussion
3.1. High Resolution Assessment
Figure 5 shows a land cover map derived from QuickBird satellite images. The land cover analysis results revealed that the dominant land covers in the sub watershed was shrub land (35%), followed by grassland (32%). Around 2% of the middle-western part of the study area is forested area. Predicted soil erosion prone areas of the sub watershed, only about 5%, mostly found in the north, west and east-west parts of the study area can be categorized as “very high” or extremely erosion prone area (as shown in Figure 6). The high soil loss is related to the close relationship with barren areas, slope length, and slope steepness. 22% of the watershed is categorized as “high erosion-prone” areas. These areas are mostly found in the north, west, and east-west parts of the study area. Large tracts of the medium erosion-prone zone are found in the central part of the watershed. In

Figure 4. Schematic methodology of soil erosion-prone area analysis in ArcGIS ModelBuilder.

Figure 5. Land cover map of sub watershed (2010).

Figure 6. Map of soil erosion-prone areas, sub watershed.
lining up a series of corrective or mitigating measures, priority must be given to protecting the forest and afforestation of barren land to reduce soil loss and sediment. 24% or a quarter of the study area falls under the category of low erosion prone area. This zone is categorized as having a healthy vegetation of forest and shrub moderate slopes.
3.2. Medium Resolution Assessment
According to the Landsat TM land cover classification product, bare area account for more than 38% of the area and followed grassland 20%. Forest covers around 8% mainly alongside the Kali Gandaki. Predicted soil erosion prone areas of the macro watershed, only about 9%, mostly found in the north and east parts of the macro watershed study area categorized as “very high” or extremely erosion prone area. Large area (36%) of the watershed is categorized as “high erosion-prone” areas. These areas are mostly found in the north, west, and eastwest parts of the study area. “Medium erosion-prone zone” are found in the central part of the watershed. 28% or a quarter of the study area falls under the category of low erosion prone area. This zone is categorized as having a healthy vegetation of forest and shrub moderate slopes. From the Figure 7 it can be shown soil erosion-prone areas in the macro watershed.
3.3. Comparative Evaluation
Some difference in medium erosion class is observed with underestimation of 17% in area by 30 m resolution assessment. It was found that the differences are due to high resolution land cover providing great deal of variability and associated topographic condition. The land cover classes which are on the edges and sub pixel heterogeneity of 30 meter resolution pixels is further detailed using 0.5 m resolution. It can be seen from the figure that most of the differences are found in the edge areas and high land cover variability zones of very high resolution land cover classification map. This has resulted in significant variation in classes like forest and shrub
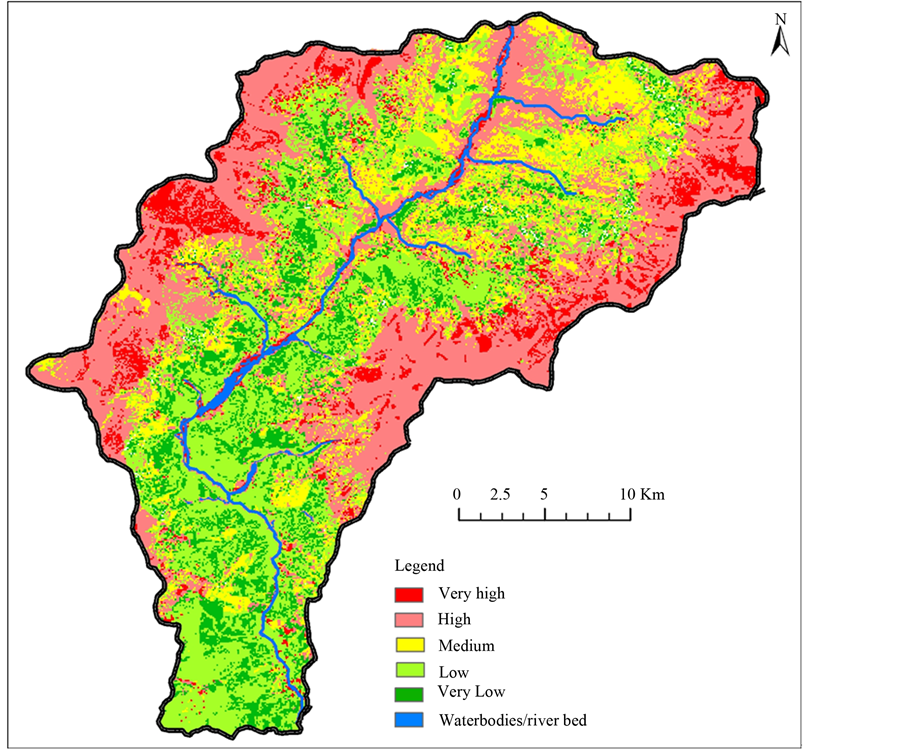
Figure 7. Map of soil erosion-prone areas, macro watershed.
land which have different variability in erosion proneness.
In addition the areas where differences in land cover characteristics have arisen also have different topographic conditions such as slope, elevation and distance to 3rd order and above streams. The study has brought a conclusion that significant differences in erosion proneness assessment results due to use of high resolution land cover based on aggregation and disaggregation in to a specific land cover class and associated topographic condition at that position. The degree of variability between erosion maps of different resolutions depend on how a given watershed is spatially heterogeneous and hence coarse resolution erosion proneness maps should use with a caution over heterogeneous landscapes and needs appropriate information augmentation with very high resolution information.
4. Conclusion
Satellite images represent a vast resource for enhancing environmental mapping, fire modelling, and now, the latest addition to these functions is its role in tracking soil conservation. The study demonstrated an efficient way to determine soil erosion-prone areas through the combined use of remote sensing and GIS. OBIA and GIS can be used to identify soil erosion-prone areas in other study areas in Nepal and beyond for the purpose of minimising soil loss. The study attempted to generate an accurate land cover map using object-based image analysis with high spatial resolution satellite images within a short time frame. GIS analysis has taken into consideration a wide range of suitability parameters in identifying soil erosion prone areas. The mapping of soil prone areas will be helpful in giving priority to the protection of forests and to afforestation of bare lands to reduce soil loss and sedimentation.
Acknowledgements
I am glad to acknowledge to Dr. Manchiraju Sri Ramachandra Murthy and Mr. Birendra Bajracharya for the kind feedback. I acknowledged the Asian Development Bank (ADB) for supporting the initiative by funding the High Mountain Agribusiness and Livelihood Project (HIMALI). Thanks are also offered to Mrs Renate Fleiner extensive field information for the land cover validation. Our gratitude goes especially to Mr Basanta Shrestha, Head, MENRIS and Dr Rajan Kotru Team Leader, InFEWS, Ecosystem Services for the encouragement and support extended to bring out this report. Cordial thanks goes to our project partners Local Initiatives for Biodiversity, Research and Development (LI-BIRD) for a good and pleasant cooperation Local Initiatives for Biodiversity, Research and Development (LI-BIRD).
References
- Molnar, P. (2001) Climate Change, Flooding in Arid Environments, and Erosion Rates. Geology, 29, 1071-1074. http://dx.doi.org/10.1130/0091-7613(2001)029<1071:CCFIAE>2.0.CO;2
- Poesen, J. and Hooke, J. (1997) Erosion, Flooding and Channel Management in Mediterranean Environments of Southern Europe. Progress in Physical Geography, 21, 157-199. http://dx.doi.org/10.1177/030913339702100201
- Wondzell, S.M. and King, J.G. (2003) Postfire Erosional Processes in the Pacific Northwest and Rocky Mountain Regions. Forest Ecology and Management, 178, 75-87. http://dx.doi.org/10.1016/S0378-1127(03)00054-9
- Grimm, M., Jones, R. and Montanarella, L. (2001) Soil Erosion Risk in Europe. EUR 19939 EN, 38 pp. Office for Official Publications of the European Communities, Luxembourg.
- Yassouglou, N., Montanarella, L., Govers, G., Van Lynden, G., Zdruli, P., Kirkby, M., et al. (1998) Soil Erosion in Europe. Report Prepared by the Soil Erosion Working Group of The European Soil Bureau for the European Environmental Agency, 1-12.
- Parveen, R. and Kumar, U. (2012) Integrated Approach of Universal Soil Loss Equation (USLE) and Geographical Information System (GIS) for Soil Loss Risk Assessment in Upper South Koel Basin, Jharkhand. Journal of Geographic Information System, 4, 588-596. http://dx.doi.org/10.4236/jgis.2012.46061
- Amore, E., Modica, C., Nearing, M.A. and Santoro, V.C. (2004) Scale Effect in USLE and WEPP Application for Soil Erosion Computation from Three Sicilian Basins. Journal of Hydrology, 293, 100-114.
- Nearing, M., Pruski, F. and O’Neal, M. (2004) Expected Climate Change Impacts on Soil Erosion Rates: A Review. Journal of Soil and Water Conservation, 59, 43-50.
- Valentin, C. (1996) Soil Erosion under Global Change. In: Walker, B.H. and Steffen, W.L., Eds., Global Change and Terrestrial Ecosystems, Cambridge University Press, Cambridge, 317-338.
- Pruski, F. and Nearing, M. (2002) Climate-Induced Changes in Erosion during the 21st Century for Eight US Locations. Water Resources Research, 38, 34-1-34-11.
- Jain, S.K., Kumar, S. and Varghese, J. (2001) Estimation of Soil Erosion for a Himalayan Watershed Using GIS Technique. Water Resources Management, Vol. 15, Kluwer Academic Publishers, Dordrecht, 41-54.
- Narayana, D.V. and Babu, R. (1983) Estimation of soil erosion in India. Journal of Irrigation and Drainage Engineering, 109, 419-434. http://dx.doi.org/10.1061/(ASCE)0733-9437(1983)109:4(419)
- Sen, K., Rao, K. and Saxena, K. (1997) Soil Erosion Due to Settled Upland Farming in the Himalaya: A Case Study in Pranmati Watershed. The International Journal of Sustainable Development & World Ecology, 4, 65-74. http://dx.doi.org/10.1080/13504509709469942
- Jasrotia, A. and Singh, R. (2006) Modeling Runoff and Soil Erosion in a Catchment Area, using the GIS, in the Himalayan Region, India. Environmental Geology, 51, 29-37. http://dx.doi.org/10.1007/s00254-006-0301-6
- Dabral, P., Baithuri, N. and Pandey, A. (2008) Soil Erosion Assessment in a Hilly Catchment of North Eastern India Using USLE, GIS and Remote Sensing. Water Resources Management, 22, 1783-1798. http://dx.doi.org/10.1007/s11269-008-9253-9
- Carson, B. (1985) Erosion and Sedimentation Processes in the Nepalese Himalaya [of Soil]. ICIMOD Occasional Paper, Kathmandu.
- Awasthi, K., Sitaula, B., Singh, B. and Bajacharaya, R. (2002) Land-Use Change in Two Nepalese Watersheds: GIS and Geomorphometric Analysis. Land Degradation & Development, 13, 495-513. http://dx.doi.org/10.1002/ldr.538
- Gautam, A.P., Webb, E.L., Shivakoti, G.P. and Zoebisch, M.A. (2003) Land Use Dynamics and Landscape Change Pattern in a Mountain Watershed in Nepal. Agriculture, Ecosystems & Environment, 99, 83-96. http://dx.doi.org/10.1016/S0167-8809(03)00148-8
- Thapa, G.B. (1996) Land Use, Land Management and Environment in a Subsistence Mountain Economy in Nepal. Agriculture, Ecosystems & Environment, 57, 57-71. http://dx.doi.org/10.1016/0167-8809(96)88021-2
- Ives, J. and Pitt, D.C. (1988) Deforestation: Social Dynamics in Watersheds and Mountain Ecosystems. Routledge, London.
- Tiwari, K.R., Sitaula, B.K., Nyborg, I.L. and Paudel, G.S. (2008) Determinants of Farmers’ Adoption of Improved Soil Conservation Technology in a Middle Mountain Watershed of Central Nepal. Environmental Management, 42, 210- 222. http://dx.doi.org/10.1007/s00267-008-9137-z
- Sharma, C.K. (1976) Landslides and Soil Erosion in Nepal. Navana Printing Works Pvt. Ltd, Kolkata, 112 p.
- Gardner, R.A.M. and Gerrard, A.J. (2003) Runoff and Soil Erosion on Cultivated Rainfed Terraces in the Middle Hills of Nepal. Applied Geography, 23, 23-45. http://dx.doi.org/10.1016/S0143-6228(02)00069-3
- Byers, A. (1986) A Geomorphic Study of Man-Induced Soil Erosion in the Sagarmatha (Mount Everest) National Park, Khumbu, Nepal: Report on the Activities of the UNU/MAB (Nepal) Mountain Hazards Mapping Project, Phase II. Mountain Research and Development, 6, 83-87. http://dx.doi.org/10.2307/3673343
- Watanabe, T. (1994) Soil Erosion on Yak-Grazing Steps in the Langtang Himal, Nepal. Mountain Research and Development, 14, 171-179. http://dx.doi.org/10.2307/3673799
- Gabet, E.J., Burbank, D.W., Pratt-Sitaula, B., Putkonen, J. and Bookhagen, B. (2008) Modern Erosion Rates in the High Himalayas of Nepal. Earth and Planetary Science Letters, 267, 482-494. http://dx.doi.org/10.1016/j.epsl.2007.11.059
- García-Ruiz, J.M. (2010) The Effects of Land Uses on Soil Erosion in Spain: A Review. Catena, 81, 1-11. http://dx.doi.org/10.1016/j.catena.2010.01.001
- Stone, R.P. and Ontario, F. (2000) Universal Soil Loss Equation (USLE). Agricultural and Rural Ministry of Agriculture, Food and Rural Affairs, Ontario, Canada.
- Singh, V.P. (2003) Soil Conservation Service Curve Number (SCS-CN) Methodology. Vol. 42, Springer, Berlin.
- Yoder, R.E. (1936) A Direct Method of Aggregate Analysis of Soils and a Study of the Physical Nature of Erosion Losses. Agronomy Journal, 28, 337-351. http://dx.doi.org/10.2134/agronj1936.00021962002800050001x
- Sharma, A. (2010) Integrating Terrain and Vegetation Indices for Identifying Potential Soil Erosion Risk Area. Geo- Spatial Information Science, 13, 201-209. http://dx.doi.org/10.1007/s11806-010-0342-6
- Avtar, R., Singh, C.K., Shashtri, S. and Mukherjee, S. (2011) Identification of Erosional and Inundation Hazard Zones in Ken-Betwa River Linking Area, India, Using Remote Sensing and GIS. Environmental Monitoring and Assessment, 182, 341-360. http://dx.doi.org/10.1007/s10661-011-1880-6
- Zhang, X., Wu, B., Ling, F., Zeng, Y., Yan, N. and Yuan, C. (2010) Identification of Priority Areas for Controlling Soil Erosion. Catena, 83, 76-86. http://dx.doi.org/10.1016/j.catena.2010.06.012
- Vrieling, A., De Jong, S.M., Sterk, G. and Rodrigues, S.C. (2008) Timing of Erosion and Satellite Data: A Multi-Resolution Approach to Soil Erosion Risk Mapping. International Journal of Applied Earth Observation and Geoinformation, 10, 267-281. http://dx.doi.org/10.1016/j.jag.2007.10.009
- Thakare, P.R., Jadhav, R.A. and Kumawat, H.S. (2013) Watershed Management—A Case Study of Satara Tanda Village. International Journal of Innovative Technology and Exploring Engineering, 3, 92-96.
- Babar, M. (2005) Hydrogeomorphology: Fundamentals, Applications and Techniques. New India Publishing, New Delhi.
- Blaschke, T., Lang, S. and Hay, G. (2008) Object-Based Image Analysis: Spatial Concepts for Knowledge-Driven Remote Sensing Applications. Springer, New York.
- Civco, D.L., Hurd, J.D., Wilson, E.H., Arnold, C.L. and Prisloe, M.P. (2002) Quantifying and Describing Urbanizing Landscapes in the Northeast United States. Photogrammetric Engineering and Remote Sensing, 68, 1083-1090.
- Harken, J. and Sugumaran, R. (2005) Classification of Iowa Wetlands Using an Airborne Hyperspectral Image: A Comparison of the Spectral Angle Mapper Classifier and an Object-Oriented Approach. Canadian Journal of Remote Sensing, 31, 167-174. http://dx.doi.org/10.5589/m05-003
- Chettri, N., Uddin, K., Chaudhary, S. and Sharma, E. (2013) Linking Spatio-Temporal Land Cover Change to Biodiversity Conservation in the Koshi Tappu Wildlife Reserve, Nepal. Diversity, 5, 335-351. http://dx.doi.org/10.3390/d5020335
- Wang, L., Sousa, W. and Gong, P. (2004) Integration of Object-Based and Pixel-Based Classification for Mapping Mangroves with IKONOS Imagery. International Journal of Remote Sensing, 25, 5655-5668. http://dx.doi.org/10.1080/014311602331291215
- Yan, G., Mas, J.F., Maathuis, B., Xiangmin, Z. and Van Dijk, P. (2006) Comparison of Pixel-Based and ObjectOriented Image Classification Approaches—A Case Study in a Coal Fire Area, Wuda, Inner Mongolia, China. International Journal of Remote Sensing, 27, 4039-4055. http://dx.doi.org/10.1080/01431160600702632
- Bajracharya, B., Uddin, K., Chettri, N., Shrestha, B. and Siddiqui, S.A. (2010) Understanding Land Cover Change Using a Harmonized Classification System in the Himalaya. International Mountain Society, Mountain Research and Development, 30, 143-156.
- Baatz, M. and Schäpe, A. (2000) Multiresolution Segmentation: An Optimization Approach for High Quality MultiScale Image Segmentation. Angewandte Geographische Informationsverarbeitung, 12, 12-23.
- Kosmas, C., Danalatos, N., Cammeraat, L.H., Chabart, M., Diamantopoulos, J., Farand, R., et al. (1997) The Effect of Land Use on Runoff and Soil Erosion Rates under Mediterranean Conditions. Catena, 29, 45-59. http://dx.doi.org/10.1016/S0341-8162(96)00062-8
- Mitchell, D. and Thornes, J. (1990) The Use of Vegetation and Land Use Parameters in Modelling Catchment Sediment Yields. In: Vegetation and Erosion. In: Thornes, J.B., Ed., Processes and Environments, John Wiley & Sons, Chichester, 289-316.
- Morgan, R.P.C. (2009) Soil Erosion and Conservation. Wiley.com.
- Fox, D.M. and Bryan, R.B. (2000) The Relationship of Soil Loss by Interrill Erosion to Slope Gradient. Catena, 38, 211-222. http://dx.doi.org/10.1016/S0341-8162(99)00072-7
- Koulouri, M. and Giourga, C. (2007) Land Abandonment and Slope Gradient as Key Factors of Soil Erosion in Mediterranean Terraced Lands. Catena, 69, 274-281. http://dx.doi.org/10.1016/j.catena.2006.07.001