International Journal of Geosciences
Vol.4 No.7(2013), Article ID:36759,6 pages DOI:10.4236/ijg.2013.47095
Integration of Remote Sensing and GIS in Studying Land Cover Trends and Conditions in the Middle Ziz Oasis, Morocco
1Research Group “Water Sciences and Environmental Engineering”, Laboratory of Geo-Engineering and Environment, Faculty of Sciences, My Ismaïl University, Meknes, Morocco
2Laboratory LIMEN “Water Resources & Information Technology”, Mohammadia School of Engineers, Rabat, Morocco
3Department of Geology, Faculty of Sciences, Dhar El Mahraz, Fez, Morocco
Email: essahlaoui@gmail.com
Copyright © 2013 Ali Essahlaoui et al. This is an open access article distributed under the Creative Commons Attribution License, which permits unrestricted use, distribution, and reproduction in any medium, provided the original work is properly cited.
Received February 8, 2013; revised March 12, 2013; accepted April 6, 2013
Keywords: Morocco; Remote Sensing; GIS; Ziz Watershed; Dynamic of Land Use; NDVI
ABSTRACT
A better understanding of the changing patterns of land use and vegetation cover is a major concern for countries whose ecosystems are under severe degradation. Indeed, the dynamics of land have direct implications on the availability of natural resources. The palm grove, of oases of Errachidia region, plays an important role in the environmental, social and economic of this region. This research was conducted in the Ziz middle, which is affected by changes in the conditions and composition of land cover change. The application of remote sensing, geographic information systems and satellite imagery analysis with multi-temporal and spatial land use provides, for territorial managers, data updated and improved and a synopsis for effective management of natural resources. This research explores the possibility of identifying, monitoring and mapping land use change and land use on the dynamics of the palm grove in the past 40 years. Satellite images used are Landsat images and multi-temporal dates (MSS (1972), TM (1987), ETM + (2001, 2006 and 2011). These images were georeferenced and radiometrically corrected. In our study, the use of vegetation indices NDVI, SAVI and MASAVI, highlight the magnitude of changes in vegetation cover between 1972 and 2011. A regressive pronounced canopy is generally recognized in the Middle Ziz. This decline is explained by the combined effect of anthropic action (urbanization) and climatic conditions.
1. Introduction
In Morocco, the scarcity and randomness of rainfall and desertification are increasingly worrying and threatening farmland and irrigation infrastructure. Errachidia region, located in the southern Atlas of Morocco, is facing enormous difficulties combining scarcity and poor quality of water then long periods of severe drought that have affected recent decades and whose ecological consequences are considerable, as evidenced by the decline in the area irrigated under the action of desertification and rising saline soils [1].
The region has, moreover, a desertification process which manifests itself in the form of silt, vegetation degradation, soil salinization, groundwater depletion and water and wind erosion. Environmental challenges imposed by recurrent drought and population pressure, it is necessary to monitor the natural resources available for their rational and sustainable management. In this context, remote sensing is a powerful tool for acquiring information necessary for the monitoring and management of natural resources, large temporal and spatial scale. Hence there are needs to monitor and understand the dynamics of land units, and to assist in decision making for the sustainable management of these resources.
The overall objective referred in this study is to know and map the evolution of the land use in the Errachidia region. A diachronic analysis combining the Digital Elevation Model (DEM) and satellite images are used for the production of cartographic materials useful for the study of spatial dynamics.
The specific objectives can be summarized as follows:
• Mapping the state of natural resources for the reference years: 1972, 1987, 2001, 2006 and 2011. The choice of these years is guided by the availability of satellite images and the avoidance of any too close follow.
• The diachronic study of the dynamics of land use in the analysis of maps produced.
• Analysis of changes to produce elements for decisionmaking.
The study area, which is part of the Tafilalet area, is located in the south-east region of Morocco and covers an area of 77,500 km2. This vast territory encompasses four major watersheds: the Ziz, the Guir the Maider the Rheris basin and oriented in the north-south direction. These basins are all limited to the north by the High Atlas. In the South, they are open to the Sahara (Figure 1). Occupying an intermediate position between the watershed Guir to the east and the west of Rheris, the watershed of Ziz, more important than the other three, extends from the High Atlas Mountains, at an altitude greater than 1500 m, to the plain of Tafilalet whose altitude is less than 1000 m [2].
The Middle Ziz that relates to the present study is located between 4˚50'W and 4˚20'W, 31˚60'N and 32˚00'N. It’s an area along the Ziz valley whose center is occupied by the palm of Kheng Medaghera, Aoufous and Erteb.
2. Geological Setting
Three morpho-structural units form the landscape of the region from north to south: Upper basin that corresponds to the High Atlas, the middle basin or furrow pre-African (Errachidia basin Cretaceous), which includes the study area, and the little Atlas [3].
Errachidia basin in the center, generally designated by the cretaceous basin consists mainly of horizontal layers of Cretaceous limestones [4]. This basin forms an asymmetrical synclinorium, consists of carbonate deposits of
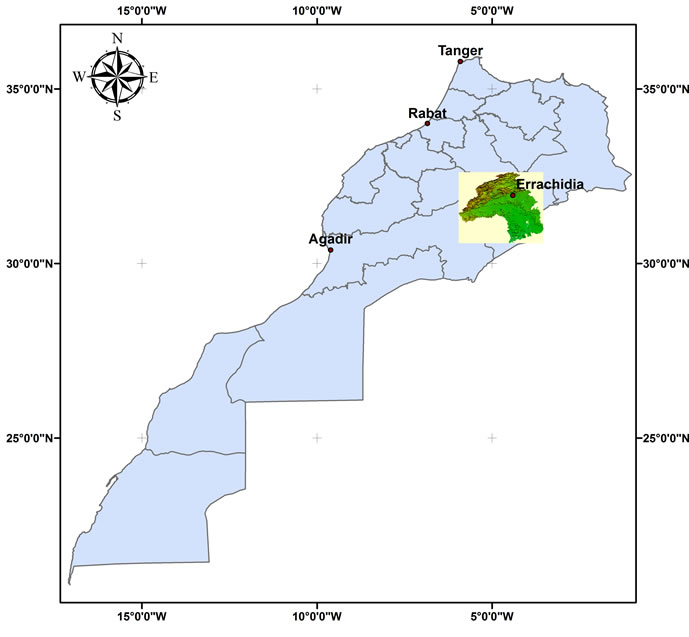
Figure 1. Location of the study area (Middle Ziz) in Moroccan scale.
the Turonian, sandstone sand intercalated with gypsum of the Infra-Cenomanian and sand and clay with evaporite deposits of gypsiferous formations of the Senonian ([3] and [5]).
3. Climate Framework
Errachidia region—Tafilalet is marked by varying altitudes from 1200 to 800 m which decrease from north to south. It is characterized by large variations in temperature and seasonal rainfall distribution are scarce and very irregular, from 270 mm on the reliefs of the High Atlas to 130 mm in the area of Errachidia dropped to less than 70 mm level plain Tafilalet (Figure 2).
The Nicholson index or rainfall index:
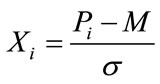
with:
Xi: Nicholson Index;
Pi: Total Rainfall (i mm a year)
M: is the average height of the annual rainfall series of years used;
σ: Standard deviation of rainfall annual series of years.
To be representative, Nicholson index (Figure 3) requires data on at least 30 years after the World Meteorological Organization.
The rainfall regime is dependent on orographic disturbances responsible if the stormy summer and ocean disturbances cause rainy winter and spring. The dry period often lasts up to eight months with temperatures obtained during the months of June, July, and August. The relatively wet winter and very cold with minimum temperatures in December and January.
The ombrothermic diagram (Figure 4) shows that during the dry season occupies the entire year because we always (P ≤ 2 × T).
4. Materials and Methods
The different materials used in this study are:
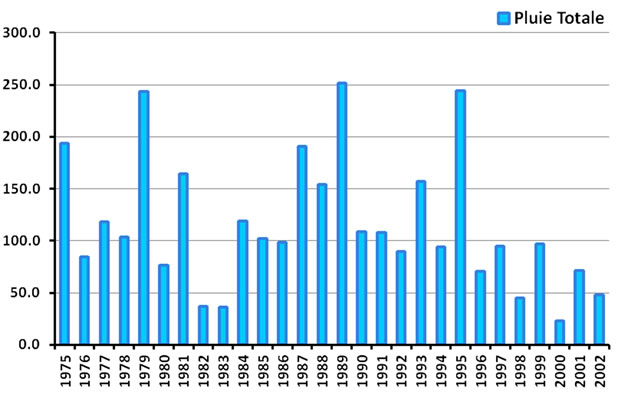
Figure 2. Annual total precipitation (mm) of Hassan Addakhil Dam station during water years 1975-2002.
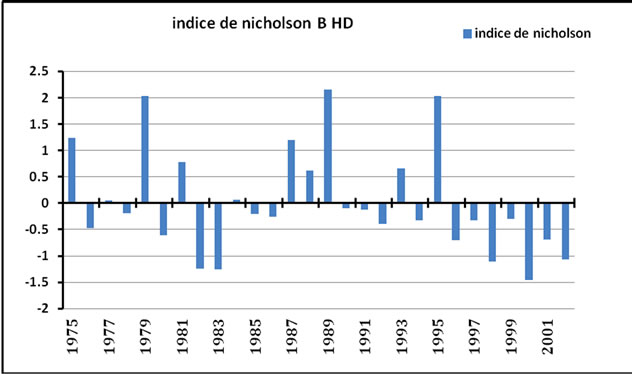
Figure 3. Index Nicholson of Hassan Addakhil Dam station during water years 1975-2002.
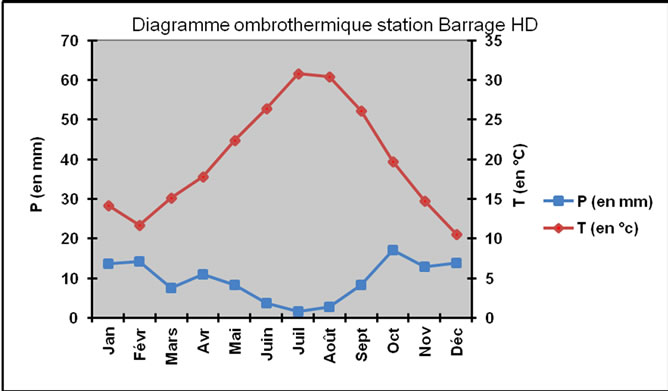
Figure 4. Ombrothermic Diagram at the Hassan Addakhil Dam station during hydrologic years 1975-2003.
Five multitemporal Landsat and multispectral images (Table 1): MSS (1972), TM (1987), ETM + (2001, 2006 and 2011);
• Google Maps Satellite Image 2011
• Topographic map of ORMVAT 1/100,000;
• Topographic Map Sheet Errachidia 1/50,000;
• Topographic Map Sheet Aoufous 1/50,000;
• Topographic Map Sheet Tiydrine 1/50,000;
• MNT Ziz;
• Master Plan Urban Ziz (SDAU 2007).
The software image processing and GIS such as:
In this methodology, it’s necessary to calculate indices that measure chlorophyll activity. Among these indices are cited NDVI, SAVI and MSAVI.
Evaluation of chlorophyll activity by calculating NDVI:
4.1. The Normalized Difference Vegetation Index (NDVI)
NDVI is a good indicator of the density of the vegetation ([6,7]). It is an index derived from a satellite image and adapted to the study of vegetation cover. This index uses the behavior of chlorophyll to highlight vegetation because the latter absorbs the maximum in the red and reflects heavily in the near infrared. It is calculated on the basis of the spectral characteristics of the vegetation.
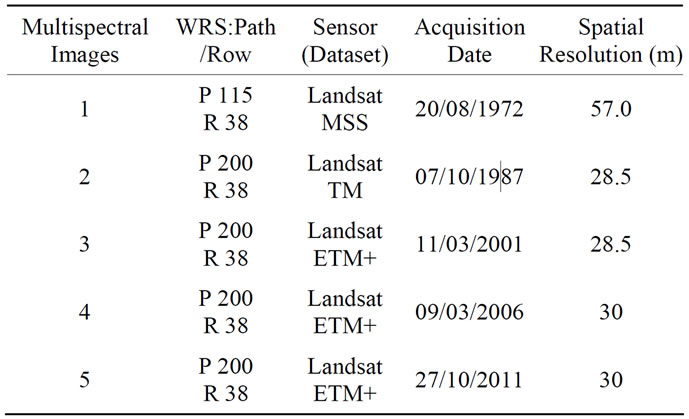
Table 1. Summary of satellite images used.
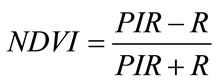
with:
PIR: reflectance in the Near Infra Red R: reflectance in the Red.
NDVI can express the force of the status of the vegetation at the time of observation. It also allows you to check the dynamics of land use in relation to density of vegetation cover.
4.2. The SAVI (Soil Adjusted Vegetation Index)
The SAVI is a hybrid index between NDVI and PVI [8]. In this vegetation index adjusted for soil (SAVI), the soil adjustment factor “L” is added.
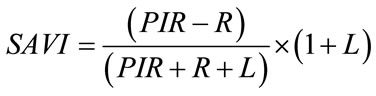
with:
PIR: average reflectance in the near infrared channel R: average reflectance in the red channel L: constant to reduce the effect of the soil.
“L” is a correction factor. Its value depends on vegetation cover.
For a maximum vegetation cover, “L” is equal to 0, and the SAVI is then equivalent to NDVI.
For a vegetation cover very low, “L” is equal to 1. [7] suggested that the value of 0.5 is used when the vegetation type was unknown. the value 0.5 represents an average vegetation cover.
4.3. The MSAVI (Modified Soil Adjusted Vegetation Index)
For the MSAVI, the adjustment factor “L” is not a constant but rather a function that varies inversely with the presence of vegetation in order to minimize the effect of nude soil on the SAVI index.
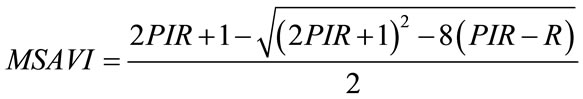
with:
PIR: average reflectance in the near infrared channel R: average reflectance in the red channel L: constant to reduce the effect of the soil.
This index is more efficient than the SAVI in some cases.
5. Results and Discussion
5.1. Combination of Bands 4-5-3 (R-G-B)
The colored compositions are used to produce color images, taking into account the spectral signature of the objects. They are often used to highlight the different types of surface multispectral images or highlight certain environmental phenomena such as forest fires, sandstorms, etc.
The color composition is the most widely used composition 453. It includes three spectral bands sensitive to vegetation, which makes the image contrast and rich in information.
Figure 5 shows the band 4 (NIR) in the red channel, band 5 (MIR) in the green channel, and band 3 (red) in the blue channel. This figure is an extract image at the city of Errachidia.
It is quite easy to identify a number of elements in this
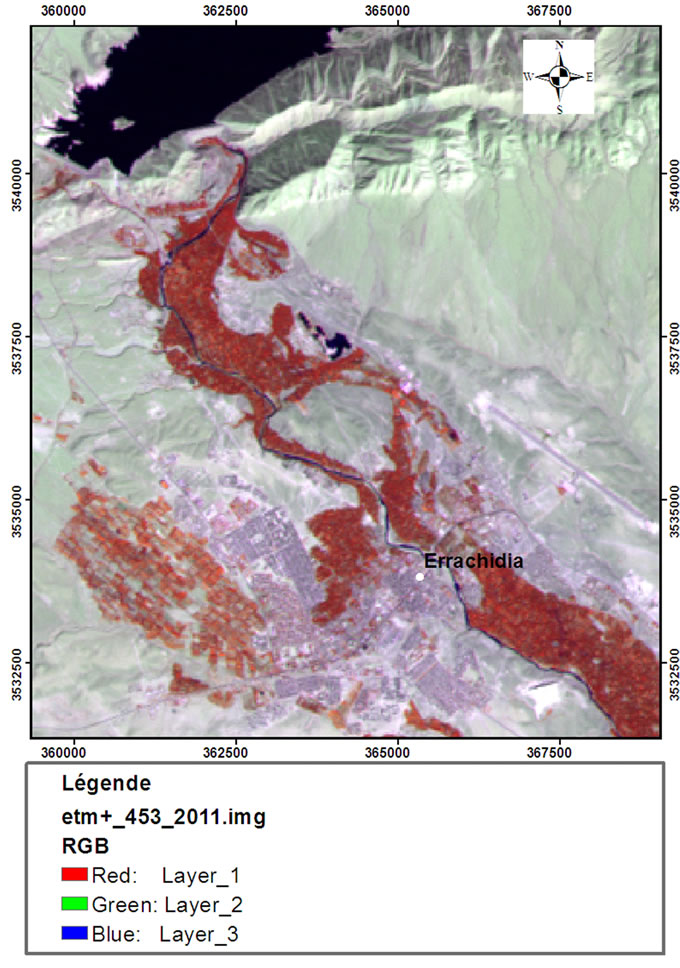
Figure 5. Image ETM+ (year 2011) in false colors (453).
image:
• The Vegetation: it appears a shade of red for this class. They consist mainly of palm trees and appear dark red.
• The bare soil, and urban area: mainly identifiable by a mixture of gray, light blue.
• The Water: in the studied area, the dam appears black.
5.2. False Color Combination NDVI-5-2 (R-G-B)
The study was conducted, this time from a color composite NDVI-5-2. This composition reveals a lot of information (Figure 6).
During the analysis of this image, the goal was to find the combination of bands for the discrimination of vegetation in the urban environment.
The general interpretation of the image is the following: the vegetation is red, the water is black and the habitat is generally dark blue.
5.3. Indices and New Channel
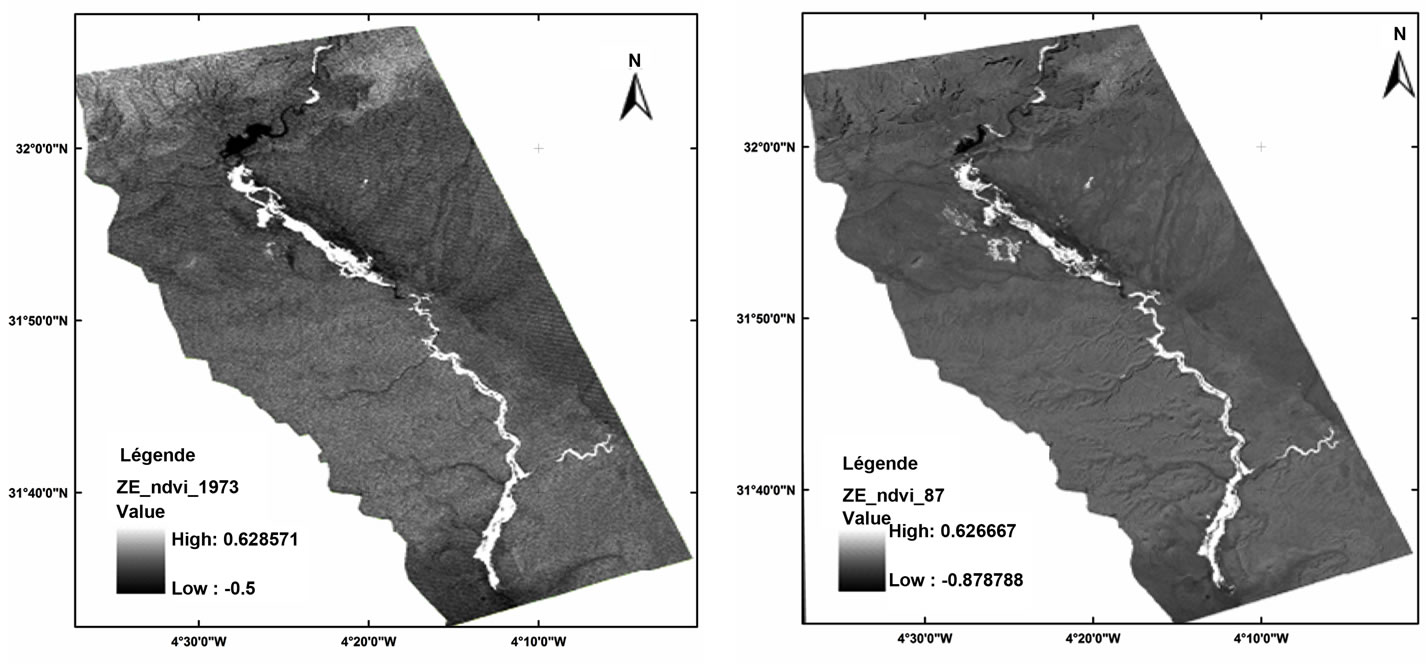
The vegetation index (NDVI) is correlated with chlorophyll activity sheets. In fact, chlorophyll pigments absorb strongly in the red and leaves by reflecting against strongly in the near infrared. The NDVI is used for the detection of active vegetation. Therefore, the NDVI gives [1] easily information on the vegetation in the spring when natural species are developing.
These maps (Figure 6) show the spatio-temporal evolution of vegetation cover from 1972 to 2011. From these cards, especially from average NDVI values, we were able to calculate the vegetation area percentage in the study area (Table 2).
The evaluation of chlorophyll activity was obtained by calculating the average NDVI of each scene and validated by SAVI and MSAVI indices.
The Inter-annual variation in NDVI average (Figure 7) is strongly linked to climatic conditions (rainfall) (2001 driest year and 2011 wettest year).
Quantitative analysis: Change detection and dynamic evolution of land use using vegetation index is done by
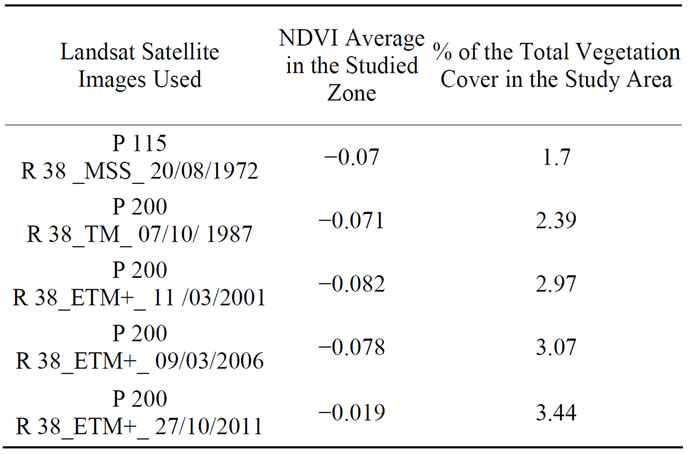
Table 2. Changes in land use between 1972 and 2011.
 1972,1987
 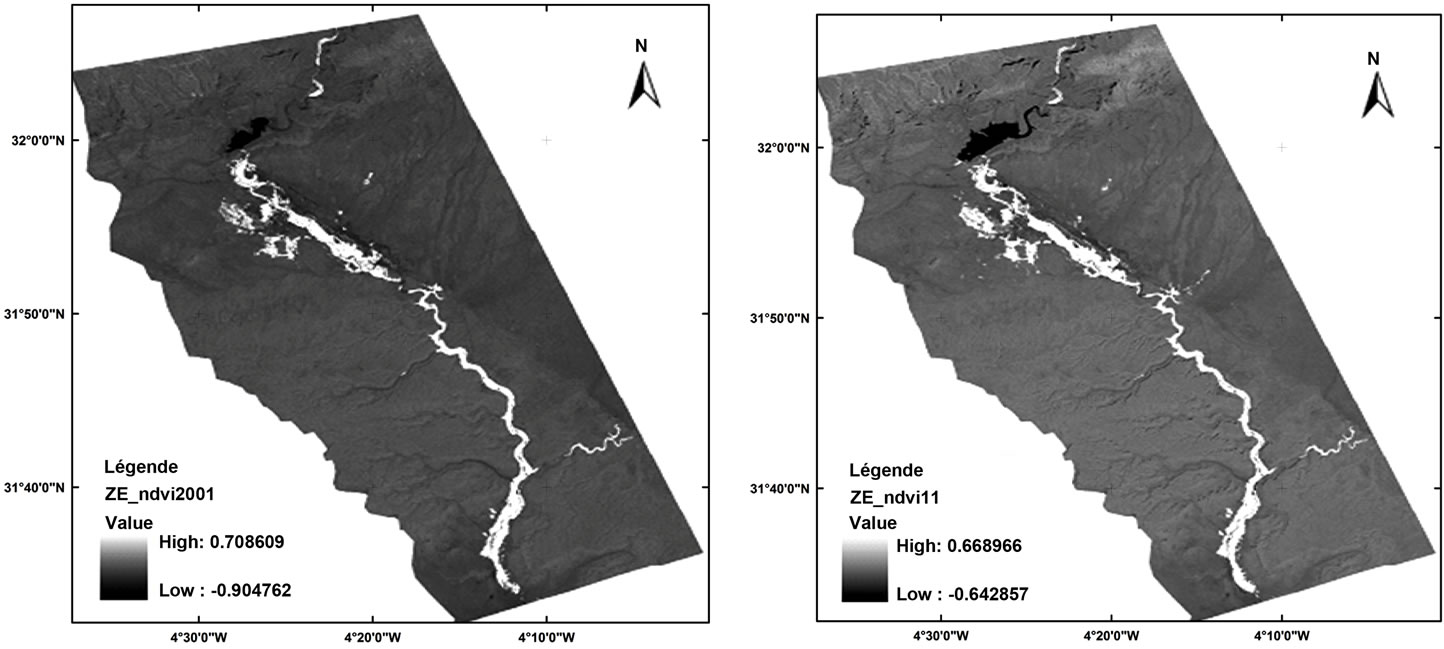 2001,2011
Figure 6. Calculating the vegetation index NDVI for different years (from 1971 to 2011).
comparison of multitemporal NDVI Calculated for each pixel between several scenes shot in different dates.
Areas colored in red (Figure 8) correspond to degraded areas (Decrease the size of the palm between 1985 and 2011).
6. Conclusions
Remote sensing, combined with Geographic Information Systems (GIS), today brings a decisive contribution to the various issues that arise in the general environment and the impact of desertification in arid zones in the Sahara particular.
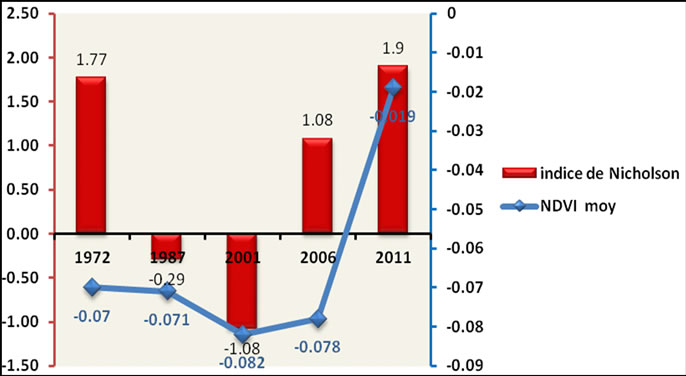
Figure 7. Evolution of average NDVI and Nicholson index in the study area.
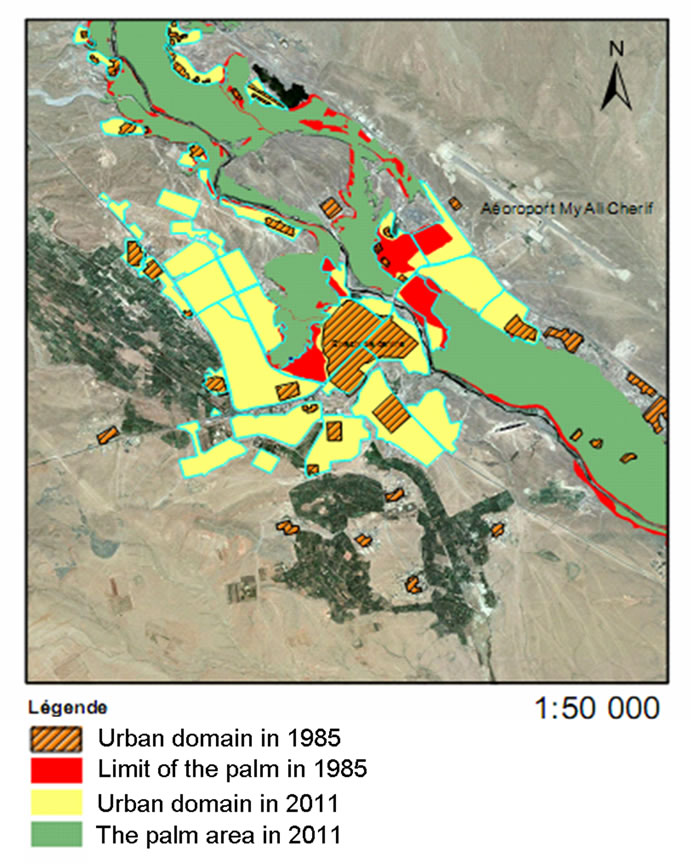
Figure 8. Urban extension at the expense of the palm in urban areas around the city of Errachidia.
This study showed the undeniable contribution of GIS and remote sensing for monitoring spatio-temporal covert plant oasis in an area very sensitive to the effects of climate change.
The evaluation of chlorophyll activity was obtained by calculating the average NDVI of each scene (from 1972 to 2011) and validated by SAVI and MSAVI indices. In addition, we were able to calculate the vegetation area percentage in the study area.
REFERENCES
- M.YAHYAOUI, “Drought in the basin Guir Gheris and Ziz,” 1998, Rev. Water and Development, 3:5, Morocco.
- S. Bouhlassa and P. Samuel, “Reference Evapotranspiration in the Arid deTafilalet Southeast Morocco,” AJEEM RAGEE, Vol. 11, 2006, pp. 1-16.
- Y. Bouabdellaoui, “Application of Isotope Techniques Geochemical Models for the Characterization of Deep Aquifers in Arid and Semi-Arid Basin Case Errachidia,” Ph.D. Thesis, Mohamed V University, Rabat, 164p.
- J. Margat, “Hydrogeological Study of the Quaternary Basin Tafilalet,” Water Resources in Morocco, Tome 3, Editions of the Geological Survey of Morocco, Rabat, 1977, pp. 310-380.
- J. Chamayou and J. P. Ruahard, “Pre-Furrow East African Siroua: Ouarzazate and Errachidia-Boudnib Basins. Water Resources of Morocco,” Water Resources, T 3, 1977, pp. 224-242.
- F. Bonn and G. Rochon, “Accurate Remote Sensing, thematic Applications,” Quebec University, Quebec, 1996, 633p.
- A. R. Huete, “A Soil Adjusted Vegetation Index (SAVI),” Remote Sensing of Environment, Vol. 25, No. 3, 1988, pp. 295-309. doi:10.1016/0034-4257(88)90106-X
- G. Guyot, “Spectral Characterization of Plant Canopies in the Visible and near Infra Red Remote Sensing Application,” Bulletin of the French Society for Photogrammetry and Remote Sensing, No. 95, 1984, pp. 5-14.