International Journal of Geosciences
Vol. 3 No. 4A (2012) , Article ID: 23217 , 12 pages DOI:10.4236/ijg.2012.324083
Exploring Trends in Microcrack Properties of Sedimentary Rocks: An Audit of Dry and Water Saturated Sandstone Core Velocity-Stress Measurements*
1CiPEG, University of Leeds, Leeds, UK
2Department Earth Sciences, University of Bristol, Bristol, UK
Email: d.angus@leeds.ac.uk
Received July 20, 2012; revised August 23, 2012; accepted September 3, 2012
Keywords: Compliance Ratio; Microcrack Properties; Saturated; Stress Dependent Velocities; Ultrasonic
ABSTRACT
Stress dependent rock physics models are being used more routinely to link mechanical deformation and stress perturbations to changes in seismic velocities and seismic anisotropy. In this paper, we invert for the effective non-linear microstructural parameters of 69 dry and saturated sandstone core samples. We evaluate the results in terms of the model input parameters of two non-linear rock physics models: A discrete and an analytic microstructural stress-dependent formulation. The results for the analytic model suggest that the global trend of the initial crack density is lower and initial aspect ratio is larger for the saturated samples compared to the corresponding dry samples. The initial aspect ratios for both the dry and saturated samples are tightly clustered between 0.0002 and 0.001, whereas the initial crack densities show more scatter. The results for the discrete model show higher crack densities for the saturated samples when compared to the corresponding dry samples. With increasing confining stress the crack densities decreases to almost identical values for both the dry and saturated samples. A key result of this paper is that there appears to be a stress dependence of the compliance ratio  within many of the samples, possibly related to changing microcrack geometry with increasing confining stress. Furthermore, although the compliance ratio
  for dry samples shows a diffuse distribution between 0.4 and 2.0, for saturated samples the distribution is very tightly clustered around 0.5. As confining stresses increase the compliance ratio distributions for the dry and saturated samples become more diffuse but still noticeably different. This result is significant because it reaffirms previous observations that the compliance ratio can be used as an indicator of fluid content within cracks and fractures. From a practical perspective, an overarching purpose of this paper is to investigate the range of input parameters of the microstructural models under both dry and saturated conditions to improve prediction of stress dependent seismic velocity and anisotropy observed in time-lapse seismic data due to hydro-mechanical effects related to fluid production and injection.
1. Introduction
Non-linear or stress dependent rock physics models are being applied increasingly to model the influence of stress perturbations due to reservoir production and injection activities on seismic velocities. Laboratory measurement of non-linear rock physical properties of dry core samples can provide valuable information on the stress dependent elastic properties of reservoir rocks [1- 3] and have the potential for up scaling to seismic frequencies [4] as well as relating to static elasticity [5]. More importantly, core measurements can also be used to calibrate rock physics models [6] for the forward prediction of the stress dependence of seismic velocities. Reservoir rocks are seldom under dry conditions and so more realistic characterization of the non-linear rock physical properties should be examined under fluid saturated conditions. However, the number of published studies on saturated core samples are fewer than those on dry samples and this is primarily due to the difficulty of carrying out fluid saturated stress measurements of core samples (e.g., enormous equilibration times are necessary when performing saturated core measurements in comparison with dry sample measurements).
In this paper, we compare the microcrack parameters of the discrete and analytic microstructural stress-dependent model described in [3] for dry and water saturated core. The data used in this study come from the sandstone ultrasonic velocity-stress measurements of [7] and so allow a direct comparison between dry and water saturated microcrack parameters. This work follows from [6] who explore the microcrack properties of over 150 dry-core ultrasonic velocity-stress measurements. Given the influence of fluids within microcracks (and capillary forces) has important implications on the stress sensitivity of reservoir rocks [8], it is necessary to study the effect of fluid saturation on non-linear rock physics model parameters. Thus, the main objective is the paper is to study the influence of fluid saturation fluid on microcrack properties to further calibrate the microstructural non-linear rock physics models discussed in [6].
2. Rock Physics Model
We examine the microcrack properties of two non-linear rock physics models: A discrete microcrack model defined by a secondand a fourth-rank crack density tensor [1-3] and an analytic microcrack model defined by an initial crack density and initial aspect ratio [3,9]. Although the discrete model describes the non-linear dependence of velocity with stress, the input parameters are two tensor quantities that are not necessarily intuitive. The analytic formulation provides a model based on physically intuitive input parameters to forward model the non-linear stress dependence of velocity, yet requires assuming that the microcracks are penny-shaped (i.e., the scalar crack approximation). Although penny-shaped cracks offer intuitive parameterization of the pore space and a reduction in the model complexity, the scalar crack approximation is not totally consistent with ultrasonic core data [6,10]. However, it should be noted that the analytic formulation still captures some of the essential stress dependent behaviour of sedimentary rocks and has utility for forward modelling applications.
It should be noted that the non-linear formulation we examine in this paper is one of many approaches to model the influence of stress on seismic velocity. For instance, [11] present a 1D empirical formulation to describe vertical travel time perturbation due to changes in vertical strain and vertical velocity from 4D seismic data. Authors [12-14] use third-order elasticity theory to characterize 3D stress dependence elasticity and anisotropy. Authors [15-17] introduce nonlinear models consistent with empirically derived phenomenological equations [18]. Our interest in the discrete and analytic models described earlier (and in more detail below) is based on seeking formulations described using few and intuitive effective microstructural model parameters that can be calibrated with available data (e.g., ultrasonic core data).
2.1. Discrete Microcrack Model
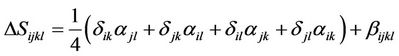
Reference [19] adopt the excess compliance approach of [20] to model the influence of stress dependent elasticity due to the deformation of microcracks. The stress dependence and elastic anisotropy is given in terms of an excess compliance ΔS (the inverse of the 3 × 3 × 3 × 3 elasticity tensor C)
 (1)
(1)
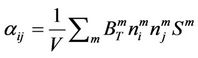
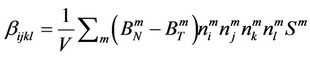
[19,20] where δij is the Kronecker delta and summation convention is being used. The secondand fourth-rank crack density tensors αij and βijkl are defined
 (2)
(2)
and
 (3)
(3)
where V is volume and n is the unit normal to the displacement discontinuity set m (i.e., microcrack or grain boundary).  and
and  are the normal and tangential compliances across the microcrack set m having surface area Sm. The effective compliance S of a rock can be expressed
 (4)
(4)
where S0 is the background (or intact) rock compliance estimated from either mineral composition [21] or high confining stress behaviour [22]. In this paper, we use the high stress approach because we have found using mineral composition does not yield consistent and reliable velocity predictions compare with observation.
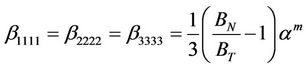
The key assumptions for this model are that the microcracks are rotationally invariant and thin. Since ultrasonic measurements are only performed in one direction, we assume the samples are isotropic [22]. Thus, the fourth-rank crack density term can be simplified (i.e., βijkl is isotropic)
 (5)
(5)
and
 (6)
(6)
where
 and
and  (7)
(7)
[22]. The scalar N is the number of discontinuities in V, and r is the radius of the crack.
2.2. Analytic Microcrack Model
To enable forward modelling of 4D seismic effects related to perturbations in stresses [23-25], [3] extended the analytic effective medium formulation of [9] to predict ultrasonic anisotropic and stress-dependent velocities. Specifically, the analytic microcrack model introduces initial microcrack aspect ratio and number crack density to predict stress dependence and crack-induced elastic anisotropy. The number crack density is written
 (8)
(8)
where
 (9)
(9)
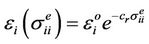
 and
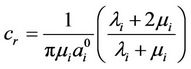
and  are the effective initial number crack density and effective initial aspect ratio, λi and μi are the Lame constants, and
  is the principal effective stress in the i-th direction. The second-rank microcrack density term is
 where
where  (10 )
(10 )
is a normalization factor [26], and  and
and  are the anisotropic intact rock Young’s modulus and Poisson ratio. This derivation yields an expression for the effective elasticity that can model stress-induced elastic anisotropy due to deviatoric stress fields. The key assumptions for this model are that the microcracks are pennyshaped and that the rock does not undergo brittle or plastic deformation.
2.3. Microcrack Properties of Dry Core
Reference [6] compiled a database of over 150 dry-core velocity-stress measurements to explore microcrack properties of the discrete and analytic non-linear rock physic models. Their results indicate that for most lithologies the initial aspect ratio are approximately 0.0005, but can be larger for shales. The initial crack density is sensitive to core damage and consolidation. Most notably, [6] note that the global trend of the compliance ratio  is not necessarily unity and, for the samples analyzed, is approximately 0.6. This has important implications because, for most sedimentary rocks, the fourth-rank term βijkl is often neglected to enable characterization of the nonlinear stress dependent elasticity based solely from contribution of the second-rank term αij [2,3,27]. Deviations from the scalar crack assumption (i.e., where βijkl is small such that
  = 1) potentially result from several factors, namely presence of fluids with nonzero bulk modulus, clay within cracks, cementation, and complex crack geometries. In this paper, we know the saturating fluid as well as an estimate of the clay content of the rock specimens (see discussion below), but lack quantitative measures of cementation or microcrack geometry.
In [3,6], the analytic model parameter inversion involved implementing a simple grid search over model parameters to minimize the misfit between model predictions and observed ultrasonic data. However, such a simple grid search may not be an efficient method for determining the best-fitting model parameters. For the discrete model parameter inversion in [3,6], a Newton-Ralphson approach was used to minimize the misfit between the model predictions and observations based on derivatives of the elasticity tensor components with respect to model parameters (see Figure 1 in [6], for general workflow). A known limitation of the Newton-Ralphson method is that for nonlinear inversion problems it is often difficult to
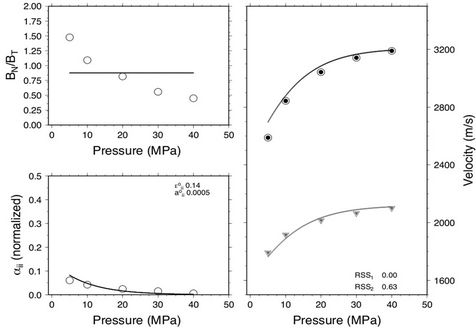
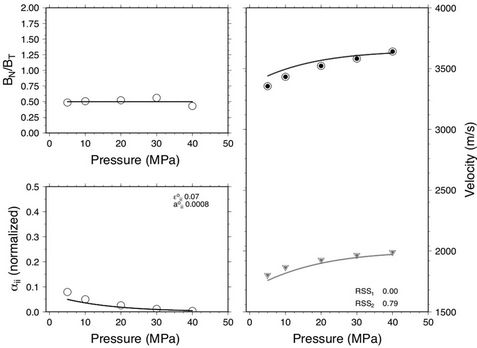
Figure 1. Microcrack properties for sandstone sample 10381: Dry (top) and saturated (bottom) sample. In this figure and Figures 2 and 3, the right panel compares the ultrasonic data (Vp is open black circle and Vs is open gray triangle), the crack density inversion results (Vp is solid black circle and Vs is solid gray circle), and the analytical microcrack prediction based on the best fitting initial crack density and initial aspect ratio (Vp is black solid curve and Vs is gray solid curve). The top-left panel shows the BN/BT ratio of the inverted crack densities (open circles) and the mean BN/BT ratio (solid line). The bottom-left panel compares the best fitting crack densities from the crack density inversion (open circles) and the best fitting crack densities from the analytic microcrack prediction (solid curve).
find the true global minimum and so solutions may be biased towards local minima if the initial starting model is not chosen carefully. In this paper, we use the neighbourhood algorithm of [28] to improve the model parameter inversions for both the analytic and discrete formulations. The results of the inversion for the discrete model are exceptional (e.g., see Figures 1-3, where solid symbols represent discrete model predictions and open symbols the ultrasonic data). For the most part, the inversion results for the analytic model are poorer when compared to the discrete model. However, the analytic model predicts the general trend of the stress dependence remarkably well considering it only considers the influence of second-rank crack density tensor (e.g., the solid curves in Figures 1-3).
3. Data
Reference [7] investigated 69 sandstone core samples to examine the influence of fluid saturation on ultrasonic velocities. The measured porosity ranged between 5% and 30%, and the measured clay content ranged between 0% and 50%. The core samples ranged in length between 2 cm and 5 cm, and had diameter of 5.0 cm. It was noted that the dimensions of the core were approximately two orders of magnitude larger than the average grain size.
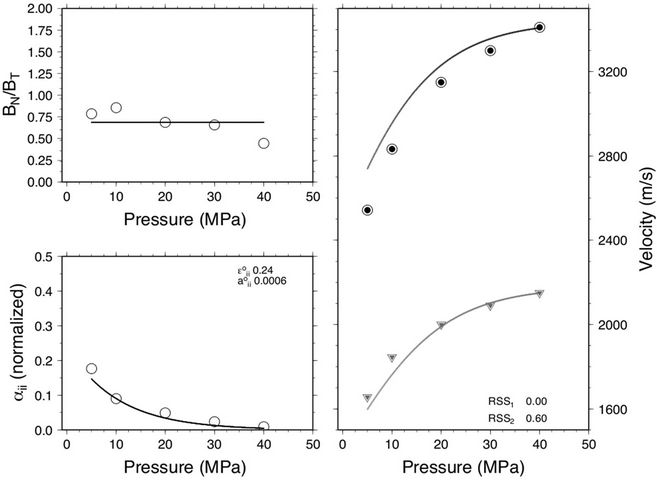
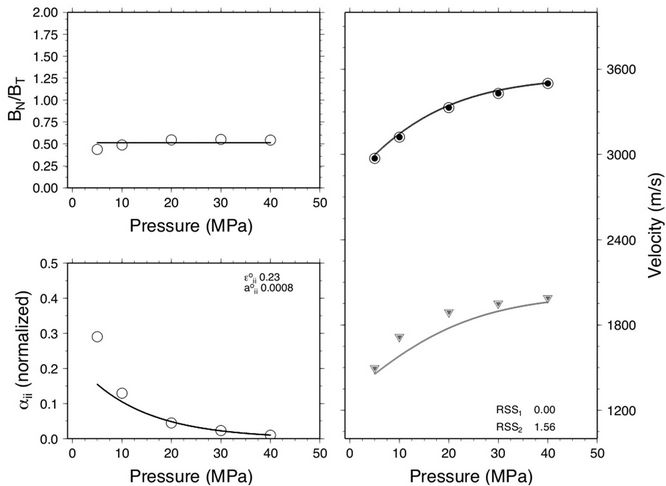
Figure 2. Microcrack properties for sandstone sample 12677: Dry (top) and saturated (bottom) sample.
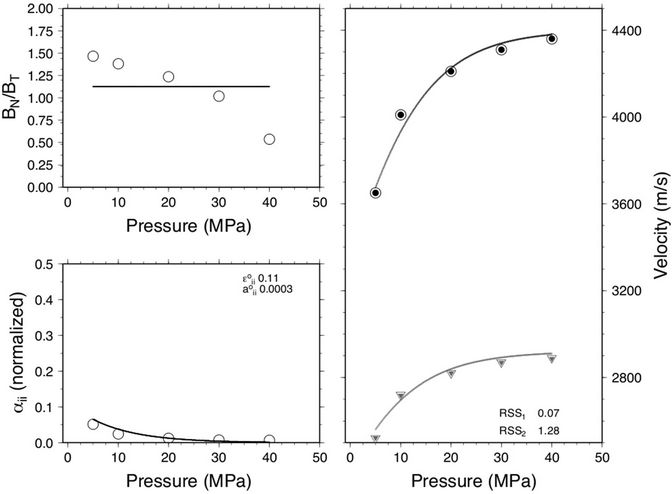
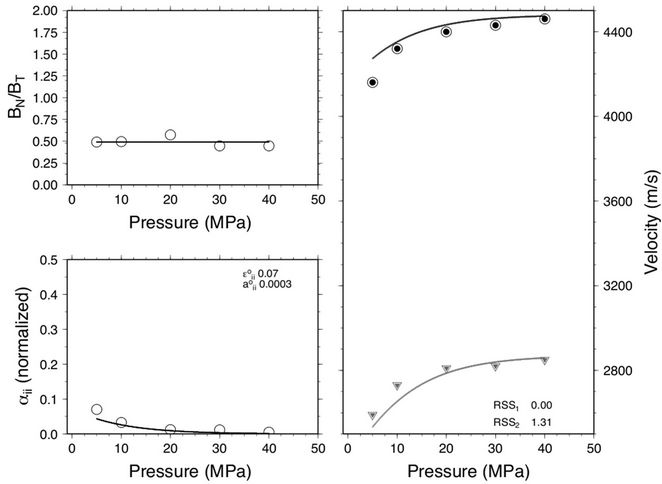
Figure 3. Microcrack properties for sandstone sample Fountian B: Dry (top) and saturated (bottom) sample.
The Pand S-wave velocities were measured with the pulse transmission technique based on picking the first arrival peak amplitude. The confining and pore pressure were controlled separately, where the differential pressure limited to 50 MPa and the pore pressure to 1 MPa. The ultrasonic frequency of the Pand S-wave transducers were 1.0 MHz and 0.6 MHz, respectively. Based on the measured velocities, the average dominant wavelengths of the P and S waves were at least five times the mean grain size of the samples. Under dry conditions, the P-wave arrival times were picked to within 0.003 μsec (which equates to ≤1% error in velocity). The S-wave velocity errors were estimated to be less than 2%, except for the poorly consolidated samples at low confining stresses where the velocity errors were up to 3%. The samples were preloaded to 50 MPa and the velocities were measured on the unloading path to reduce the effects of hysteresis. Although hysteresis was observed the magnitude was small (i.e., ≤1%). For water-saturated conditions, the samples were fully saturated with water. However, for the samples having high clay content, the saturating fluid used was brine to minimize chemical alteration effects. [No velocity differences were observed between the water and brine saturation samples.] Velocities were measure during loading and unloading with only minor hysteresis being observed (≤1% for well consolidated samples and ≤2% for poorly consolidated samples).
4. Results
Figures 1-3 show the results of the inversion for three of the sandstone samples. Figure 1 is a sandstone sample with high clay content (46.0%) and low porosity (13.8%). The fit between observation and the discrete and analytic predictions are very good. The dry measurements have a characteristically higher stress dependence compared to the saturated measurements. The  ratio for the dry measurements show a stress dependence, decreasing from 1.5 to 0.5 with increasing stress, whereas the ratio for saturated measurements is approximately constant at 0.5. Estimates of initial crack density e0 is smaller whereas the initial aspect ratio a0 is greater for the saturated measurement compared to the dry measurement. Figure 2 is a sandstone sample with low clay content 7.0% and high porosity 27.05%. This sample shows similar stress dependent velocity characteristics to the sample shown in Figure 1. However, the
  ratio for the dry measurements is approximately constant around 0.75 and there is minimal change in the predicted initial crack density and initial aspect ratio between the dry and saturated measurements. Figure 3 is a sandstone sample with no clay (0.0%) and moderate porosity (19.8%). This sample displays the same velocity stress dependence (i.e., higher stress dependence for the dry measurement). The
  ratio is also stress dependent, but displaying a concave upward trend with increasing stress compared to the concave downward trend in Figure 1. Although the initial crack density is lower for the saturated sample, there is no change in the initial aspect ratio. [Note, the model parameters are assumed to be isotropic only because the data contain only one Pand one S-wave measurement for each dry and saturated sample. However, the formulation does consider anisotropy in the model parameters if there is sufficient ultrasonic data.]
4.1. Analytic Model Parameters
Figure 4 displays e0 versus a0 estimates for the analytic model for both the dry and saturated measurements. Also shown (inset) are histograms for e0 and a0. For the dry and saturated measurements, the initial aspect ratios show similar clustering centred around 0.0005 and is consistent with that observed by [6] and references within). The initial crack density e0 show more scatter, with values between 0.0 and 0.4 for the dry measurements and 0.0 and 0.25 for the saturated measurements. In Figure 5, initial crack density is plotted with respect to clay content and porosity, and shows no clear relationship
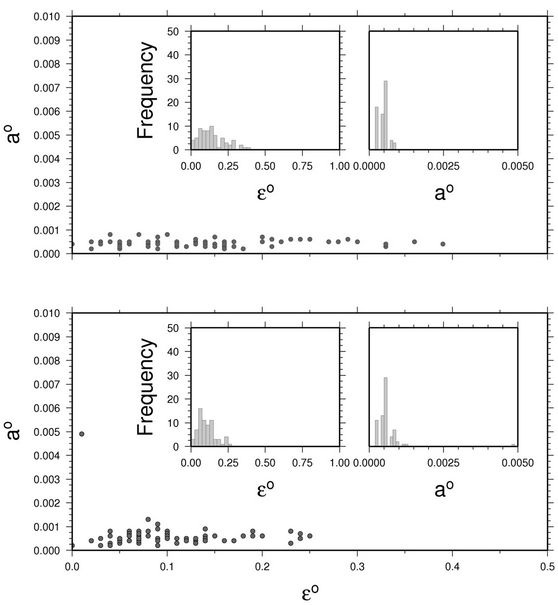
Figure 4. Comparison of e0 versus a0 for dry (top) and saturated (bottom) samples. Inset: histograms for e0 and a0.
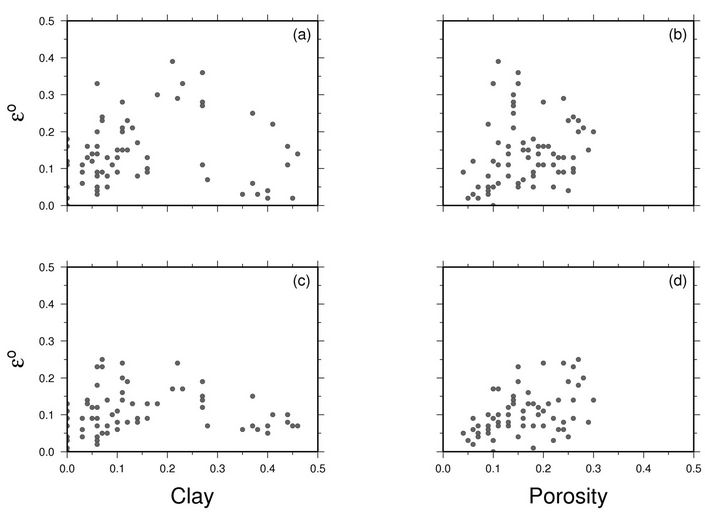
Figure 5. Comparison of e0 versus clay (left column) and porosity (right column) for dry (top) and saturated (bottom) samples.
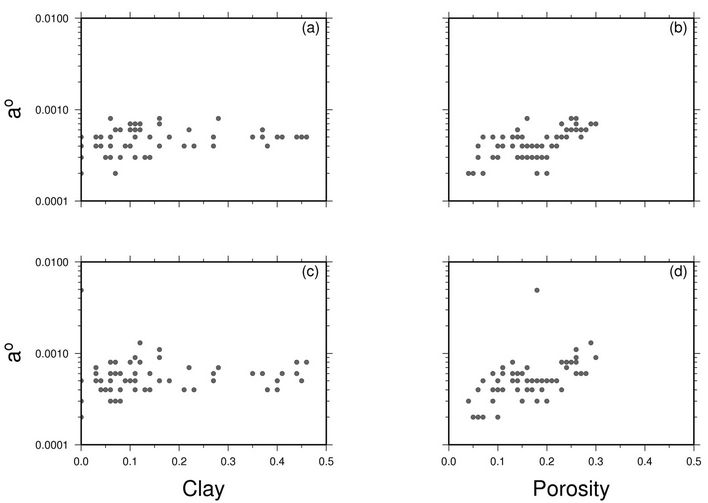
Figure 6. Comparison of a0 versus clay (left column) and porosity (right column) for dry (top) and saturated (bottom) samples.
between clay and porosity. This is consistent with the idea that crack density is more sensitive to core damage, degree of cementation, grain boundary geometry and grain size. Although clay content (and porosity) can influence cementation, pore geometry and core damage, the relationship is complex and is not straight forward. Results from other studies suggest e0 correlates better with grain size rather than clay or porosity. Figure 6 shows initial aspect ratio with respect to clay content and porosity, where a very weak trend of increasing aspect ratio with increasing porosity. Given that the aspect ratio describes the average shape (shape distribution) of the stress sensitive microcracks and grain boundaries, it is expected that the aspect ratio will be influenced not only by the fluid microcrack infill but also by the solid (e.g., clay) micorcrack infill.
4.2. Discrete Model Parameters
Figures 7 and 8 display histograms for crack density and  ratio as a function of confining stress. In Figure 7, both the dry and saturated measurements are characterized by a decrease in crack density with increasing confining stress, with a slight bias of higher crack densities for the saturated measurements. The observation that crack density is higher in saturated samples suggests that fluids within the microcracks and grain boundaries serve to support the compliant pore space. Figure 8 highlights the main difference between the dry and saturated samples. The
  ratios for the dry samples show a diffuse distribution between 0.4 and 2.0 for all confining stresses (the character of the distribution changes with confining stress and this likely represents the complex geometry of the microcracks and grain boundaries). However, for the saturated samples, the behaviour of the
  ratio is very different. At low confining stresses, the ratio is tightly clustered around 0.5 and slowly becomes more diffuse as the confining stress increases. Even at high confining stresses the ratio still clusters around 0.5. At the lowest stress levels, the BN/BT ratio is predomi-nantly 0.5. The interpretation for this phenomenon is that, at these lower stresses, the microcracks are open and hence contain sufficient enough volume of fluid that the compliance ratio is influenced predominantly by the normal compliance of the fluid. As the stress increases, the microcracks close reducing the volume of fluid within the microcracks and allowing the geometry of the microcracks to influence the BN/BT ratio to a greater extent. Clearly the presence of fluid has a strong effect in reducing the
  ratio since it offers resistance to microcrack and grain boundary closure in the normal direction due to the finite stiffness of the fluid bulk modulus. The influence of fluids on the BN/BT ratio have been predicted [29,30] as well as observed [31], and is generally attributed to the fact that fluids decrease the normal compliance (e.g., increase the microcrack normal stiffness). The influence of fluids on the tangential compliance has been observed experimentally [32] but it is often neglected, primarily because the mechanism is not well understood.
4.3. Summary
Figure 9 presents the results for the dry and saturated measurements: (a)-(b) compare the analytic model parameters and (c)-(d) compare the discrete model parameters. Figure 9(a) indicates that the initial crack density predictions for the dry rock are greater than the saturated rock and this relates to the observation that the dry samples are more stress sensitive than the saturated samples. For the initial aspect ratios in Figure 9(b), the saturated samples are observed to have microcracks with larger aspect ratios and suggests that the fluids within the
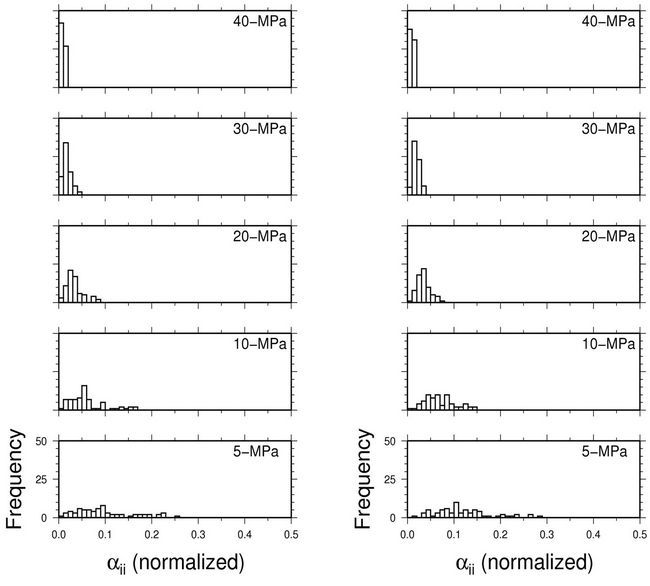
Figure 7. Histogram of crack density as a function of confining stress for dry (left column) and saturated (right column) samples.
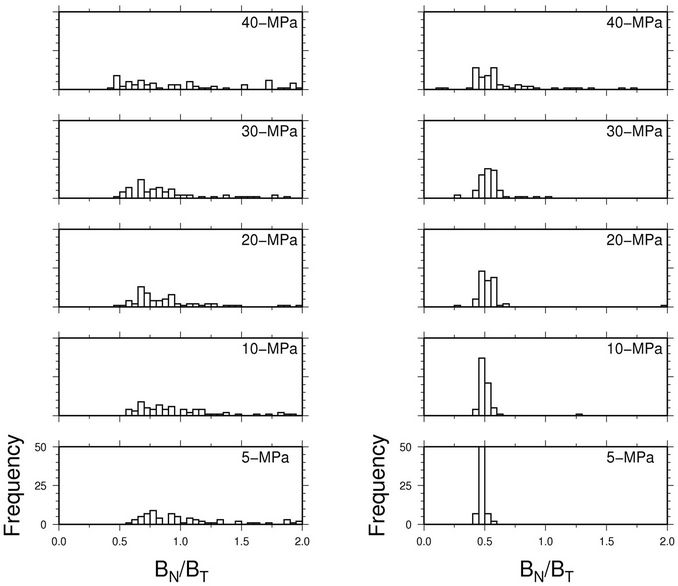
Figure 8. Histogram of BN/BT ratio as a function of confining stress for dry (left column) and saturated (right column) samples.
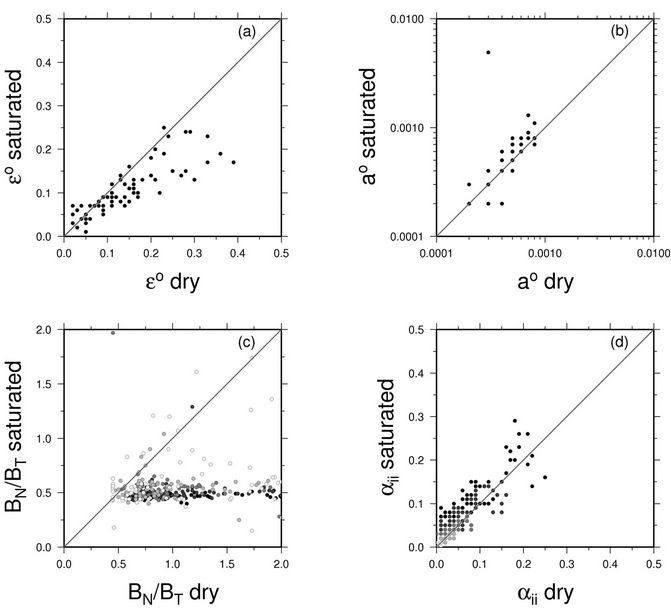
Figure 9. Comparison of dry and saturated microcrack properties: (a) Initial crack density; (b) Initial aspect ratio; (c) BN/BT ratio; and (d) Crack density. [Note: for (c) and (d) the black symbols represent the low stress measurements and for increasing confining stress the symbols become lighter.]
samples tend to support the compliant pores. Figure 9(c) compares estimates of the  for the dry and saturated samples for all confining stresses and shows remarkably consistent values (clustering around 0.5) for the saturated samples but a diffuse distribution for the dry measurements. Figure 9(d) compares the crack density estimates for all confining stresses and shows that at low confining stresses, the crack density of the saturated samples are larger than the dry samples. This is in stark contrast with the results of 9(a), where the initial crack density of the saturated samples are smaller than the dry samples. Although this might be considered totally inconsistent with the idea that the saturated samples are stiffer than the dry samples (i.e., higher crack density making the rock weaker through excess compliance), the stiffness of the saturated samples comes about through the
  ratio, where the normal compliance serves to strengthen the sample. Thus, there appears to be a relationship between the discrete model parameter
  and the analytic model parameter a0, both of which appear to characterize the stiffness of the compliant pore space. More research with various saturating fluids is needed to explore the relationship between
  and a0.
5. Discussion
5.1. Results
Reference [22] invert the data of [7] for the secondand fourth-rank crack density terms 2 - 3 as well as the BN/BT ratio using Equations (5)-(7). The inverted BN/BT ratios of [22] are consistent with our results, showing a diffuse distribution for the dry samples and a tighter distribution for the saturated samples at low confining stresses. This distribution is more diffuse at higher stresses; these stress levels are more typical of in situ reservoir rock conditions. However, there are some distinct differences. First, the inverted  ratios for the saturated samples of [22] cluster around 0.25, whereas our estimates cluster around 0.5. Second, [22] observe ratios up to 3.0 whereas ours do not exceed 2.0. Finally, it appears that we have many more BN/BT ratio estimates with respect to that of [22]. This is possibly due to the fact that [22] assume that BN/BT is stress independent and hence have only 138 (69 dry and 69 saturated) estimates compared to our 730 (365 dry and 365 saturated).
Reference [10] also analyse the results of [7] as well as the sonic and ultrasonic data of [33] to invert for the compliance ratio . Reference [10] use the non-linear model of [16] and estimate the compliance ratio after inverting for Poisson’s ratio. They observe that the compliance ratios show large scatter between 0 and 2 and conclude that the scalar crack (or spheroidal crack theory) is inconsistent with the data. However, [10] note large relative systematic errors in their estimates of the compliance ratio which results from error propagation in the method of computing
 . In our approach, error in estimating
  does not result from propagation of error from other model parameter estimates, but is entirely influenced by the velocity measurement errors (between 1% and 3%). However, it should be stressed that our estimate of
  is model dependent.
5.2. General Comment on Rock Physics Models
There is often criticism of rock physics models in terms of the model idealizations of the rock architecture. For example, how often are penny-shaped cracks are not observed in real rocks? However, it is important to realize that ultrasonic seismic signals are band-limited and the limited information seismic signals contain are traveltimes, amplitudes and phase. For transmission type experiments, such as ultrasonic measurements, the seismic wavefield experiences the averaging effects [34,35] of sub-wavelength scale features in the rock. Furthermore, most ultrasonic measurements typical consider observations based on a single-source and single-receiver setup. Hence these experiments tend to be biased towards the fastest ray path neglecting potentially important waveform effects diagnostic of rock heterogeneity on the scale and less than the ultrasonic wavelength. Thus, what the seismic wavefield “sees” is not at all comparable to what the human eye sees. All that is for certain is that rocks have an excess compliance (paraphrased from Mike Schoenberg). However, rock physics models allow us to construct “semi-intuitive” model idealizations that have some correlation to measurable parameters. In this paper, we have investigated two microstructural models by constraining the range of their input parameters for both dry and saturated cases. In doing so, we can apply the microstructural models based on laboratory core data to predict the stress dependence of seismic velocity (and anisotropy) for dynamic geomechanical effects on time-lapse seismic attributes.
Application of Equation (8) suggests that the model can only contain three sets of orthogonal cracks align with the principal stress. Cracks in rock have been observed to be rarely in random orientations and this is primarily the result of non-uniform temperature and/or non-hydrostatic stress conditions [36-38].
6. Conclusion
We have inverted for the non-linear microstructural parameters of 69 dry and saturated sandstone core samples and have evaluated the results in terms of the model input parameters of a discrete and analytic stress-dependent rock physic models. The results for the analytic model indicate that the global trend of initial crack density is lower and initial aspect ratio is larger for saturated samples compared to the equivalent dry samples. The initial aspect ratios for both the dry and saturated samples are tightly clustered between 0.0002 and 0.001, whereas the initial crack densities show more scatter. However, the overall trend is consistent with that found by Angus et al. (2009). The results for the discrete model indicate higher crack densities for the saturated samples compared to the dry samples, with crack density decreasing to almost identical values with increasing confining stress. A noticeable deviation is observed with the compliance ratio , showing diffuse distribution between 0.4 and 2.0 for dry samples and very tight clustering around 0.5 for saturated samples. As confining stresses increase the compliance ratio distributions for the dry and saturated samples become more diffuse but still noticeably different.
7. Acknowledgements
Professor De-Hua Han is thanked for providing access to the dry and saturated sandstone ultrasonic data from [7]. All figures were generated using GMT [39].
REFERENCES
- C. Sayers, “Stress-Dependent Elastic Anisotropy of Sandstones,” Geophysical Prospecting, Vol. 50, No. 1, 2002, pp. 85-95. doi:10.1046/j.1365-2478.2002.00289.x
- S. Hall, J.-M. Kendall, J. Maddock and Q. Fisher, “Crack Density Tensor Inversion for Analysis of Changes in Rock Frame Architecture,” Geophysical Journal International, Vol. 173, No. 2, 2008, pp. 577-592. doi:10.1111/j.1365-246X.2008.03748.x
- J. Verdon, D. Angus, J.-M. Kendall and S. Hall, “The Effects of Microstructure and Nonlinear Stress on Anisotropic Seismic Velocities,” Geophysics, Vol. 73, No. 4, 2008, pp. D41-D51.
- M. S. King, “Recent Developments in Seismic Rock Properties,” International Journal of Rock Mechanics and Mining Sciences, Vol. 46, No. 8, 2009, pp. 1341-1348. doi:10.1016/j.ijrmms.2009.04.008
- P. N. J. Rasolofosaon, “Unified Phenomenological Model for the Mechanical Behaviour of Rocks,” Geophysics, Vol. 74, No. 5, 2009, pp. WB107-WB116.
- D. A. Angus, J. P. Verdon, Q. J. Fisher and J.-M. Kendall, “Exploring Trends in Microcrack Properties of Sedimentary Rocks: An Audit of Dry-Core Velocity-Stress Measurements,” Geophysics, Vol. 74, No. 5, 2009, pp. E193- E203.
- D.-H. Han, “Effects of Porosity and Clay Content on Acoustic Properties,” Ph.D. Thesis, Stanford University, Stanford, 1986.
- K. E.-A. Van Den Abeele, J. Carmeliet, P. A. Johnson and B. Zinszner, “Influence of Water Saturation on the Nonlinear Elastic Mesoscopic Response in Earth Materials and the Implications to the Mechanism of Nonlinearity,” Journal of Geophysical Research, Vol. 107, No. B6, 2002, p. 2121. doi:10.1029/2001JB000368
- S. Tod, “The Effects of Stress and Fluid Pressure on the Anisotropy of Interconnected Cracks,” Geophysical Journal International, Vol. 149, No. 1, 2002, pp. 149-156. doi:10.1046/j.1365-246X.2002.01626.x
- B. Gurevich, D. Makarynska and M. Pervukhina, “Are Penny-Shaped Cracks a Good Model for Compliant Porosity,” In: Technical Programme Committee John Castagna, Ed., SEG Houston 2009 International Exposition Annual Meeting, Houston, 25 October 2009.
- P. Hatchell and S. Bourne, “Rocks under Strain: StrainInduced Time-Lapse Time Shifts Are Observed for Depleting Reservoirs,” The Leading Edge, Vol. 24, No. 12, 2005, pp. 1222-1225. doi:10.1190/1.2149624
- R. Prioul, A. Bakulin and V. Bakulin, “Nonlinear Rock Physics Model for Estimation of 3D Subsurface Stress in Anisotropic Formations: Theory and Laboratory Verification,” Geophysics, Vol. 69, No. 2, 2004, pp. 415-425.
- J. Herwanger and S. Horne, “Predicting Time-Lapse Stress Effects in Seismic Data,” The Leading Edge, Vol. 12, 2005, pp. 1234-1242.
- R. F. Fuck and I. Tsvankin, “Analysis of the Symmetry of a Stressed Medium Using Nonlinear Elasticity,” Geophysics, Vol. 74, No. 5, 2009, 9 p.
- A. Bakulin, I. Tsvankin and V. Grechka, “Estimation of Fracture Parameters Fromreflection Seismic Data—Part I: HTI Model Due to a Single Fracture Set,” Geophysics, Vol. 65, No. 6, 2000, pp. 1788-1802.
- S. Shapiro, “Elastic Piezosensitivity of Porous and Fractured Rocks,” Geophysics, Vol. 68, No. 2, 2003, pp. 482- 486.
- S. Shapiro and A. Kaselow, “Porosity and Elastic Anisotropy of Rocks under Tectonic Stress and Pore-Pressure Changes,” Geophysics, Vol. 70, 2005, pp. N27-N38.
- R. Zimmerman, W. Somerton and M. King, “Compressibility of Porous Rocks,” Journal of Geophysical Research, Vol. 91, No. B12, 1986, pp. 12765-12777. doi:10.1029/JB091iB12p12765
- C. Sayers and M. Kachanov, “Microcrack-Induced Elastic Wave Anisotropy of Brittle Rocks,” Journal of Geophysical Research, Vol. 100, No. B3, 1995, pp. 4149-4156. doi:10.1029/94JB03134
- M. Schoenberg and C. Sayers, “Seismic Anisotropy of Fractured Rock,” Geophysics, Vol. 60, No. 1, 1995, pp. 204-211.
- J.-M. Kendall, Q. Fisher, S. Crump, J. Maddock, A. Carter, S. Hall, J. Wookey, S. Valcke, M. Casey, G. Lloyd and W. Ismail, “Seismic Anisotropy as an Indicator of Reservoir Quality in Siliciclastic Rocks,” Structurally Complex Reservoirs, Geological Society of London, London, 2007, pp. 123-136.
- C. Sayers and D.-H. Han, “The Effect of Pore Fluid on the Stress-Dependent Elastic Wave Velocities in Sandstones,” 72nd Annual International Meeting, Society of Exploration Geophysicists, Salt Lake City, 6-11 October 2002, pp. 1842-1845.
- R. Dean, X. Gai, C. Stone and S. Minkoff, “A Comparison of Techniques for Couplingporous Flow and Geomechanics,” Society of Petroleum Engineering Reservoir Simulation Symposium, Houston, 3-5 February 2003, p. 9.
- J. Herwanger and S. Horne, “Linking Reservoir Geomechanics and Time-Lapse Seismics: Predicting Anisotropic Velocity Changes and Seismic Attributes,” Geophysics, Vol. 74, No. 4, 2009, p. W13.
- R. F. Fuck, A. Bakulin and I. Tsvankin, “Theory of Travel Time Shifts around Compacting Reservoirs: 3D Solutions for Heterogeneous Anisotropic Media,” Geophysics, Vol. 74, No. 1, 2009, p. D25.
- A. Schubnel and Y. Gueguen, “Dispersion and Anisotropy of Elastic Waves in Cracked Rocks,” Journal of Geophysical Research, Vol. 108, No. B2, 2003, p. 15. doi:10.1029/2002JB001824
- V. Grechka and M. Kachanov, “Effective Elasticity of Fractured Rocks,” The Leading Edge, Vol. 25, No. 2, 2006, pp. 152-155. doi:10.1190/1.2172305
- M. Sambridge, “Geophysical Inversion with a Neighbourhood Algorithm I. Searching a Parameter Space,” Geophysical Journal International, Vol. 138, No. 2, 1999, pp. 479-494. doi:10.1046/j.1365-246X.1999.00876.x
- M. Schoenberg, “Acoustic Characterization of Underground Fractures,” 68th Annual International Meeting, Society of Exploration Geophysicists, New Orleans, 13- 18 September 1998, pp. 1624-1626.
- E. Liu, J. A. Hudson and T. Pointer, “Equivalent Medium Representation of Fractured Rock,” Journal of Geophysical Research, Vol. 105, No. B5, 2000, pp. 2981-3000. doi:10.1029/1999JB900306
- R. Lubbe, J. Sothcott, M. Worthington and C. McCann, “Laboratory Estimates of Normal and Shear Fracture Compliance,” Geophysical Prospecting, Vol. 56, No. 2, 2008, pp. 239-247.
- L. J. Pyrak-Nolte, “Seismic Visibility of Fractures,” Ph.D. Thesis, University of California, Berkeley, 1988.
- M. Grochau and B. Gurevich, “Investigation of Core Data Reliability to Support Time-Lapse Interpretation in Campos Basin, Brazil,” Geophysics, Vol. 73, No. 2, 2008, pp. E59-E65.
- D. A. Angus, “A One-Way Wave Equation for Modelling Seismic Waveform Variations due to Elastic Heterogeneity,” Geophysical Journal International, Vol. 162, No. 3, 2005, pp. 882-892. doi:10.1111/j.1365-246X.2005.02695.x
- P. J. Usher, D. A. Angus and J. P. Verdon, “Influence of Velocity Model and Source Frequency on Microseismic Waveforms: Some Implications for Microseismic Locations,” Geophysical Prospecting, in Press.
- J. B. Walsh, “The Influence of Microstructure on Rock Deformation,” In: E. T. Brown, Ed., Comprehensive Rock Engineering. Principles, Practice and Projects, Pergamon Press, Oxford, 1993.
- T.-F. Wong and W. F. Brace, “Thermal Expansion of Rocks: Some Measurements at High Pressure,” Tectonophysics, Vol. 57, No. 2-4, 1979, pp. 95-117. doi:10.1016/0040-1951(79)90143-4
- T.-F. Wong, “Micromechanics of Faulting in Westerly Granite,” International Journal of Rock Mechanics and Mining Sciences, Vol. 19, No. 2, 1982, pp. 49-64. doi:10.1016/0148-9062(82)91631-X
- P. Wessel and W. Smith, “Free Software Helps Map and Display Data,” EOS Transactions, Vol. 72, No. 41, 1991, pp. 445-446. doi:10.1029/90EO00319