Food and Nutrition Sciences
Vol.4 No.4(2013), Article ID:29737,9 pages DOI:10.4236/fns.2013.44048
Protein Quality Evaluation of Animal Food Proteins by In-Vitro Methodologies
![]()
1Departamento de Investigación y Posgrado en Alimentos (DIPA), División de Ciencias Biológicas y de la Salud, Universidad de Sonora, Hermosillo, Mexico; 2Departamento de Agricultura y Ganadería, División de Ciencias Biológicas y de la Salud, Universidad de Sonora, Hermosillo, Mexico.
Email: *jbarron@guaymas.uson.mx
Copyright © 2013 Jesús Manuel Barrón-Hoyos et al. This is an open access article distributed under the Creative Commons Attribution License, which permits unrestricted use, distribution, and reproduction in any medium, provided the original work is properly cited.
Received February 7th, 2013; revised March 6th, 2013; accepted March 13th, 2013
Keywords: Animal Food Proteins; Protein Quality; In-Vitro Methodologies
ABSTRACT
Animal protein foods are undoubtedly among the most concentrated source of essential amino acids (AA) for the human diet. However, their high prices and diseases associated to their excessive consumption have fomented the consumption of other alternative sources of animal proteins such as those from marine or aquatic species. Sonora is a well recognized producer of animal foods in Mexico, both terrestrial and aquatic. In this study, the protein quality evaluation of these animal food sources, highly produced and consumed in Sonora, is proposed, using in-vitro methodologies. Four different species, from each aquatic and terrestrial origin, were selected. Samples of lean muscle were used in all cases. Various in-vitro methodologies for protein quality evaluation were selected, alternatives to the animal bioassays: % digestibility, Total amino acid analyses (HPLC), PDCAAS, computerized PER calculations (C-PER and DC-PER) and total collagen contents. % in-vitro digestibility presented significant differences among samples from terrestrial species, but muscle from aquatic species did not showed significant differences. All sources of proteins, both aquatic and terrestrial proved to be rich sources of essential amino acids. PDCAAS was unable to establish significant differences in protein quality among sources of protein from different origin. Both methods C-PER and DC-PER were more exact in their results and were able to detect significant differences among samples of different origin. An important finding was the great difference in the total collagen content between aquatic and terrestrial sources of proteins, where terrestrial muscle proteins had almost 10-time more collagen than aquatic protein sources. However, these collagen contents did not seem to have a significant influence in the protein quality of these animal proteins. These muscle proteins, from both aquatic and terrestrial species, confirmed to have a high protein quality and some of the in-vitro methodologies used in this study represent a valuable alternative to the animal bioassays.
1. Introduction
The nutritive quality of a food protein source is defined as the capacity to supply the quantity and proportion of essential amino acids to meet the requirements of the specie that consumes it. For humans, food proteins that contain as much essential amino acids to meet requirements and an acceptable % digestibility are classified as high quality proteins. There is not an ideal natural source of protein, able to support and maintained growth and appropriate health. Therefore the best recommendation is to consume a variety of protein sources, seeking complementation. Animal protein sources are high quality proteins, since they represent concentrated sources of essential amino acids, capable of meet amino acids requirements of humans. However, the excessive consumption of animal protein sources is also associated to various diseases (cardiovascular mainly) due to their high lipid contents. Animal food proteins, specifically muscle proteins from different species, are high quality proteins, and the lighter muscle proteins are recommended in comparison to red muscle protein sources, usually associated with higher lipid contents.
The various methodologies suggested for the evaluation of protein quality in foods intend to measure the adequacy of the protein source to supply the essential amino acids and meet the AA requirements for humans. In general terms these methodologies are divided under two categories: bioassays or in-vivo methodologies and the alternative in-vitro methodologies which intend to overcome some of the inconveniences presented by animal bioassays. The most proper and accurate way of measuring the protein quality of a protein source would be to test it in the “target” specie, however, the majority of bioassays present a variety of inconveniences such as high cost, time consuming, incapability to handle a large number of samples and the large amount of sample needed. For these reasons alternative in-vitro techniques continue to be developed. These techniques should only be considered as indicators of protein quality, since they do not measure the response of an animal consuming a test diet. In-vitro methodologies are very limited since they only measured certain aspects of protein as % digestibility or its AA contents and not the entire nutritive protein quality. A combination of in-vitro techniques are suggested when animal bioassays are not available.
Sonora, a Mexican northwest state, is a well recognized producer of animal foods, and some reaches the international market. In recent years Sonora has even increase its importance as producer of fisheries due to the increment of aquaculture as economic activity. These animal sources of protein have not been evaluated in their nutritive value, especially in their protein quality contribution to the diet.
Even when muscle protein foods from different species are well recognized as high quality protein sources for humans, there are still some questions to be solved in regards to the comparison between muscle proteins from different origins, terrestrial and aquatic species, in their digestibility, their essential AA contribution and in their overall protein quality.
Animal foods (muscle proteins) were selected for this study, in terms of their level of production, consumption and preferences by consumers. These most representative species, both from terrestrial and aquatic origin, were evaluated in their protein quality using in-vitro methodologies. Possible differences in % digestibility and protein quality among muscle proteins, from different origin, and the adequacy of in-vitro techniques to detect those differences, were the main objectives of this research.
2. Materials and Methods
2.1. Sample and Treatments
A survey of the 25 most important local markets was conducted, from which the most representative fresh muscle animal foods, from both terrestrial and aquatic species, were selected, based on consumer preference. Based on this survey, four aquatic species were selected: Tilapia, shrimp, sole and shark. Four terrestrial species highly consumed: beef, pork, chicken and turkey were also selected. In the case of aquatic species only fresh fillets were used, except for shrimp where the entire body (without exosqueleton and head) was used. Only fresh lean muscle parts were used for all samples from species of terrestrial origin. Samples characteristics were as follows:
Shrimp: specie Litopenaeus vannamei, commercial size (18 - 21 g), obtained from a local farm, October, 2010. A total of 2.5 Kg shrimp. Tilapia: specie Oreochromis niloticus. 13-month old organisms; 15 individuals of 1.5 Kg each. For shark (Mustelus spp.) and sole (Paralichthys spp.), 6 individuals of 1.5 - 2.5 Kg were obtained from a small fisherman community in Bahía de Kino, Sonora. These were obtained fresh from the fisherman, eviscerated and transported in ice to the laboratory.
Samples of lean muscles of animals from terrestrial origin most preferred by consumers were: Chicken, turkey, beef and pork. For chicken and turkey only breast were used, obtained fresh from local market in portions of 10 Kg, packed in sealed plastic bags and transported in ice to the laboratory. For beef and pork, rump and leg were used, respectively. For these, portions of 10 Kg were acquired from the local market, packed in plastic bags and transported in ice to the laboratory.
All lean muscle samples were ground, quickly freeze, lyophilized and kept in sealed containers under refrigeration (5˚C).
Lyophilized samples were analyzed for proximate chemical composition using recommended methods [1]: total moisture, total nitrogen (Kjeldahl), total fat (Soxhlet) and total ash. These analyses were done in triplicates and results are reported in moisture free basis.
2.2. Total Amino Acids
All samples, from the 8 different species, aquatic and terrestrial, were analyzed in their total amino acid contents by HPLC chromatography. The methodology suggested by Vazquez el al. 1995 [2] was essentially followed. All samples of muscle proteins, including casein (reference protein) were first acid hydrolyzed, using special tubes (Pierce Biotech, Illinois, USA), where lyophilized samples were mixed with equal parts of thioglycolic acid, HCl 6.0 N is added and after vacuum is applied tubes are sealed. Hydrolysis is carried out in a reactor (Pierce Biotech, Illinois, USA) at 160˚C for 6 hours. After hydrolysis is completed, samples are treated individually in a rot vapor (Buchi biokmannen, RE 121) at 60˚C under vacuum. Precipitated is them suspended in 1.0 mL citrate buffer 0.2 M (pH 2.2) and stored in plastic tubes under refrigeration (<4˚C). 100 µL + 40 µL of internal standard (L-alfa-amino n-butyric acid) are taken to 1.0 mL with citrate buffer. This is mixed (1:1) with o-phthaldehyde (OPA: 10 mg OPA + 250 µL methanol + 37.5 µL Brij 35 + 25 µL β-mercaptoethanol) and taken to 10 mL with potassium borate buffer (pH 10.4) for 2 min at room temperature.
After derivatization, hydrolizates were injected in a HPLC chromatographer (Varian md. 9012, Palo alto Ca. USA) in which AA are separated in a reverse phase column.
C18 (octadecyl dimetylsilan 100 × 4.6 mm), 3.0 µm particle size (Varian No. R008900E3). A flux gradient of 1.2 mL/min of 2 eluentes: A (methanol 100%) and B (methanol 10% in acetate buffer, pH 7.2) were used for the separation. A fluorescent detector was used and results were integrated with a software program CHEM station (Agliet tech. Inc. USA). AAs were first identified and quantified, using an AA standard. Results were expressed in g AA/16 g N. Determinations were performed in duplicates.
2.3. % In-Vitro Digestibility
The multi enzymatic technique proposed by Satterlee and col. 1982 [3] was essentially followed, with the adjustments suggested by Barrón, 1984 [4]. This technique involves two enzymatic solutions: soln. A made of 227,040 units (BAEE (N α-benzoyl-L-arginine) of pancreatic bovine trypsin (type 1X, SIGMA, Co.) + 1860 units (BAEE) pancreatic bovine α-chymotrypsin (tipo II, SIGMA, Co) + 0.520 units (L-Leucine β-naphthalamide) of porcine intestinal peptidase (grade I) in 10 mL of recently boiled cold water. Soln. B: 65 units (casein) of bacterial protease (Streptomyces griseus, SIGMA, Co.) in 10 mL or recently boiled cold water. Solutions A and B are adjusted pH 8.0 ± 0.02 and kept under iced water.
In the technique, 10 mg of sample N that is suspended in 10 mL of water at least 30 min before the assay, is placed in a controlled temperature reactor adapted with magnetic agitation [4] and after soln. pH is adjusted to 8.0 ± 0.2, 1.0 mL of soln. A is added and allowed to react for 10 min. at 37˚C. Then 1.0 mL of soln. B is added and temperature is set to 55˚C for 9 min. Then reaction temperature is again adjusted to 37˚C and after exactly 1.0 min (20 min total reaction) the soln. pH is recorded. This figure is used for the calculation of % in-vitro digestibility:
% in-vitro D = 234.84 − 22.56 (X)
X = pH at 20 min % in-vitro digestibility was performed in triplicates, and sodium caseinate was used as reference protein (control).
2.4. Amino Acid Score Adjusted for Protein Digestibility (PDCAAS)
This indicator of protein quality was calculated based on the total amino acid contents of the simple, considering for its calculation the limiting AA (g/16 g N) of the sample in relation to the same AA of a reference protein and multiplied by the samples % digestibility [5]. In this study the % in-vitro digestibility, obtained from the multi enzyme technique, and the FAO/WHO, 1985 protein pattern were used for the calculation of PDCAAS. PDCAAS results are express in % and are mean of duplicates.
2.5. C-PER and DC-PER
These methods of protein quality are considered as invitro methods since they are base on the total AA contents of the sample and through the use of discriminative equations the Protein Efficiency Ratio (PER) is calculated. For this study the suggestions made by Satterlee and col. 1982 [3] which appear as recommended methods in AOAC, 2000, were essentially followed. In the case of C-PER, the in-vitro % digestibility, obtained through the multi enzyme technique was used. In the case of CP-PER the technique uses the total essential amino acids of the sample, first to calculate % digestibility, following by the calculation of CP-PER, using discriminative equations. In this study the computer programs needed for the calculation of these indicators were adapted to a Windows ambient in a PC computer and calculations were performed in duplicates.
2.6. Total Collagen Contents
Total collagen in the various muscle samples was determined based on the OH-proline contents, and the methodology suggested by Vazquez, et al. 2004 [6] was followed. OH-proline analysis was performed by HPLC chromatography. After acid hydrolysis was completed, a previous step for the determination of total amino acids, an aliquot of 125 µL of the acid hydrolysis was mixed with borate buffer 0.4 M (pH 10.4, Pierce Biotech) and 250 µL aliquot is mixed with 250 µL of a soln. containing 2.0 mg/mL de NBC:Cl (7-cloro, 4-nitrobencene-2- Oxa-1,3-diazol in methanol). The mixture is heated for 5 min. at 60˚C (derivatization). Chromatography conditions were as follows: HPLC chromatographer (Varian md 9012, Palo Alto Cal. USA); Column of RP18 octadecyl dimethylsilane of 10 × 4.6 mm in diameter with support of 3.0 µm particle size (Varian Cat. No. R0089200E3); gradient flux volumen of 2.0 mL/min of soln. A: 100% methanol; soln. B: sodium acetate 0.1 M (pH 7.2), methanol and tetrahydrofuran, 90:95:5 (SIGMA, Co); Fluorescent detector (Varian Flurichrome); integrated program software (Varian Star 4.0).
OH-proline calculations were made against a standard (SIGMA, CO) and g. of total collagen was obtained by [6]: g. Total Collagen = OH-proline × 7.25. This determination was made in triplicates.
2.7. Data Analysis
An analysis of variance (ANOVA) was performed to determine the differences in the indicators of protein quality among the various muscle proteins from different species. A Tukey significant test, with a level of significance of p < 0.5, was also performed. Correlation analysis by pair of variables was applied for results of % invitro digestibility, PDCAAS, C-PER y DC-PER for all samples, with a significance level of p < 0.05. A multiple correlation analysis was performed among results from the various indicators of protein quality, for all muscle proteins from different origin. Separate correlation coefficients were calculated for each of indicators of protein quality, for muscle proteins from different origin. All these statistical analysis were performed using a statistical package JMP version 6.0 (SAS Institute, Cary N.C. USA).
3. Results and Discussion
The proximate chemical composition of these muscle samples is shown in Table 1. The total moisture content of these muscle samples was not significantly different among species. In general terms muscle samples from aquatic species have moisture contents around 80%, with the shrimp having the lower moisture of 74.9% and significant differences in total moisture was not detected among the other 3 species. For muscle samples of terrestrial species, the total moisture content was not significantly different and results were around 75%. Samples from aquatic species did not show significant differences in ash contents (Table 1), though shrimp gave values slightly lower than the rest (1.65%). For samples representative of terrestrial species, total ash contents were not significantly different, but beef showed the lower value (1.24%) and turkey gave the highest value (1.96%). Total protein contents were calculated from the % total N (Kjeldahl), using the 6.25 conversion factor. All muscle samples, from either aquatic or terrestrial species, gave values of total protein around 20%. Aquatic species showed no differences in total protein, with the shrimp having the highest value (21.46%). Muscles from terrestrial species gave total protein contents higher tan aquatic species. Chicken muscle showed total protein values higher than the rest (22.61%) and turkey had the lower value (20.18%), comparable to muscles from aquatic species. With the exception of turkey muscle, all muscle samples analyzed gave total lipid contents lower than 2.0%. In aquatic species, sole and shark muscles were the lowest in total lipid contents. Only shrimp muscle gave values of total lipids relatively higher (1.69%). For terrestrial species total lipid contents were higher than aquatic species, but lower than 2.0%. Similar results have been reported [7,8]. An important consideration is that the proximate chemical composition of muscles from animal species, tend to vary in relation to the carcass parts.
3.1. Total Amino Acids
Total amino acid contents of muscles from aquatic species are shown in Table 2. In muscles from aquatic species the AA’s Lys, Met, Cys, Gly, Arg y Ala are found in higher concentration than in casein, the reference protein used in this study. These muscles from aquatic species presented low values of Ile, Leu, Val, Tyr, Pro, Ser and His. Muscles from the 3 fish species did not presented significant differences in their amino acid content. These 3 species, sole, shark and tilapia presented higher concentration of the majority of the essential amino acids than shrimp muscle. Shrimp muscle was only similar to the other 3 species in Phe, Tyr y Leu. These AA results
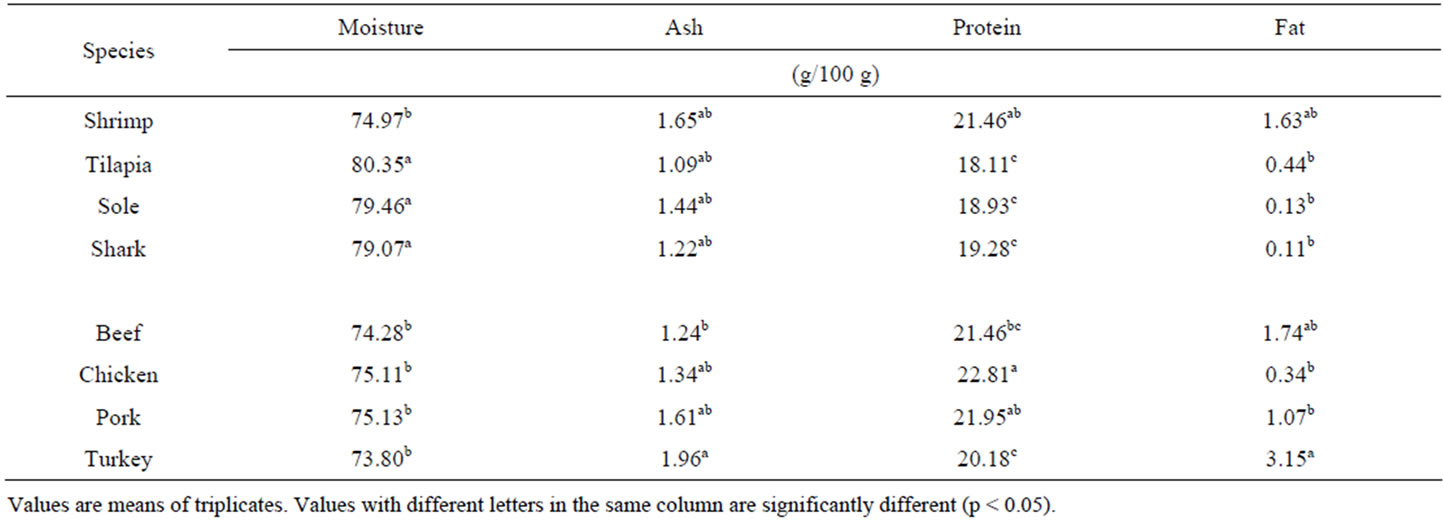
Table 1. Proximate chemical composition of most common sources of muscle proteins from various terrestrial and aquatic species.
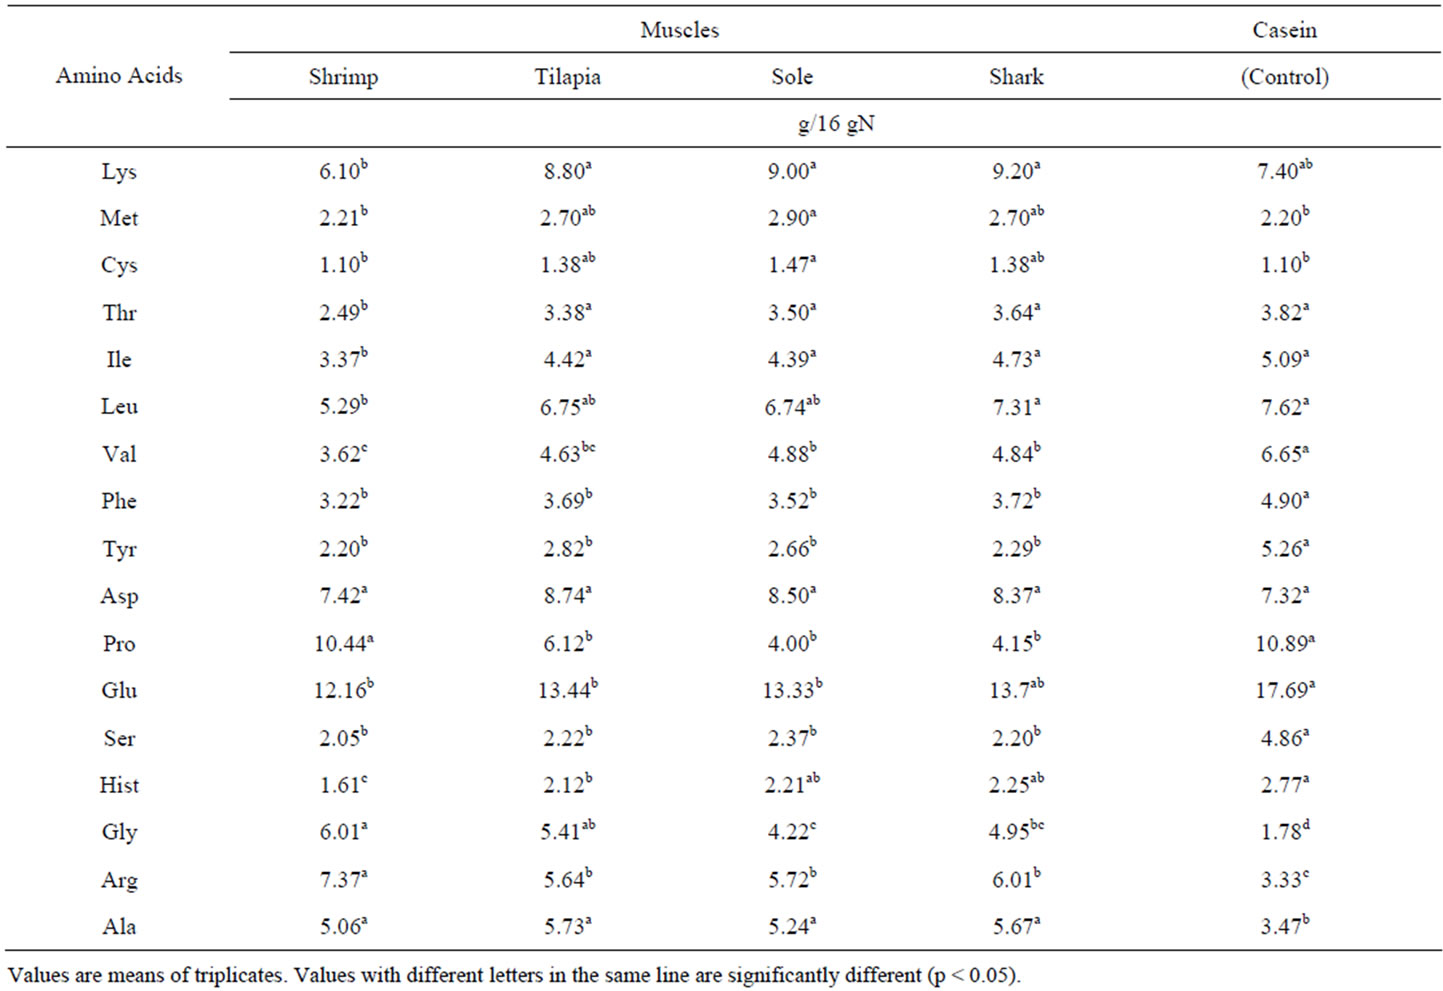
Table 2. Total amino acid contents of most common sources of muscle proteins from various aquatic species.
are very similar to those reported for other muscles from aquatic species [9,10]. The lower content of some essential amino acids in shrimp and the relatively higher AA contents in shark were found quite interesting. Table 3 presents the total amino acid contents of muscles from terrestrial species. These highly consumed representative samples of animal proteins were high in Met, Gly, Cys, Arg, Ala, but they presented lower contents of Thr, Ile, Leu, Val, Phe y Tyr, in comparison to casein. Beef muscle gave significantly higher contents, in the majority of the essential amino acids, than the other 3 species from terrestrial origin. No significant differences, in major essential AA, were found among chicken, pork and turkey muscles. These AA results are similar to those reported in other studies [11-14], though in the case of pork muscle our values are slightly higher. In general it seems to be no significant differences in essential AA content between aquatic and terrestrial muscles. From all 8 species, only shrimp muscle presented significantly lower values of essential AA.
3.2. % In-Vitro Digestibility
Table 4 shows the % in-vitro digestibility of lean muscle from different species, aquatic and terrestrial. No significant differences in % digestibility were found among muscles from aquatic species and values range from 82.0% to 83.6%. These % D values were very similar to those reported in other studies [15]. The protein quality in the feed is an important factor determining the nutritional quality of the muscle of cultivated species [16]. In the case of muscles from terrestrial species; turkey muscle was significantly higher in % digestibility than the other 3 species. On the contrary, beef muscle showed the lowest % digestibility (79.58) and there were not significant differences between chicken and pork muscles.
Once results of % digestibility, from the 8 species, were analyzed, this in-vitro technique was capable of detecting differences among muscle samples from different species, highly consumed and with recognized high protein quality. Statistical analyses showed that beef muscle had the lowest % digestibility and sole, shark and shrimp muscles are significantly better than the rest. Only turkey muscle was as good as muscles from aquatic species.
3.3. PDCAAS
This in-vitro indicator of protein quality gave values relatively low for all muscles from aquatic species (Ta-
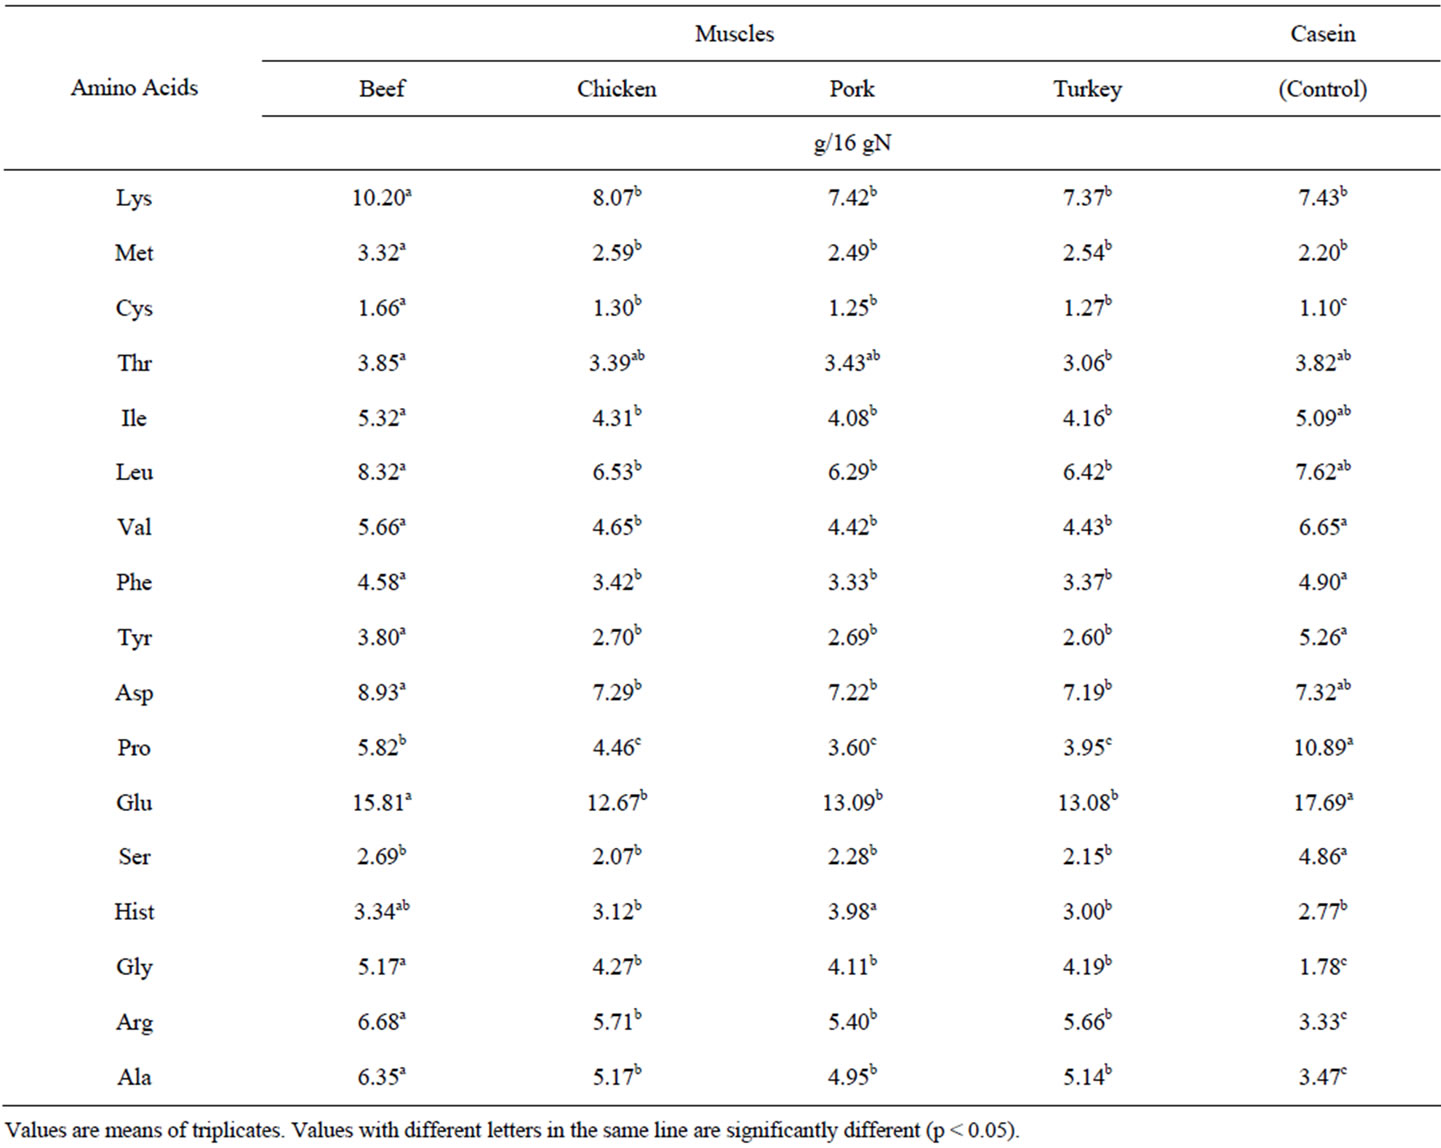
Table 3. Total amino acid contents of most common sources of muscle proteins from various terrestrial species.
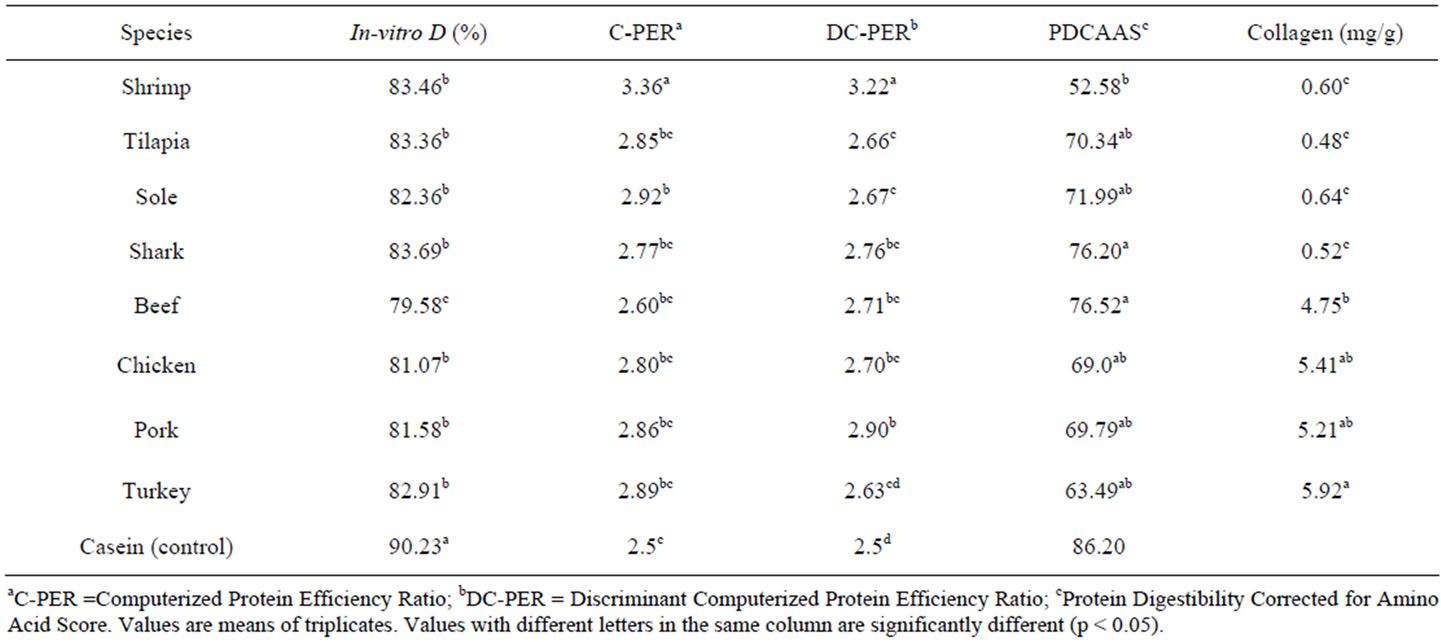
Table 4. In-vitro indicators of protein quality in most common sources of muscle proteins from various terrestrial and aquatic species.
ble 4). All 4 species showed values of PDCAAS around 70%, with shark muscle being the highest (76.2%) and shrimp muscle the lowest (56.6%). Since these muscle proteins, from aquatic species, have a recognized higher protein quality, these results of PDCAAS found for aquatic species were surprisingly low, though similar results had been reported [17]. For muscle samples from terrestrial species, PDCAAS results were not significantly different (Table 4). However, chicken muscle had the lowest value (69.0%) and beef muscle had the highest (76.5%). These PDCAAS results are comparatively lower than those reported in similar meat products [18]. In all cases, for aquatic and terrestrial species, the limiting amino acid, used for the calculation of PDCAAS, was threonine (Thr).
Based on our results, PDCAAS, as an in-vitro indicator of protein quality, is not capable of establishing significant differences in the protein quality among muscle proteins from different species, aquatic or terrestrial. A possible explanation for this is the fact that all muscle samples, used in this study, have a recognized high protein quality. All muscle samples were consistently higher, when compared to casein, the reference protein. Perhaps the fact that PDCAAS was originally design as an indicator of protein quality, but it only represents an AA score, based on the limiting AA and corrected by % digestibility. In our study, PDCAAS did not show correspondence to % digestibility values as determined by the multi enzyme technique.
3.4. C-PER
This in-vitro method estimates PER based on the sample % digestibility and its essential AA contents. In Table 4, results of C-PER for all muscle samples, from aquatic and terrestrial species are shown. All muscles from aquatic species gave values of C-PER higher than casein (reference protein). Significant differences in C-PER were found for aquatic species muscles, where shark muscle was the lowest (2.77) and shrimp muscle the highest (3.37). Similar results of C-PER have been reported for proteins of marine species [19,20]. This computerized method is able to detect differences of the order of 0.16 PER units in samples of muscles from aquatic species. In the case of muscles from terrestrial species C-PER did not show significant differences (Table 4). All muscles from terrestrial species were significantly higher in C-PER than casein, and only beef muscle was significantly different than the other terrestrial species. Apparently, C-PER is able to detect differences in protein quality of muscle proteins from different species, as low as 0.2 units of PER, and therefore is recommended for its use in protein quality studies of animal proteins.
3.5. DC-PER
The other in-vitro computerized method, DC-PER gave results significantly different for muscles of terrestrial species (Table 4). Pork muscle showed the lowest DCPER value (2.90) and turkey muscle showed the lowest (2.63). There were no significant differences between chicken and beef muscles. Similar to C-PER results, DC-PER values, of all muscles from terrestrial species, were significantly higher than casein. For muscles from aquatic species DC-PER gave values significantly higher than casein (reference protein). From these aquatic species muscles, sole, shark and tilapia were not significantly different in their DC-PER values and only shrimp was significantly higher than the others (Table 4).
In general terms, this computerized method of DCPER was found to be able to detect differences in the protein quality of muscle proteins from both terrestrial and aquatic origins. Apparently, this computerized method for PER simulation (DC-PER) was not able to detect differences in protein quality, when muscle samples had differences lower than 0.27 PER units.
3.6. Collagen Contents
When the collagen content was analyzed as a probable interference factor on % digestibility and in the protein quality of these muscle samples, it was found that muscles from aquatic species presented values lower than 1.0 g. (Table 4). Collagen values were from 0.4 to 0.7 g for these aquatic muscles. Therefore, even when these aquatic muscles showed significant differences in their collagen contents, this does not seem to be a determinant factor on their % digestibility and protein quality. On the contrary, when the collagen content was analyzed for terrestrial species muscles (Table 4), values ranged from 4.7 to 5.96, approximately 10 times higher than those of aquatic muscles. Turkey muscle total collagen was the highest value (5.92). High collagen contents were reported for chicken and other meat products previously [14,21]. These comparatively high values of collagen found in muscle from terrestrial origin may have an influence in the results of % digestibility, PDCAAS and C-PER and DC-PER; however, based on results from this study it was not possible to find an influence of collagen content on % digestibility or PDCAAS, for aquatic or terrestrial muscles. No influence was found either of the collagen content on C-PER and DC-PER, for muscles of all species. Collagen contents did not have an influence in the response of any of the in-vitro methods of protein quality evaluation used in this study.
Another objective of this study was to analyzed, from a comparative way, the various in-vitro methodologies in their capacity to evaluate the protein quality of muscles
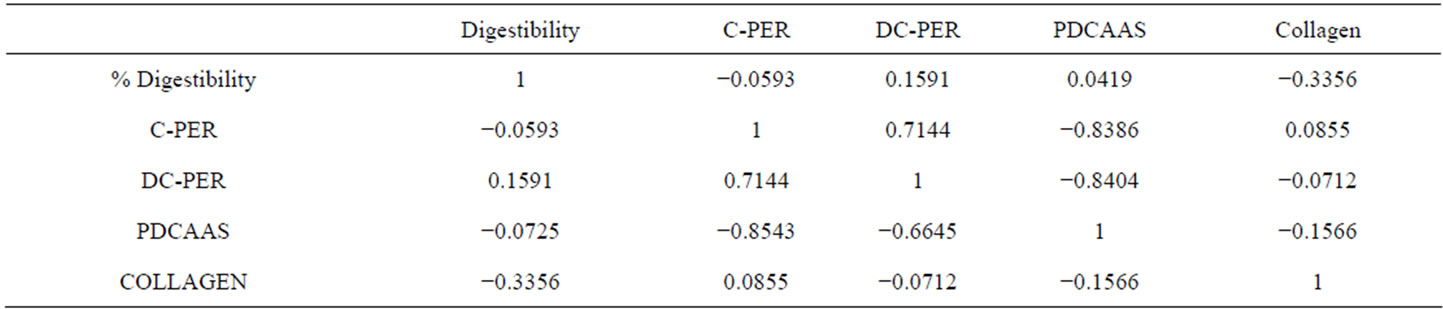
Table 5. Linear correlation among in-vitro indicators of protein quality for most common sources of muscle proteins from terrestrial and aquatic species.
from terrestrial and aquatic species. Table 5 shows the correlation factors found when a multiple correlation analysis was performed. Only the computerized methods C-PER and DC-PER gave high correlation values. Surprisingly, the collagen content seems to have a correspondence, though inversely proportional, with C-PER and DC-PER, for both aquatic and terrestrial muscles. A correspondence was found between collagen contents and % digestibility and PDCAAS, since samples with lower collagen contents had higher values of % digestibility and PDCASS. However, this possible influence of the collagen content was not found for C-PER and DC-PER computerized methods.
4. Conclusions
Muscles from terrestrial species had % total protein slightly higher than aquatic species muscles. Turkey muscle was significantly higher in total lipid content than other terrestrial species muscles and all samples of aquatic species muscles. The in-vitro % digestibility technique was able to detect significant differences among terrestrial muscles but not among muscles from aquatic species Muscle proteins from aquatic and terrestrial species showed to be good sources of the essential amino acids Lys, M + C, Ile and they are poor sources of Thr y Leu. All muscle sources analyzed, terrestrial and aquatic, had threonine (Thr) as the limiting amino acid. PDCAAS as an indicator of protein quality was not able to establish significant differences between muscle samples, either from terrestrial or aquatic origins. Based on these results, PDCAAS is not recommended to study changes in the protein quality of muscle proteins. Computerized based methods of C/PER and DC/PER were able to detect differences in the protein quality of muscles, terrestrial and aquatic, and they are recommended as an indicators of protein quality in muscle proteins. Collagen content was found to be 10 times higher in muscles from terrestrial species in comparison to aquatic species. However, the collagen content seems not to have a significant influence in the protein quality of these animal proteins and did not show to be an important factor in the results given by the in-vitro methodologies used in this study. Some of the in-vitro methodologies, used as indicator for the evaluation of the protein quality in these animal food proteins, were found very convenient and are recommended to study protein quality, when animal bioassays are not available.
REFERENCES
- Association of Official Analytical Chemists, “Methods of Analysis of the Association of Official Analytical Chemists International,” 14th Edition, Association of Official Analytical Chemists, Washington DC.
- F. A. Vázquez-Ortíz, G. Caire-Juvera, I. Higuera-Ciapara and G. Hernández, “High Performance Liquid Chromatografic Determination of Free Amino Acids in Shrimp,” Journal of Liquid Chromatography, Vol. 18, No. 10, 1995, pp. 2059-2068. doi:10.1080/10826079508013960
- L. D. Satterlee, J. G. Kendrick, H. F. Marshall, D. K. Jewell, R. A. Ali, M. M. Heckman, H. F. Steinke, P. Larson, R. D. Phillips, G. Sarwar and P. Slump, “In Vitro Assay for Predicting Protein Efficiency Ratio as Measured by Rat Bioassays,” Journal Association of Analytical Chemistry, Vol. 65, No. 4, 1982, pp. 798-809.
- J. M. Barrón, “Textural Nutritional and Toxicological Qualities of Pinto Bean (Phaseolus vulgaris L.),” Ph.D. Thesis, Department of Food Science and Nutrition, Queen Elizabeth College, London University, London, 1984.
- G. Schaafsma, “The Protein Digestibility-Corrected Amino Acid Score,” Journal of Nutrition, Vol. 130, No. 7, 2000, pp. 1865S-1867S.
- F. A. Vázquez-Ortíz, O. E. Morón-Fuenmayor and N. F. González-Méndez, “Hydroxyproline Measurement by HPLC: Improved Method of Total Collagen Determination in Meat Samples,” Journal of Liquid Chromatography, Vol. 27, No. 17, 2004, pp. 2771-2780.
- P. Bikker, M. W. A. Vergstegen and M. W. Bosch, “Amino Acid Composition of Growing Pigs Is Affected by Protein and Energy Intake,” Journal of Nutrition, Vol. 124, No. 10, 1994, pp. 1961-1969.
- N. F. Haard, “Control of Chemical Composition and Food Quality Attributes of Cultured Fish,” Food Research International, Vol. 25, No. 4, 1992, pp. 285-307. doi:10.1016/0963-9969(92)90126-P
- D. Hamm, “Amino Acid Composition of Breast and Thigh Meat from Broilers Produced in Four Location of the United States,” Journal of Food Science, Vol. 46, No. 4, 1981, pp. 1122-1124. doi:10.1111/j.1365-2621.1981.tb03005.x
- M. M. Hernández, V. I. Sousa and A. Sotelo, “The Protein Efficiency Ratios of 30:70 Mixtures of Animal: Vegetable Proteins Are Similar or Higher than Those of the Animal Foods Alone,” Journal of Nutrition, Vol. 126, No. 2, 1996, pp. 574-581.
- J. Kim and S. Lall, “Amino Acid Composition of Whole Body Tissue of Atlantic Halibut (Hippoglossus hippoglossus), Yellowtail Flounder (Pleuronectes ferruginea) and Japanese Flounder (Paralichthys olivaceus),” Aquaculture, Vol. 187, No. 3-4, 2000, pp. 367-373. doi:10.1016/S0044-8486(00)00322-7
- L. Limin, X. Feng and H. Jing, “Amino Acids Composition Difference and Nutritive Evaluation of the Muscle of Five Species of Marine Fish, Pseudosciaena crocea (Large Yellow Croaker), Lateolabrax japonicus (Common Sea Perch), Pagrosomus major (Red Sea Bream), Seriola dumerili (Dumeril’s Amberjack) and Hapalogenys nitens (Black Grunt) from Xiamen Bay of China,” Aquaculture Nutrition, Vol. 12, 2006, pp. 53-59. doi:10.1111/j.1365-2095.2006.00381.x
- T. N. ZakharievIbrishimov and G. Monov, “Amino Acid Makeup of Beef,” Veterinarno-Meditsinski Nauki, Vol. 17, No. 8, 1980, p. 31.
- C. G. Zarkadas, “Assessment of the Protein Quality of Selected Meat Products Based on Their Amino Acids Profiles and Their Myofibrillar and Connective Tissue Protein Contents,” Journal of Agriculture Food Chemistry, Vol. 40, No. 5, 1992, pp. 790-800. doi:10.1021/jf00017a017
- F. Mendel, “Nutritional Value of Protein from Different Food Source. A Review,” Journal of Agriculture and Food Chemistry, Vol. 44, No. 1, 1998, pp. 6-29.
- J. M. Ezquerra, N. V. Parra and C. Carrillo, “Efecto Postcosecha de la Concentración de Proteína en la Dieta Sobre la Calidad Química, Microbiológica y Textura de Camarón Blanco (Litopenaeus vannamei) Cultivado,” Biotécnia, Vol. 5, No. 1, 2003, pp. 34-41.
- S. N. El and A. Kavas, “Determination of Protein Quality of Rainbow Trout (Salmon irideus) by in Vitro Protein Digestibility-Corrected Amino Acid Score,” Journal of Food Chemistry, Vol. 55, No. 3, 1996, pp. 221-223. doi:10.1016/0308-8146(95)00111-5
- D. E. Goll, R. W. Bray and W. G. Hoekstra, “Age-Associated Change in Muscle Composition. The Isolation and Properties of a Collagenous Residue from Bovine Muscles,” Journal of Food Science, Vol. 28, No. 5, 1963, pp. 503-509. doi:10.1111/j.1365-2621.1963.tb00234.x
- H. S. Ryu and K. W. Lee, “Predicting the Nutritional Value of Seafood Proteins as Measured by Newer in Vitro Model 2. C-PER and DC-PER of Marine Crustacea,” Han’guk Susan Hakhoechi, Vol. 19, No. 3, 1986, pp. 219- 226.
- H. S. Ryu, K. H. Lee, J. Y. Kim and B. D. Choi, “Predicting the Nutricional Value of Seafood Proteins as Measured by Newer in Vitro Model 1. C-PER and DC-PER of Shellfish Proteins,” Korean Society of Food Nutrition, Vol. 14, No. 3, 1985, pp. 265-273.
- K. Sakakibara, S. Tabata, N. Shiba, T. Gotoh, S. Nishimura and I. Iwamoto, “Myofibre Composition and Collagen Content in M. iiotibialis lateralis and M. pectoralis of Silkie and White Leghorn Chickens,” Vol. 41, No. 5, 2000, pp. 570-574.
NOTES
*Corresponding author.