Food and Nutrition Sciences
Vol. 3 No. 9 (2012) , Article ID: 22295 , 8 pages DOI:10.4236/fns.2012.39158
Effect of Nutrition Education Using Self-Monitoring of Blood Glucose (SMBG) on Glycemic Control in Non-Insulin-Treated Obese Type 2 Diabetes Patients
![]()
1Department of Community Health and Welfare Center, Niigata Medical Center, Niigata, Japan; 2Graduate School of Health and Welfare, Niigata University of Health and Welfare, Niigata, Japan; 3Department of Diabetes Center, Niigata Medical Center, Niigata, Japan.
Email: *miyo-h@kitasato-u.ac.jp
Received July 6th, 2012; revised August 6th, 2012; accepted August 13th, 2012
Keywords: SMBG; Glycemic Control; Nutrition Education; Satisfaction with Diabetes; Non-Insulin-Treated Type 2 Diabetes
ABSTRACT
The effect of nutrition education using self-monitoring of blood glucose on glycemic control was investigated in the present study. Of 36 males and 25 females aged 30 - 69 years under outpatient treatment at 3 hospitals in Niigata prefecture, Japan, 61 non-insulin-treated obese type 2 diabetes patients with HbA1c of 6.9% - 9.3% and body mass index of 25 kg/m2 or higher were randomly allocated. Thirty and 31 patients were analyzed in intervention and control groups, respectively. The intervention group performed self-monitoring of blood glucose 2 hours after supper twice a week for 6 months and underwent nutrition education on the association between meals and postprandial blood glucose once every 2 months. The primary outcome was glycated hemoglobin, with the secondary outcome of body mass index. Stages of change for eating the appropriate supper amount were investigated to verify the process of the educational effect, and satisfaction with diabetes treatment and well-being were investigated to verify the continuity of treatment. On intention-to-treat analysis, glycated hemoglobin (mean ± SD) decreased from 7.9% ± 0.6% to 7.7% ± 0.6% in the intervention group but increased from 7.9% ± 0.6% to 8.1% ± 0.6% in the control group, showing a significant difference in the change after intervention between the groups (p = 0.027). In the intervention group, body mass index decreased from 28.9 ± 3.8 to 28.4 ± 3.7 kg/m2 (p = 0.019), the stages of change to learn the appropriate amount of supper progressed (p = 0.026), and satisfaction with diabetes treatment increased (p = 0.031).
1. Introduction
The objective of diabetes treatment is to inhibit the development and progression of complications. The importance of glycemic control for inhibition of complications has been investigated in various large-scale clinical studies [1], and the close relationship between postprandial hyperglycemia and arteriosclerotic diseases, such as myocardial and cerebral infarction, has been clarified [2,3]. In response to these reports, the International Diabetes Federation (IDF) published the “Guideline for Management of Postmeal Glucose” in September 2007 [4], in which the target blood glucose level 2 hours after a meal was specified to below 140 mg/dl for diabetes patients, and selfmonitoring of blood glucose (SMBG) was recommended as a useful tool to achieve that target. The American Association of Diabetes Educators (AADE) also stated that“regular monitoring is an essential component of any diabetes management program” [5]. Studies on the educational effect of SMBG for non-insulin-treated type 2 diabetes patients have progressed and its effectiveness has been evaluated [6-9]. The conclusions of a systematic clinical study on blood glucose were as follows: “Our findings demonstrate that appropriate use of SMBG in poorly controlled, insulin-naive type 2 diabetic patients can be efficacious and clinically meaningful.” [10].
In our previous study [11], we verified that nutrition education using SMBG 2 hours after supper twice a week was effective for glycemic control in non-insulin-treated type 2 diabetes patients. We also showed that the effect may have been due to improved eating ability by selflearning the association between meals and blood glucose through SMBG. This study suggested that SMBG is a necessary tool for patients to learn the association between postprandial blood glucose levels and an ingested meal.
In addition, it has been reported that SMBG and intervention based on the educational programme, based on face-to-face encounters every 3 months and additional telephone contacts every month, significantly improved glycemic control [12]; however, no tool to educate the association between postprandial hyperglycemia and meals was used. Moreover, the Guidelines for Self-Monitoring of Blood Glucose in Non-Insulin Treated Type 2 Diabetes published by the IDF did not mention nutrition education on the association between postprandial hyperglycemia and ingested meals [13].
Thus, we investigated the effects of nutrition education using SMBG and newly developed educational tools on glycemic control in non-insulin-treated obese type 2 diabetes patients.
2. Materials and Methods
2.1. Procedure
2.1.1. Study Design
A randomized controlled study was performed.
2.1.2. Subjects
36 males and 25 females non-insulin-treated obese (Body mass index (BMI) over 25 kg/m2), type 2 diabetes patients aged 30 - 69 years with HbA1c of 6.9% - 9.3% and treated in the outpatient clinic in Niigata Medical Center, Nagaoka Chuo General Hospital, and Kariwagun General Hospital in Niigata prefecture, Japan, who gave consent for this study were registered. Those who had changed medication 6 months prior to the time of intervention (March 2010) were excluded. Sixty-one patients at the 3 hospitals were stratified according to the hospital, gender, age, BMI, and HbA1c and randomly allocated to intervention (n = 30) and control (n = 31) groups. To estimate the target sampling size, the endpoint was set to HbA1c reduction, and the reduction by intervention and that in the control group were assumed to be –0.5 and 0%, respectively, referring to a previous study [11]. Setting the approximate population variance at 0.3%, significance level at 5%, and power at 90%, the sample size for 2-sided analysis was estimated to be 60 or more in the 2 groups.
2.1.3. Intervention Method
The assessment period was set between September 2010 and February 2011. In the intervention group, patients measured the blood glucose level 2 hours after supper twice a week (weekdays and holidays) for 6 months, and recorded the following items on an “SMBG record form”: the content of the meal and blood glucose level 2 hours after the meal, place where the meal was eaten, presence or absence of exercise after the meal, and self-evaluation of the association between the meal and blood glucose level. Patients attended nutrition education concerning the association between blood glucose and meals using educational tools when they visited the hospital once every 2 months (3 times in total). The control group attended nutrition education without SMBG using the same educational tools once every 2 months. Target BMI and HbA1c after 6 months were set in the first session of nutrition education in both groups, but physicians were not informed of the target values, registered dietitians managed these values. Nutrition education was performed by the same registered dietitian at Niigata Medical Center and 4 registered dietitians each at the 2 other hospitals, using the same educational media and content, and the frequencies of assignment to the intervention and control groups were adjusted to be the same by each registered dietitian. The SMBG procedure was explained by a clinical technologist at Niigata Medical Center, a nurse at Nagaoka Chuo General Hospital, and a registered dietitian at Kariwagun General Hospital.
2.1.4. Evaluation Method
Prior and post surveys were performed in September 2010 and March 2011, respectively. The primary outcome was HbA1c, and the secondary outcome was BMI. In addition, the stages of change for eating the appropriate supper amount (the stages of change) were investigated to verify the process of the educational effect, and satisfaction with diabetes treatment and well-being were investigated to verify the continuity of treatment. Survey items were height, weight, and HbA1c on blood testing, satisfaction with diabetes treatment, well-being, the stages of change, and execution of exercise. Satisfaction with diabetes treatment was assessed using Bradley’s questionnaire (8 items) translated into Japanese by Ishii [14]. There were 7 choices of answer from “fully satisfied: 6 points” through to “not satisfied at all: 0 points”, showing that the evaluation is more favorable as the score increases. Well-being was also assessed using Bradley’s questionnaire (12 items) translated into Japanese by Ishii [15]. There were 4 choices of answer from “always: 1 point” through to “not at all: 4 points”, showing that the evaluation is more favorable as the score increases. In summation of the scores of satisfaction with diabetes treatment and well-being, the scores of negative items were inversed. The total score was analyzed. Regarding the stages of change, that of the important item of this study, “ingestion of an appropriate amount of supper (desirable calories and food balance)”, was surveyed using a 5-stage rating: continued for more than half a year, 1 point; continued for less than half a year, 2 points; thinking of starting within one month of preparation, 3 points; thinking of starting within half a year, 4 points; and not thinking of starting within half a year, 5 points [16].
For SMBG, ONE TOUCH Ultra Vue (Johnson & Johnson Co., Ltd.) was used, and the device was provided to patients out of our research funds. SMBG was performed at the patients’ home, and blood testing, questionnaires, and nutrition education took place at each hospital. Survey results were analyzed at the Diabetes Center of Niigata Medical Center. HbA1c was measured using an automatic glycohemoglobin measurement device, ADAMS A1c HA-8170, at Niigata Medical Center and Kariwagun General Hospital, and JCA-BM2250 (Nihon Denshi) at Nagaoka Chuo General Hospital. HbA1c is presented as National Glycohemoglobin Standardization Program (NGSP) values (=Japan Diabetes Society (JDS + 0.4%) [17].
In statistical analysis, after the test for normality, changes in HbA1c and BMI after intervention were analyzed using the paired t-test, and differences in changes after intervention between groups were analyzed using the unpaired t-test. The Wilcoxon signed-ranks test was employed for analysis of changes after intervention in the scores of attitude and behavior, and between-group differences in changes after intervention were analyzed using the Mann-Whitney test. For analysis of betweengroup differences in the change in exercise after intervention, the χ2 test of independence was employed. SPSS 19.0 for Windows was used for data analysis.
2.1.5. Subjects Analyzed
Subjects included in analysis are shown in Figure 1. Intention-to-treat analysis (ITT analysis) and per-protocol analysis excluding dropouts (pp analysis) were performed. Excluding 4 patients unable to follow due to transfer and admission, 5 dropouts who performed SMBG only 24 times or less, which is less than half of the target frequency, and 2 patients who changed to DPP-4 inhibitor treatment, in total 11 patients (36.7%), 19 patients were included in pp analysis. In the control group, excluding 2 admitted, 3 with a change in DPP-4 inhibitor treatment, one with additional treatment beside this intervention, one dropout, and one with discontinuation of medication, in total 8 patients (25.8%), 23 patients were included.
2.1.6. Ethical Considerations
Regarding ethical considerations, this study was performed conforming to the Declaration of Helsinki after examination and approval by the Ethics Committees of Niigata Medical Center and Niigata University of Health and Welfare. Examination and approval were also obtained from the Ethics Committees of collaborating hospitals, Nagaoka Chuo General Hospital and Kariwagun General Hospital. Collaboration by patients was optional, and written informed consent was obtained. Data were managed by assigning IDs to prevent identification of individual patients.
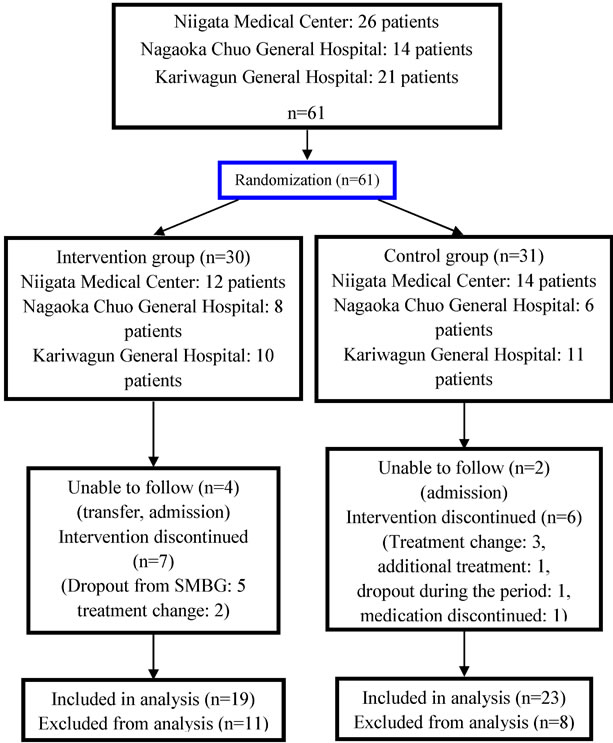
Figure 1. Flowchart of patients in the randomized controlled.
2.2. Nutrition Education Tool
The text of the nutrition education tool was composed of: 1) “To improve postprandial hyperglycemia and achieve appropriate HbA1c”, and 2) “Real-size photographs of dishes to learn the appropriate amounts of single meals”.
1) “To improve postprandial hyperglycemia and achieve appropriate HbA1c”
This section was as follows to facilitate understanding of the association between postprandial blood glucose and meals: (1) Why is postprandial blood glucose important? (2) Postprandial blood glucose and nutrients (including figures presenting “the speeds of conversion and ratios of nutrients to blood glucose) [18]; (3) Important points of meals; (4) Setting a target value of HbA1c; and (5) Lookback check list. The “Look-back check list” is shown in Figure 2. This list was prepared to check whether the measured postprandial blood glucose level was higher than the target and to identify the cause when it was higher. The check points were prepared based on approximately 3 viewpoints. Firstly, 5 important points concerning meals were established (1. Did you eat excessive amounts of staple food? White rice or whole grain?) [19,20]; 2. Did you eat excessive amounts of foods high in carbohydrates, except staple food? [19]; 3. Did you have more than one main dish? [19]; 4. Was your meal lacking in vegetables, seaweed, and mushrooms? [21]; and 5. Did you eat excessive amounts of oil or fat?) [20]. These items were accompanied by notes describing the presence of evidence, and the mechanism was closely explained. Secondly, 5 items concerning meals other than the important points were established (6. Did you eat fruit with your meal? 7. Did you eat snacks before your meal? 8. Did you eat snacks after your meal? 9. Did you eat quickly? 10. Did you drink too much alcohol?). Thirdly, 3 items other than those concerning meals were established (11. Did you forget to take your medicine? 12. Was the interval short between lunch and dinner? 13. Are you sick (fever)?) (13 items in total). Patients checked the list after each blood glucose measurement to confirm problems with their own meals.
2) “Real-size photographs of dishes to learn the appropriate amounts of single meals”
To facilitate the understanding of items 1, 2, 3, and 5 of the “important points of meals”, “the appropriate amounts of single meals” of related dishes were presented as real-size photographs. For item 4, photographs were omitted because it is easy for Japanese to identify appropriate amounts. Six dishes to reduce carbohydrates to a specific amount were presented with regards to staple food, such as those containing vegetables high in carbohydrates, such as potatoes and pumpkin, and gyoza containing wheat flour. Regarding the main dish, 8 dishes were presented, such as mixed proteinaceous foods and vegetables (e.g. boiled chicken and vegetables) and main dishes that tended to be eaten excessively (fried chicken and Chinese dishes). Real-size photographs of meals actually served to diabetes patients admitted to Niigata Medical Center were presented. To facilitate understanding of the amounts in the photographs, not only the energy, but also the weight (g), size, and number of pieces were presented numerically (e.g. 3 cm in length × 3 cm in width), and the approximate amount of 1 unit was also presented. For photographs of main dishes, the ratio of fat in one meal was presented, in addition to nutrition labeling of energy and fat. Tableware size was also presented in each photograph to facilitate understanding of the appropriate amount.
In the intervention group, 1) and 2) were used as nutrition education tools. In the control group, the same tools were basically used, but the “Look-back check list” was omitted from 1).
2.3. Training of Registered Dietitians
To perform identical nutrition education, registered dietitians at the 3 hospitals underwent training in the effective use of nutrition education tools.
3. Results
Table 1 shows patient characteristics at baseline, showing no significant differences between the 2 groups.
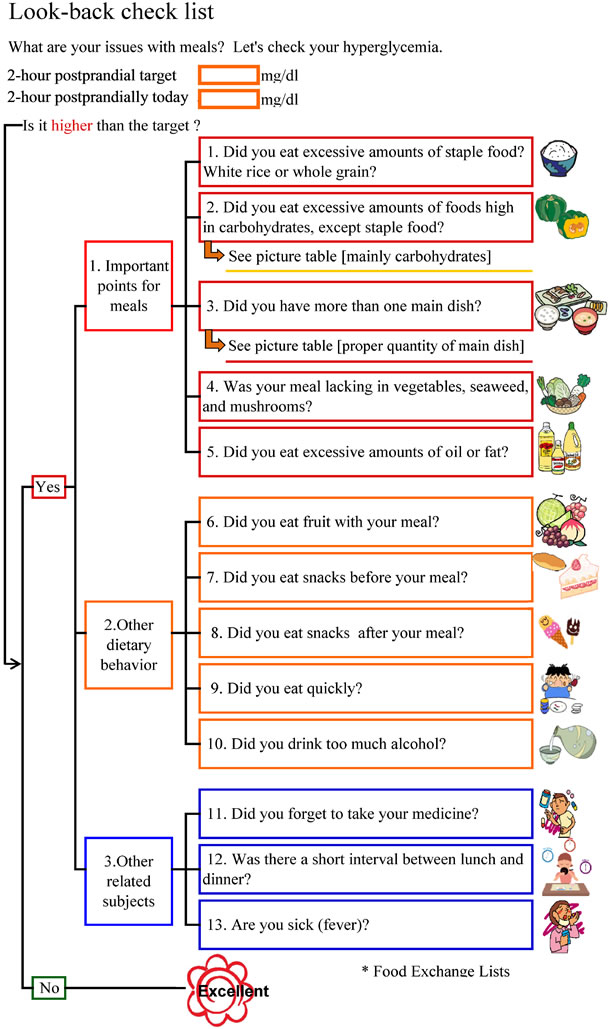
Figure 2. Look-back check list.
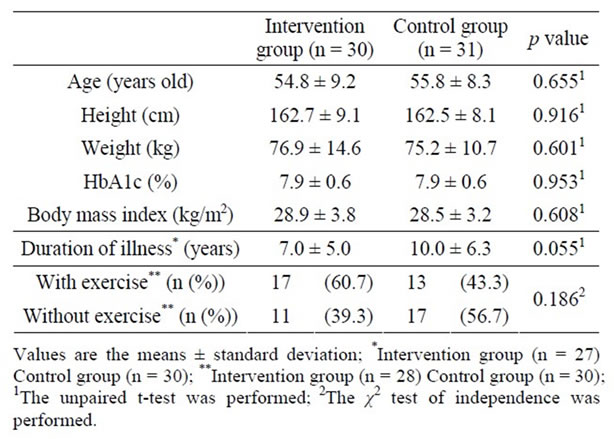
Table 1. Patient characteristics at baseline.
3.1. Changes in HbA1c and BMI
Changes in HbA1c and BMI are shown in Table 2. The means ± standard deviation of HbA1c before and after intervention were 7.9% ± 0.6% and 7.7% ± 0.6% in the intervention group, respectively, and 7.9% ± 0.6% and 8.1% ± 0.6% in the control group, respectively, showing no significant changes, but differences between the values before and after intervention were –0.12 ± 0.56 and +0.26 ± 0.57 in intervention and control groups, showing a significant difference between the 2 groups (p = 0.027). The means ± standard deviation of BMI significantly decreased from 28.9 ± 3.8 to 28.4 ± 3.7 kg/m2 in the intervention group (p = 0.019), but no change was noted in the control group (from 28.5 ± 3.2 to 28.3 ± 3.4 kg/m2). There was no significant difference in the change in BMI after intervention between the 2 groups. Similar findings were obtained on pp analysis excluding dropouts.
3.2. Changes in the Stages of Change
Changes after intervention in the scores of the stages of change are shown in Table 3. No significant differences were noted in any item between intervention and control groups before intervention. The stages of change progressed after intervention in the intervention group (p = 0.026), resulting in a significant difference in the change between the 2 groups (p = 0.015).
3.3. Changes in Satisfaction with Diabetes Treatment and Well-Being
Changes in the scores of satisfaction with diabetes treatment after intervention and well-being are shown in Table 3. No significant differences were noted in the score of either item between intervention and control groups before intervention. The score of satisfaction with diabetes treatment was significantly increased after intervention in the intervention group (p = 0.031), but no significant change was noted in the control group. On between-group comparison of the change, no significant difference was noted. No significant changes in the score of well-being were noted in either group, nor was there a significant difference in the score change after intervention between the groups. Similar findings were obtained on pp analysis.
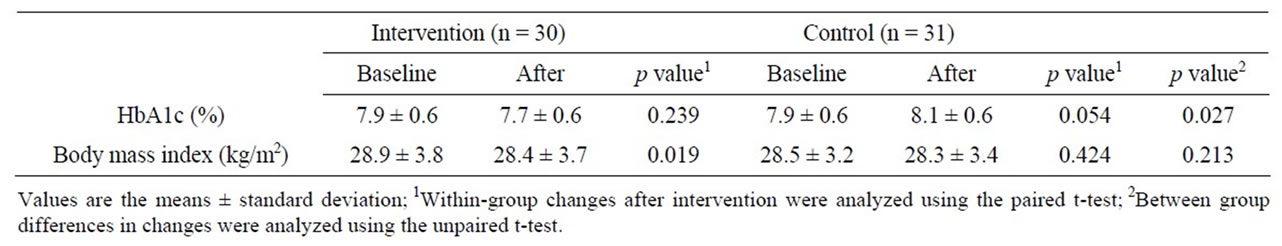
Table 2. Changes in HbA1c and body mass index baseline and after intervention.
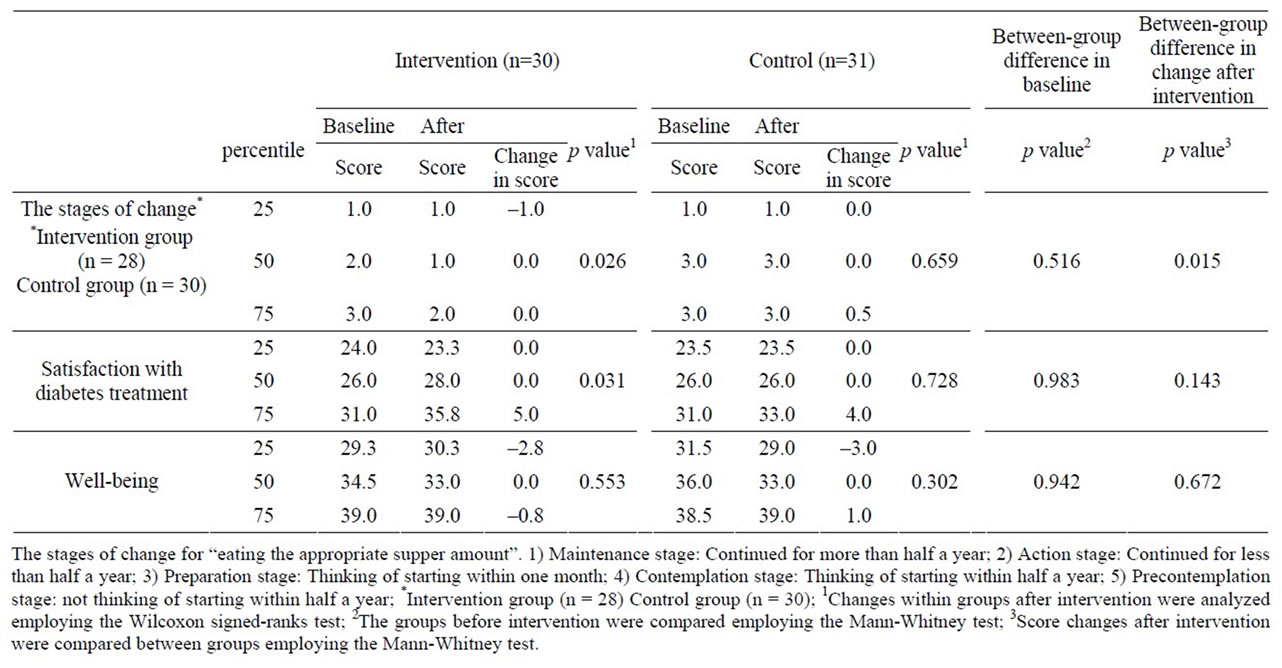
Table 3. Changes in the stages of change for eating the appropriate supper amount, satisfaction with diabetes treatment, and well-being after intervention.
4. Discussion
Nutrition education using SMBG 2 hours after supper twice a week for 6 months was effective for glycemic control at the 3 hospitals, which may have been due to the effects of both SMBG and checking problems by looking back at meals. Factors influencing blood sugar control include exercise, in addition to diet; considering that there were no differences in the frequency of exercise between before and after intervention, the results of this study suggest that dietary improvement may be effective [22]. Nutrition education was performed using 2 newly developed nutrition education tools. The “Lookback check list” facilitated detailed understanding of the association between dietary contents and blood glucose levels, which aimed at patients finding problems in their own meals. “Real-size photographs of dishes to learn the appropriate amounts of single meals” were effective to learn the appropriate amounts of meals. Regarding staple food, photographs of dishes containing potatoes and pumpkin may have been useful to prevent excess carbohydrate intake and improve blood glucose. Photographs of main dishes led to appropriate protein and fat intakes, which was useful in improving blood glucose; however, a limited number of dishes presented may not be enough to reflected daily meals, suggesting the necessity of increasing the number of dishes.
Meals during hospital stays and delivery meals at home are useful for diabetes patients to learn the appropriate amounts of meals, but these are unusual in daily life. Obese type 2 diabetes patients tend to overeat at supper [23]. The stages of change of “eating an appropriate amount of supper (desirable calories and food balance)” significantly progressed in the intervention group, suggesting that the “Real-size photographs of dishes to learn the appropriate amounts of single meals” in addition to SMBG were useful and reduced food intake at supper.
The influence of stress of performing SMBG was investigated based on the scores of satisfaction with diabetes treatment and well-being. In the intervention group, satisfaction with learning the relationship between blood glucose elevation after supper and meals through SMBG was high at all 3 hospitals, and the score of satisfaction with diabetes treatment was significantly higher in the intervention group than that in the control group. Realtime information about their own blood glucose levels measured by SMBG and its close correlation with the meal may have elevated the motivation of patients, as previously reported [11]; however, when a high blood glucose level continued on SMBG, some patients lost interest and temporarily discontinued measurements. Measurement of blood glucose at 7 time points a day [10], to compare morning and daytime values so that patients could realize that they were overeating at supper, should have been applied in some cases or interventions should have been considered when it was difficult to achieve the target HbA1c, such as changing the target during the intervention period [12]. However, the wellbeing score did not decrease, which may not have affected the operation. Because the SMBG procedure had been fully explained, the association with meals had been sufficiently explained, and the measurement was not daily.
The means ± standard deviations of the blood glucose level 2 hours after supper were 203.9 ± 32.8 and 210.4 ± 30.6 mg/dl on holidays and weekdays, respectively, showing no significant difference.
Diabetes is considered to be a disease of self-care management, and SMBG is an appropriate tool for patients’ self-care management. In the US, it is said that diabetes care begins with SMBG [24]. Since SMBG may be used as an effective means of self-management only when behavior modification and the treatment method are adjusted [13], educational tools readily understandable for patients and communication with medical staff are necessary. It is important to use SMBG for educational feedback [25].
This is an intervention study involving a limited number of patients conducted in a community in Japan. Therefore, it is necessary to involve many subjects in a wider region. Changes in dietary intake were not examined in this study. The effects of nutrition education on HbA1c would be clearer if an examination of dietary intake was performed.
5. Conclusion
Newly developed nutrition education tools using SMBG 2 hours after supper twice a week were effective for glycemic control in this study performed at these 3 medical institutions. Both the “Look-back check list”/“Real-size photographs to learn the appropriate amounts of single meals” and SMBG may have been effective. The score of the stages of change significantly increased after intervention in the intervention group, and the change was significantly different between the 2 groups. The score of satisfaction with diabetes treatment was significantly higher in the intervention group than that in the control group, and the well-being score did not decrease in the intervention group with SMBG, showing no significant difference from the control group. It is suggested that nutrition education using meal-related SMBG is effective for glycemic control in non-insulin-treated obese type 2 diabetes patients.
6. Acknowledgements
We are grateful to Dr. Kazuaki Yahata and registered dietitians in the Nutrition Department, Nagaoka Chuo General Hospital, and Dr. Ichiro Wakui and registered dietitians in the Nutrition Department, Kariwagun General Hospital, for their cooperation with this study.
REFERENCES
- I. M. Stratton, A. I. Adler, H. A. Neil, D. R. Matthews, S. E. Manley, C. A. Cull, D. Hadden, R. C. Turner and R. R. Holman, “Association of Glycaemia with Macrovascular and Microvascular Complications of Type 2 Diabetes (UKPDS 35): Prospective Observational Study,” British Medical Journal, Vol. 321, No. 12, 2000, pp. 405-412. doi:10.1136/bmj.321.7258.405
- The DECODE Study Group, “Glucose Tolerance and Mortality; Comparison of WHO and American Diabetic Association Diagnostic Criteria,” Lancet, Vol. 354, No. 21, 1999, pp. 617-621.
- M. Tominaga, H. Eguchi, H. Manaka, K. Igarashi, T. Kato and A. Sekikawa, “Impaired Glucose Tolerance Is a Risk Factor for Cardiovascular Disease, but Not Impaired Fasting Glucose,” Diabetes Care, Vol. 22, No. 6, 1999, pp. 920-924. doi:10.2337/diacare.22.6.920
- International Diabetes Federation, “Guideline for Management of Postmeal Glucose,” 2007. http://www.idf.org
- American Association of Diabetes Educators, “A Core Curriculum for Diabetes Education,” 2003.
- M. Franciosi, P. F. ellegrini, G. De Berardis, M. Belfiglio, D. Cavaliere, B. Di. Nardo, et al., “The Impact of Blood Glucose Self-Monitoring on Metabolic Control and Quality of Life in Type 2 Diabetic Patients,” Diabetes Care, Vol. 24, No. 11, 2001, pp. 1870-1877. doi:10.2337/diacare.24.11.1870
- W. A. Davis, D. G. Bruce and T. M. Davis, “Is SelfMonitoring of Blood Glucose Appropriate for All Type 2 Diabetic Patients?” Diabetes Care, Vol. 29, No. 8, 2006, pp. 1764-1770. doi:10.2337/dc06-0268
- D. G. Bruce, W. A. Davis, C. A. Cull and T. M. Davis, “Diabetes Education and Knowledge in Patients with Type 2 Diabetes from the Community. The Fremantle Diabetes Study,” Journal of Diabetes & Complications, Vol. 17, No. 2, 2003, pp. 82-89.
- U. Schwedes, M. Siebolds and G. Mertes, “Meal-Related Structured Self-Monitoring of Blood Glucose,” Diabetes Care, Vol. 25, No. 11, 2002, pp. 1928-1932. doi:10.2337/diacare.25.11.1928
- W. H. Polonsky, L. Fisher, S. C. H. Chikman, D. A. Hinnen, C. G. Parkin, Z. Jelsovsky, B. Petersen, M. Schweitzer and R. S. Wagner, “Structured Self-Monitoring of Blood Glucose Significantly Reduces A1C Levels in Poorly Controlled, Noninsulin-Treated Type 2 Diabetes,” Diabetes Care , Vol. 34, No. 2, 2011, pp. 262-267. doi:10.2337/dc10-1732
- M. Hasegawa, “Effects on Glucose Control of Nutrition Education Using Self-Monitoring of Blood Glucose in obese Type 2 Diabetes Mellitus Patients Not Receiving Insulin Therapy,” Tonyobyo, Vol. 53, No. 8, 2010, pp. 636-643.
- M. Franciosi, G. Lucisano, F. Pellegrini, A. Cantarello, et al., “ROSES: Role of Self-Monitoring of Blood Glucose and intensive Education in Patients with Type 2 Diabetes not Receiving Insulin, A Pilot Randomized Clinical Trial,” Diabetic Medicine, Vol. 28, No. 7, 2011, pp. 789- 796. doi:10.1111/j.1464-5491.2011.03268.x
- International Diabetes Federation, “Self-Monitoring of Blood Glucose in Non-Insulin Treated Type 2 Diabetes,” 2009. http://www.idf.org
- H. Ishii, C. Bradley, A. Riazi, S. Barendse and K. Yamamoto, “Japanese Translation of the Diabetes Treatment Satisfaction Questionnaire (DTSQ) and Its Evaluation,” Igaku-No-Ayumi, Vol. 192, No. 7, 2000, pp. 809-814.
- C. Bradley, “The Well-being Questionnaire,” In: C. Bradley, Ed., Handbook of Psychology and Diabetes, Harwood Academic Publishers, Chur, 1994, pp. 89-109.
- J. O. Prochaska and C. C. DiClemente, “Stages and Processes of Self-Change of Smoking: Toward an Integrative Model of Change,” Journal of Consulting and Clinical Psychology, Vol. 51, No. 3, 1983, pp. 390-395. doi:10.1037/0022-006X.51.3.390
- Y. Seino, K. Nanjo, N. Tajima, T. Kadowaki, A. Kashiwagi, E. Araki, C. Ito, N. Inagaki, Y. Iwamoto, M. Kasuga, T. Hanafusa, M. Haneda and K. Ueki, “Report of the Committee on the Classification and Diagnostic Criteria of Diabetes Mellitus,” Diabetology International, Vol. No. 1, 2010, pp. 2-20.
- Translation Supervisor by Y. Ikeda, “Life with Diabetes, Diabetes Class Perfect Guide,” Ishiyaku Shuppan, Tokyo, 2001, p. 60.
- Japan Diabetes Society, “Food Exchange Lists Dietary Guidance for Persons with Diabetes,” Bunkodo Co., Ltd., Tokyo, 2008.
- R. S. Beaser, Staff of the Joslin Diabetes Center, Planning Meals, “Joslin’s Diabetes Deskbook. A Guide for Primary Care Providers,” 2nd Edition Joslin’s Diabetes Center, 2007.
- Japan Diabetes Society, “Guidance of Instruction in Dietary Therapy for Diabetes,” 2nd Edition, Bunkodo Co., Ltd, Tokyo, 2004, pp. 13-16.
- Japan Diabetes Society, “Treatment Guide for Diabetes,” Bunkodo, Tokyo, 2012, pp. 43-45.
- T. Shiraishi and A. Kawata, “Instruction Manual for Fatness and Obesity,” 2nd Edition, Ishiyaku Shuppan, Tokyo, 2001, pp. 29-45.
- Y. Atusmi and K. Koide, “Make Use of SMBG,” Nakayama Shoten, Tokyo, 2011, pp. 125.
- L. M. Welschen, E. Bloemendal, G. Nijpels, J. M. Dekker, R. J. Heine, W. A. Stalman and L. M. Bouter, “SelfMonitoring of Blood Glucose in Patients with Type 2 Diabetes Who Are Not Using Insulin,” Diabetes Care, Vol. 28, No. 6, 2005, pp. 1510-1517. doi:10.2337/diacare.28.6.1510
NOTES
*Corresponding author.