Food and Nutrition Sciences
Vol. 3 No. 7 (2012) , Article ID: 20480 , 8 pages DOI:10.4236/fns.2012.37118
Potential Use of Selected Sweetpotato (Ipomea batatas Lam) Varieties as Defined by Chemical and Flour Pasting Characteristics
![]()
1Department of Food Technology and Nutrition, Makerere University, Kampala, Uganda; 2Department of Chemistry, Biotechnology and Food Science, Norwegian University of Life Sciences, Aas, Norway.
Email: agnesnabubuya@yahoo.co.uk
Received April 12th, 2012; revised May 12th, 2012; accepted May 19th, 2012
Keywords: Sweetpotato; Chemical Properties; Pasting Characteristics
ABSTRACT
Chemical and functional properties of ten sweetpotato varieties were investigated. The sweetpotato were of various flesh colours which included orange, yellow, cream and white with dry matter content ranging from 30.2% - 39.2%. The sweetpotato varieties varied significantly (p < 0.05) in total amylase activity, total starch and amylose content whose value ranges were 0.256 - 0.570 mg/ml/min, 68.4% - 73.6%, 16.2% - 23.4% respectively. The pH of flours from the different sweetpotato varieties ranged from 6.01 - 6.64. The pasting behaviours of the sweetpotato flours also showed significant differences (p < 0.05) in the individual parameters (peak time, pasting temperature, peak viscosity, trough viscosity, final viscosity, breakdown and setback) among the different varieties. The results revealed the influence of variety on the chemical composition of sweetpotato and their pasting properties. Correlations were also revealed among different components of the sweetpotatoes which would be a basis in selection of the varieties for processing into different products.
1. Introduction
Sweetpotato (Ipomoea batatas Lam) is globally the sixth most important food crop with over 105 million metric tons produced annually [1]. Developing countries produce about 95% of the global sweetpotato. It is grown mainly in the tropics but has the ability to adapt to a wide range of climatic conditions [2]. Uganda is one of the countries with the highest annual per capita sweetpotato consumption in Africa [1]. There are several sweetpotato varieties in Uganda with different skin and flesh colours. On harvest, sweetpotato roots are stored mainly in rooms (in sacks) and in pits [3,4]. The pit is reported to be effective for at least 4 months and its use is constrained by rodents and rotting [3]. Sweetpotato can be used in various ways; boiled, steamed, baked, fried and also have the potential to be processed into various products [5]. In the developing world, they are most commonly consumed following boiling, steaming, roasting or drying [4]. Sweetpotatoes in sub-Saharan Africa are cultivated on subsistence rather than commercial scale due to lack of appropriate technologies for their utilization in food product development [6].
Sweetpotatoes have a number of physicochemical properties. They consist mainly of carbohydrates (80% to 90% of the dry weight of the roots), with starch being the most abundant component of the roots’ dry matter forming 50% - 80% [2]. The amylose/amylopectin ratio of sweetpotato starch influences the physicochemical properties of sweetpotato flour such as gelatinization, retrogradation, water absorption and pasting viscosities [7,8]. Sweetpotato contains endogenous amylolytic enzymes with the three major ones being α-amylase, β-amylase and starch phosphorylase [9]. These enzymes are important for the breakdown of starch into simpler sugars during storage and processing [10]. The presence of amylases in sweetpotato roots influences their utilization, especially in the food industry, due to the hydrolytic effect of the enzymes on sweetpotato starch which also affects the properties of the sweetpotato products. For industrial use of sweetpotatoes, there is need to have knowledge of their physicochemical properties and the effect that the different processing methods have on these properties and functionality of the different components.
Although significant varietal differences have been documented in sweetpotato physicochemical properties [6,11] there is need to assess the amylase activities of the different sweetpotato varieties and evaluate their relationship with the flour characteristics and products which can possibly be processed from them. Sweetpotatoes have great potential for utilization in the food industry for the production of a number of commercial products especially considering the fact that their starch content is high [2]. It is therefore important to get an understanding of the functional properties of the different sweetpotato varieties in order to ascertain the appropriate uses of the sweetpotatoes in food processing. The study was aimed at characterizing selected Ugandan sweetpotato varieties to determine their suitability for processing to specific products. Carbohydrate and pasting properties, and total amyloytic activities served as bench marks for the assessment.
2. Materials and Methods
2.1. Sweetpotatoes Materials
Table 1 shows the ten varieties of sweetpotato which were used in this study. The sweetpotatoes were grown in three replicates on an experimental plot in Luwero District in Central Uganda and were harvested at their physiological maturity ages (counted in months from the planting date).
2.2. Reagents
All reagents used for analysis in this study were of analytical grade and were obtained from Megazyme International Ireland Ltd., Bray, C. Wicklow and Sigma-Aldrich Chemical Company.
2.3. Sample Preparation for Laboratory Analysis
Four roots from each variety per replicate weighing 180 - 200 g were randomly selected for use in the study. The sweetpotato roots were kept at ambient conditions and analyses were done on the day of harvest. The sweetpotatoes were washed under running water, air dried, peeled, halved longitudinally and uniformly grated all the way to obtain the pulp. Grated tissue from the sweetpotato roots was combined, mixed thoroughly and used in the study. Flour for sugar analysis was prepared by freeze drying grated tissue for 24 hours and milling it, while flour for pasting properties was prepared by oven drying grated sweetpotato at 45˚C for 16 hours and milling. The flours were then kept in air tight containers.
2.3.1. Dry Matter Content and pH
The dry matter content of the sweetpotato roots was determined using the oven method (Gallenkamp, UK) by drying 2 g of fresh sweetpotato sample at 100ºC overnight following standard procedures [12]. pH of the sweetpotato flour was determined using a pH meter (PHM 92, Radiometer, Copenhagen Denmark) after standardizing with buffer solutions of pH 4 and 7.
2.3.2. Total Amylase Activity
The enzyme was extracted by homogenizing 100 g of grated sweetpotato sample in a Waring blender with 300 ml of cold extraction buffer; consisting of 20 mM Sodium phosphate (pH 6.0), 0.3% sodium chloride, 0.2% Calcium chloride and 0.001% Mercaptoethanol. The extract was centrifuged at 13,000 × g for 10 minutes and the supernatant removed and used for the assay. Total amylase activity was determined using the Dinitrosalycylic acid (DNSA) [13]. Exactly 0.5 ml of the supernatant were pre-incubated for 10 minutes at 40˚C before being further incubated with 0.5 ml of Soluble starch solution (1%) in Na-acetate buffer (pH 6.0) containing 5 mM CaCl2 and 0.04% NaCl for 10 minutes at 40˚C. The reaction was stopped by the addition of 1.0 ml DNSA reagent (1 g of 3, 5 dinitrosalycylic acid with 20 ml of 2 N NaOH and 30 g NaK-tartrate made up to 100 ml with distilled water). Test tubes were then placed in a boiling water bath for 5 minutes and cooled in an ice bath thereafter.
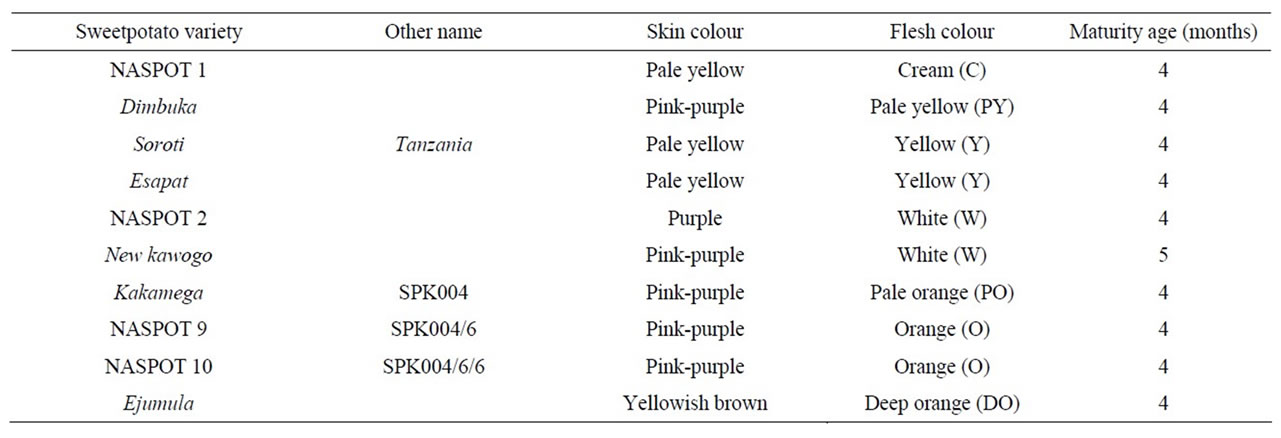
Table 1. Sweetpotato varieties.
Distilled water (8 ml) was added into the reaction tubes and the optical density was measured using a spectrophotometer at 540 nm. A standard curve was prepared using maltose solution of varying concentrations (0 to 2.0 mg/ml) and used in computing maltose equivalents.
2.3.3. Sugar Analysis
The method used to analyze for the sugars was a modification of that described by Knudsen [14]. Samples of 1.0 g were extracted with Ethanol-MilliQ water (1:3 v/v) for 24 hours during which the extract was mixed using an electric mixer for 30 minutes. The extract was centrifuged at 2200 × g for 30 minutes before 2 ml of an internal standard (arabinose, 1 mg/ml) was added to 4 ml of the extract. The extract was purified using C18 cartridges (Water Corporation, Milford, Massachusetts, USA), which had been washed with 2 ml of methanol and 5 ml of MilliQ water. It was further filtered through a 0.2 μm filter (Pall Life Sciences, 600 South Wagner Rd, USA), taken to dry under vacuum at 50˚C (Vortex-Evaporator, H. Haake Buchler Product, Saddle, NJ, USA) and 20 μl used to determine the concentration of sucrose, maltose, glucose, fructose and galactose using HPLC. The HPLC system used consisted of a series 410 delivery pump, series 200 refractive index detector, series 200 injector valve (Burnsville, MN 55337, USA) and a Aminex HPX- 87H, 300 × 7.8 mm id column. Water was used as the mobile phase, with flow rate 0.4 ml/ml. External standard solutions of sucrose, maltose, glucose, fructose and galactose (Sigma chemical Co.) were used for calibration, identification and quantification of the respective sugars.
2.3.4. Total Starch Determination
The total starch content of the sweetpotato flours was determined using the amylogluco-sidase/alpha-amylase method [15] which involved two phases; partial hydrolysis followed by solubilization of starch by α-amylase and quantitative hydrolysis of dextrins to glucose by amyloglucosidase. The sweetpotato flour (100 mg) was dispersed by 0.2 ml of 80% ethanol and immediately 3 ml of thermostable α-amylase mixed with 100 mM sodium acetate buffer (pH 5.0) 1:30 was added and heated in a boiling water bath for 6 minutes. It was then placed in a water bath at 50˚C and 0.1 ml of amyloglucosidase added then incubated for 30 minutes. Three ml of glucose determination reagent (GOPOD-containing GOPOD reagent buffer and GOPOD reagent enzymes) was added to 0.1 ml of supernatant after centrifuging at 3000 × g for 10 minutes. The above mixture was then incubated at 50˚C for 20 minutes and the absorbance read at 510 nm against a reagent blank together with D-glucose controls.
2.3.5. Amylose Content Determination
The amylose content of the starch in the sweetpotato flour was analyzed with an amylose/amylopectin assay kit based on the concanavalin A method [16]. Starch was completely dispersed by heating in 1 ml of dimethyl sulphoxide (DMSO); lipids were removed by precipitating the starch in ethanol (95%). Amylopectin was specifically precipitated by addition of concanavalin A and removed by centrifugation. The amylose was hydrolyzed to D-glucose which was analyzed using glucose oxidase/ peroxidase reagent (GOPOD). Total starch was also hydrolyzed to D-glucose and measured by oxidase/peroxidase. The concentration of amylose was estimated as a ratio of GOPOD absorbance at 510 nm of the Con A precipitated sample to that of the total starch sample.
2.3.6. Flour Pasting Properties
A rapid viscoanalyzer (RVA, model 4, Newport Scientific, Warriewood, Australia) with Thermocline software was used to evaluate the pasting properties of sweetpotato flour. The RVA was connected to a computer where the pasting properties and curves were recorded directly. The tests were conducted following standard pasting profile, standard 1, included in the instrument software. Sweetpotato flour, 3.5 g in 25 ml of water at 14% moisture content was subjected to a controlled heating and cooling system under constant shear in the RVA. The time-temperature regime of the equipment was as follows: the slurry was stirred at 960 rpm at 50˚C for 1 min; then increased from 50˚C to 95˚C in 4 min at which it was held for 3 min and subsequently cooled to 50˚C in 4 min. This was followed by a period of 1 min where the temperature was kept at 50˚C. The flour pasting test process lasted for 13 min. The RVA parameters measured included maximum hot paste/peak viscosity (PV), time at which peak viscosity was reached, holding strength (viscosity at the trough), final viscosity (FV), breakdown (BD, calculated as PV-Trough), setback (calculated as FV-Trough) and pasting temperature (The temperature at which viscosity increased). The viscosity was expressed in Centipoises (cP).
2.4. Statistical Analysis
The data was analyzed by one-way analysis of variance (ANOVA). Differences in means were compared using Fishers least significant difference (LSD) and correlations were determined by Pearson product-moment correlation coefficient tests. The statistical analyses were performed using the Statistical Package for Social Scientists (SPSS for windows version 15.0). A significant level of P < 0.05 was used. All analyses were done in triplicate except for sugars. Principal component analysis was performed on the means of the chemical and flour pasting properties of the sweetpotato variety using Unscrambler edition 10.1.
3. Results and Discussion
3.1. Chemical Properties
Table 2 shows the dry matter content of the studied sweetpotato varieties. It ranged from 30.2% in Dimbuka to 39.2% in Esapat and varied among sweetpotato varieties. Sweetpotato dry matter values in these ranges have been reported in literature [6,17] and variations has been shown to be related to variety, soil type and cultivation practices in the different areas [2]. The sweetpotato varieties studied also varied significantly in total amylase activity which ranged from 0.256 mg/ml/min (Soroti) to 0.570 mg/ml/min (Ejumula) as shown in Table 2. Orange-fleshed varieties had higher total amylase activity levels than the other varieties. Varietal variation has been reported in amylase activity among sweetpotato [11,18].
The total starch content of flours from the sweetpotato varieties ranged from 68.4% (Ejumula) to 73.9% (Esapat) as shown in Table 2. Generally, the starch content of flours from orange-fleshed varieties was lower than that in the white and yellow-fleshed varieties. A significant negative correlation was observed between total starch content and total amylase activity (r = –0.881, p < 0.05) implying that varieties with high amylase activity had low total starch content. This could be attributed to the hydrolytic effect of amylases on starch (especially α- amylase). The starch content of a food material affects certain properties like swelling, gelatinization, pasting and suitability for processing that food material [19]. Other properties of starch, including; granule shape, size and structure also affect the qualities of food products [5] but were not assessed in this study. Table 2 shows the amylose content of flours from the sweetpotatoes varieties which varied significantly (p < 0.05) among the varieties with values ranging from 16.2% (Esapat) to 23.4% (NASPOT 9). Most of the sweetpotato varieties used in this study had amylose content below 20%. Orange-fleshed varieties had higher amylose content than the other varieties. There was a significant positive correlation (r = 0.564, p < 0.05) between amylose content and total amylase activity of the flours from the sweetpotato varieties. The amylose portion of starch affects the swelling and hot-paste (peak) viscosities of a food material. It has been reported that increase in amylose content in the starch granules leads to more restricted swelling and hence reduced peak viscosity of the paste [20,21].
Table 3 shows varietal differences in the sugar content and profiles of the sweetpotatoes used in this study. New kawogo had the highest total sugar content (16.1%) while Dimbuka had the lowest (6.52%). Sucrose was the major sugar in all the sweetpotato varieties with values ranging from 5.79% (Dimbuka) to 14.42% in New kawogo. Glucose, maltose and fructose were generally next to sucrose in concentration in all the ten sweetpotato varieties with values ranging from 0.15% - 1.37%, 0.28% - 0.44% and 0.21% - 1.10% respectively as shown in Table 3. NASPOT 10 had the highest levels of glucose, maltose and fructose while Dimbuka had the lowest glucose and fructose content and NASPOT 9 contained the lowest amount of maltose. Galactose was found in minimal amounts with values ranging from 0.015% - 0.082%. Highest concentrations of galactose were observed in NASPOT 10 and Kakamega varieties (0.082% and 0.072%) respectively and very low concentrations were detected in NASPOT 2 and Dimbuka (0.015% and 0.027%) respectively. The differences in sugar quantities observed between results from this study and the other results in
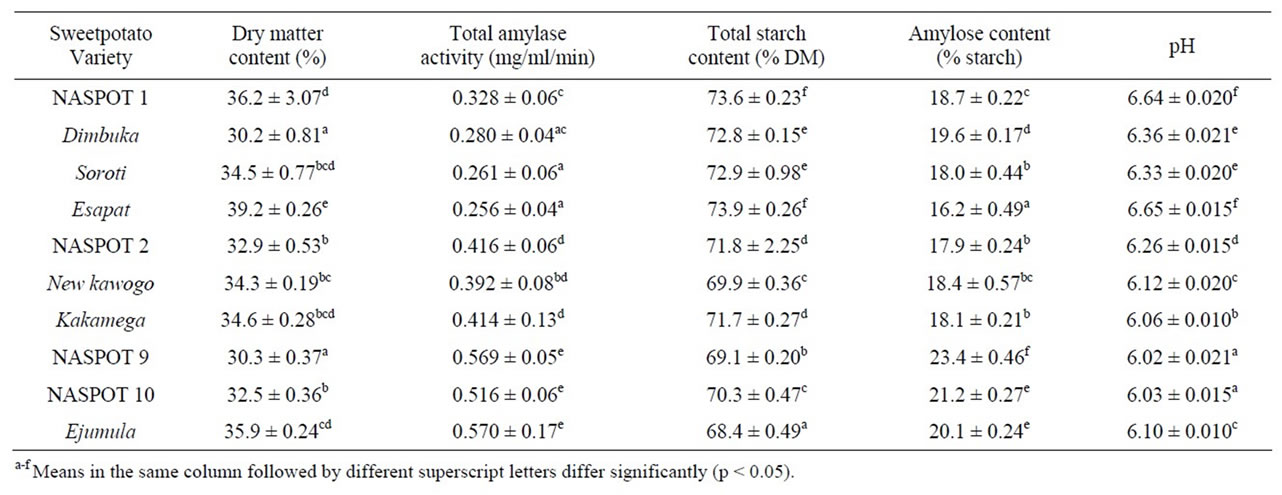
Table 2. Selected chemical characteristics of sweetpotato varieties.
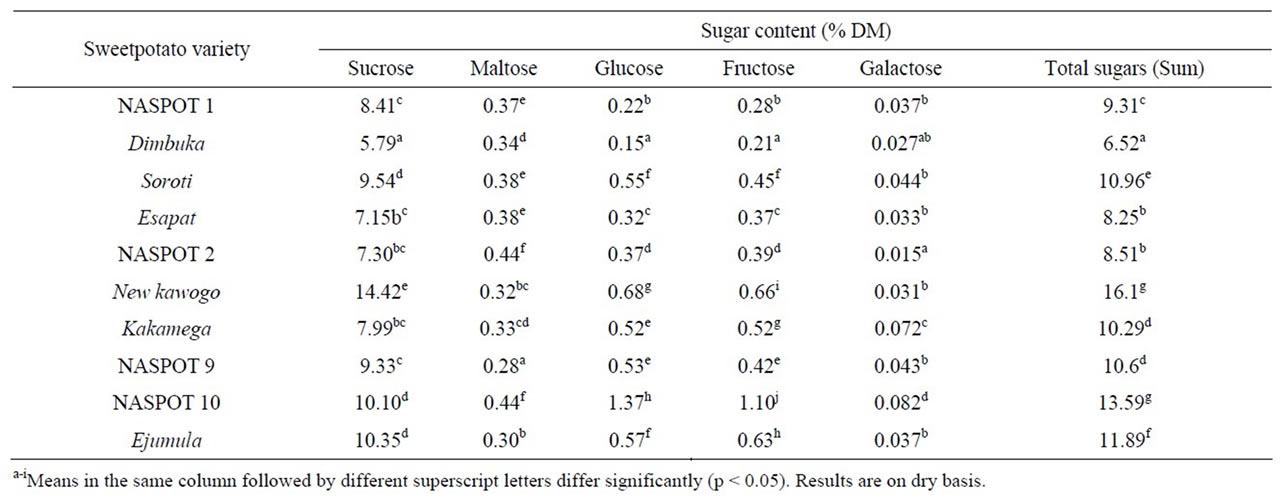
Table 3. Sugar content and profiles of sweetpotato varieties.
literature could be due to differences in varieties, endogenous amylase activity and environmental conditions [22].
The pH of the sweetpotato flours ranged from 6.02 (NASPOT 9) to 6.64 (NASPOT 1). Generally, orangefleshed varieties had lower pH values than the white, yellow and cream fleshed varieties as shown in Table 2. Sweetpotato varieties with high total amylase activity values generally had lower pH. High pH has been reported to increase solubility of starch in flour by increasing the hydrophilic character of the starch in the flour hence having an effect on its functionality [23,24].
3.2. Pasting Properties of Sweetpotato Flours
The RVA pasting properties of sweetpotato flours from the ten varieties are presented in Table 4. The pasting behaviors of flours from all the sweetpotato varieties were of type A indicated by high pasting peaks and rapid thinning. The pasting temperature (the temperature at which measurable viscosity is detected) ranged from 70.4˚C (NASPOT 10) to 84.2˚C (New kawogo) and varied among the sweetpotato varieties. White and yellowfleshed varieties had higher pasting temperatures than the other varieties. Pasting temperature is one of the properties which provides information of estimated minimum cooking time for a particular food material and the energy costs that may be involved [21,25]. High pasting temperatures have been associated with higher amylose content and high resistance towards swelling [25], although these results showed no correlation between pasting temperature and amylose content of the sweetpotato flours. The peak viscosity (maximum viscosity attained during the heating cycle) shows the ability of the starch granules in the flour to swell freely before they are physically broken down [25]. The peak viscosity (PV) ranged from 826 to 3039 cP in NASPOT 9 and Dimbuka respectively and varied significantly among sweetpotato varieties with cream-fleshed varieties having higher values than the other varieties. The peak viscosity of flours is reported to correlate negatively with the amylose content of the starch in flours. Amylose affects the swelling capacity of starch by restricting it and hence lowering the peak viscosity [21]. There was however no statistically significant correlation (r = 0.18, p > 0.05) between the amylose content and the peak viscosities of the sweetpotato flours used in this study, although it was generally observed that flours with high amylose content also showed low peak viscosities (Figure 1). The peak time, which is the time required to attain peak viscosity, ranged from 3.8 to 4.5 min as shown in Table 4. Peak time is associated with the rate of absorption of water by swelling starch granules and hence their swelling [26].
Trough viscosity (hot paste viscosity) is the viscosity that develops after holding the paste at 95˚C and it measures the ability of the paste to withstand breakdown during cooling [25]. In Table 4, the trough viscosity values ranged from 117 to 1064 cP. Breakdown viscosity is the viscosity difference between the peak viscosity and the trough viscosity and occurs as a result of holding slurries at high temperature and mechanical shear stress which leads to further disruption of the swollen starch granules resulting in leaching of amylose into the solution [6,26]. Breakdown viscosity varied among flours from the different sweetpotato varieties and ranged from 602 to 2072 cP in New kawogo and Dimbuka varieties respectively. A significant positive correlation (r = 0.971, p < 0.05) was observed between peak viscosity and breakdown implying that flours with high peak viscosity values most probably have high breakdown hence low ability to withstand heat and shear stress during cooking and leading to
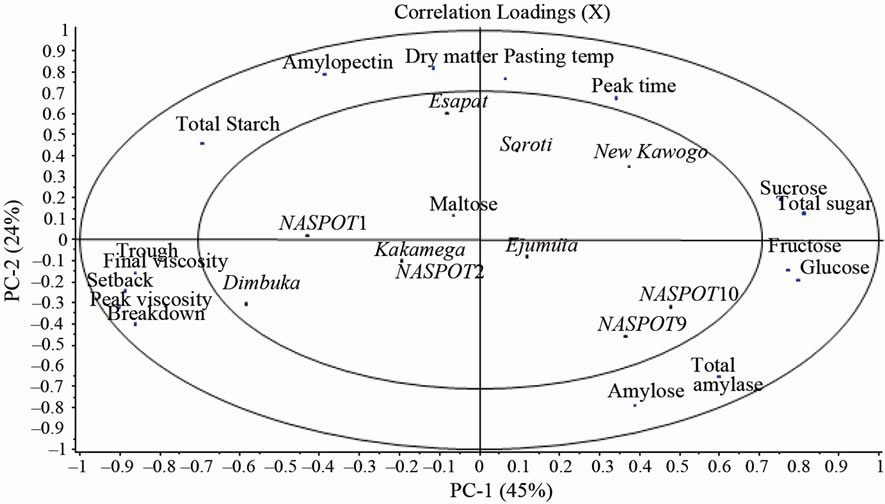
Figure 1. Score and loadings plots from PCA of chemical and flour pasting properties of ten sweetpotato varieties.
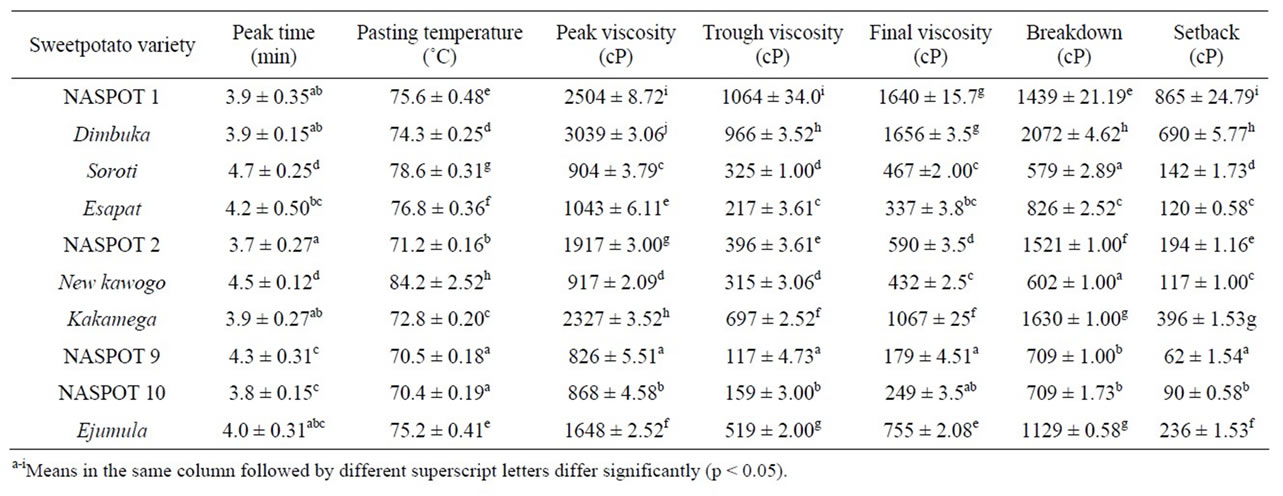
Table 4. Pasting properties of flours from ten sweetpotato varieties.
weak gels [6,19,25]. The trends observed in this study are in line with those published in literature. Final viscosity (cold paste viscosity) is the change in viscosity after cooling cooked starch to 50˚C. Its values ranged from 179 to 1656 cP in NASPOT 9 and Dimbuka respectively. There were significant variations (p < 0.05) in final viscosity among the studied sweetpotato varieties. The final viscosity values of flours from all the sweetpotato varieties were lower than their corresponding peak viscosities. These results are in line with results in literature which showed some varieties having final viscosities lower than their peak viscosities [22]. Other literature has shown final viscosity values of pure sweetpotato starch as being higher than the peak viscosity [6]. Final viscosity is obtained during the cooling process of a paste and is attributed to the re-association between starch molecules especially amylose leading to increase in viscosity which results in the formation of a gel [26]. This phase is related to retrogradation and reordering of starch molecules [6]. The setback values for the flours of the sweetpotato varieties used in this study varied from 62 to 865 cP as shown in Table 4 and the values varied significantly (p < 0.05) among sweetpotato varieties. NASPOT 9 and NASPOT 10 had the lowest values. There was a positive correlation (r = 0.969, p < 0.05) between setback and final viscosity.
3.3. Implications of Variation in Sweetpotato Chemical and Flour Pasting Properties on Product Properties
The plots of scores and loadings for the Principal component analysis (PCA) of the sweetpotato chemical and flour pasting properties are shown in Figure 1. The first two components in the PCA accounted for 45% and 24%respectively (in total 69%) of the variation among samples. Sweetpotato varieties NASPOT 1 and Dimbuka were characterized by high total starch, low total amylase activity, low amylose and low sugar content. Their flours were characterized by high pasting viscosities as shown in Figure 1. High total starch content is negatively correlated to total amylase activity and high sugar content. NASPOT 1 together with Soroti and Esapat had high dry matter content as depicted in Table 1. Sweetpotato varieties with high dry matter content, low sugar content and high starch content are generally recommended for frying, roasting and baking. The peak viscosity often gives an indication of suitable use of a particular food material in processing. Flours from Dimbuka, NASPOT 1 and Kakamega with high peak viscosities would be suitable for products requiring high gel strength and elasticity [25] and may also be suitable for baking where final product volume determines product quality. Setback viscosity is useful in defining the quality of starch contained in a food material [25]. High setback values of food materials are associated with high retrogradation and syneresis in products made from those materials [6]. Such materials are not suitable for products where retrogradation may cause syneresis for example pie fillings.
NASPOT 9, NASPOT 10 and Ejumula varieties were characterized by high total amylase activity and high amylose content as shown in Figure 1. Together with New kawogo, flours from these varieties also had high total sugar content. Amylases are responsible for the hydrolysis of starch into simpler sugars during storage and processing [10]. The presence of high amylase activity levels in sweetpotato varieties influences their utilization especially in the food industry due the hydrolytic effect of the amylases on sweetpotato starch which leads to increased reducing sugar content and reduced paste viscosities and in turn affects the properties of the sweetpotato products. The presence of high sugar content in a food material influences the color, texture and other properties of products from that food material [19]. High sugar content has also been implicated in reducing the swelling ability of starch in flour by competing with starch for available water in a flour-water mixture [27]. Reducing sugars in particular are linked to alteration of sweetpotato utilization due to their effect on the color and texture of sweetpotato products [22]. Reducing sugars form brown pigments (Maillard reaction) with amino acids in the sweetpotato during use of some processing technologies like frying [28]. Varieties with high sugar content especially reducing sugars can be used for French fries only if lower prefrying temperatures (<175˚C - 185˚C) are to be used [29]. The flours from NASPOT 9, NASPOT 10, New kawogo and Soroti were characterized by low viscosities during pasting. New kawogo and Soroti also showed high pasting temperatures, which suggests that these varieties may require longer processing time. Generally, flours with low viscosities may not be used in the baking industry or in making products which require high gel strength.
4. Conclusion
The diversity in composition; chemical and functional properties of flours from the different sweetpotato varieties indicate possible variations in the suitability of processing of these varieties hence yielding products with different characteristics. This study facilitated the grouping of the sweetpotato varieties into two main groups; high starch and low starch containing varieties. The former consisted mainly of the white, cream and yellowfleshed varieties while the later consisted of the orangefleshed varieties. The study also showed the other properties associated with the two groups of sweetpotato varieties. The high starch varieties also had flours with high pasting viscosities as shown by RVA results, while the low starch varieties contained high amylase activities, high sugar content and low pasting viscosities. Sweetpotato varieties high in starch content can be used in the confectionary industry to make buns, bread and cakes. They can also be used as stabilizers in the ice-cream industry and for making glucose and fructose syrups. The low starch containing varieties can among other things be used for making energy dense purees due to the high amylase activity they contain. These results will therefore be useful in showing possibilities of using sweetpotatoes diversely in the food processing industry.
5. Acknowledgements
The authors are grateful to the Norwegian Programme for Development, Research and Education (NUFU) for facilitating this research financially through the Norwegian University of Life Sciences and Makerere University in Uganda.
REFERENCES
- FAO Statistical Yearbook, “Notes/Annuaire Statistique de la FAO 2009,” 2010. http:faostat.fao.org
- J. A. Woolfe, “Sweet Potato—Past and Present,” In: J. A. Woolfe, Ed., Sweet Potato: An Untapped Food Resource, Cambridge University Press, Cambridge, 1992, pp. 15-40.
- P. J. Engoru, J. Mugisha and B. Bashasha, “Tuber Utilisation Options among Sweetpotato Producers in Eastern Uganda,” African Crop Science Conference, Uganda, 2005.
- S. Nagujja and D. Yanggen, “Postharvest Utilisation of Sweetpotato and Implications for Reducing Incidence of Vitamin A Deficiency in Uganda,” African Crop Science Conference, Uganda, 2005.
- S. Tian, J. E. Rickard and J. M. V. Blanshard, “Physicochemical Properties of Sweetpotato Starch,” Journal of the Science of Food and Agriculture, Vol. 57, No. 4, 1991, pp. 459-491. doi:10.1002/jsfa.2740570402
- M. Tsakama, A. M. Mwangwela, T. A. Manani and N. M. Mahunga, “Physicochemical and Pasting Properties of Starch Extracted from Eleven Sweetpotato Varieties,” African Journal of Food Science and Technology, Vol. 1, No. 4, 2010, pp. 090-098.
- L. S. C. H. Collado, “Heat-Moisture Treatment Effects on Sweetpotato Starches Differing in Amylose Content,” Food Chemistry, Vol. 65, No. 3, 1999, pp. 339-346. doi:10.1016/S0308-8146(98)00228-3
- C. K. Black, J. F. Panozzo, C. L. Wright and P. C. Lim, “Survey of White Salted Noodle Quality Characteristics in Wheat Landraces,” Cereal Chemistry, Vol. 77, No. 4, 2000, pp. 468-472. doi:10.1094/CCHEM.2000.77.4.468
- V. L. P. Hagenimana, L. P. Vezina and R. E. Simard, “Distribution of Amylases within Sweetpotato (Ipomoea batatas) Root Tissues,” Journal of Agriculture and Food Chemistry, Vol. 40, No. 10, 1992, pp. 1777-1783. doi:10.1021/jf00022a010
- W. M. Walter, “Changes in Amyloid Carbohydrates during Preparation of Sweetpotato Flakes,” Journal of Food Science, Vol. 41, 1976, p. 1374. doi:10.1111/j.1365-2621.1976.tb01175.x
- A. Nandutu, J. Carasco and V. Hagenimana, “Using Sweetpotato Amylase Extracts for the Determination of Starch in Foodstuffs,” Journal of Food Technology in Africa, Vol. 5, No. 2, 2000, pp. 66-68.
- AOAC, “Official Method of Analysis for Dry Matter,” Arlington, 2007.
- P. Bernfeld, “Amylases, α- and β,” In: S. P. Colowick and N. O. Kaplan, Eds., Methods in Enzymology, Academic Press, New York, 1955, pp. 149-158. doi:10.1016/0076-6879(55)01021-5
- K. E. B. Knudsen, “Carbohydrate and Lignin Contents of Plant Materials Used in Animal Feeding,” Animal Feed Science and Technology, Vol. 67, No. 4, 1997, pp. 319- 338. doi:10.1016/S0377-8401(97)00009-6
- B. V. McCleary and D. A. Monaghan, “Measurement of Resistant Starch,” Journal of AOAC International, Vol. 85, No. 5, 2002, pp. 665-675.
- S. H. Yun and N. K. Matheson, “Estimation of Amylose Content of Starches after Precipitation of Amylopectin by Concanavalin-A,” Starch/Starke, Vol. 42, No. 8, 1990, pp. 302-305. doi.org/10.1002/star.19900420805
- A. A. Bengtsson, A. Namutebi, M. L. Alminger and U. Svanberg, “Effects of Various Traditional Processing Methods on the All-Trans-β-Carotene Content of OrangeFleshed Sweetpotato,” Journal of Food Composition and Analysis, Vol. 21, No. 2, 2008, pp. 134-143. doi:10.1016/j.jfca.2007.09.006
- T. A. Marrision, R. Pressey and S. J. Kays, “Changes in Alpha-Beta Amylases during Storage of Sweetpotato Lines with Varying Starch Hydrolysis,” Journal of American Society of Horticultural Sciences, Vol. 118, No. 2, 1993, pp. 236-242.
- J. G. Waramboi, S. Dennien, M. J. Gidley and P. A. Sopade, “Characterization of Sweetpotato from Papua New Guinea and Australia: Physicochemical, Pasting and Gelatinisation Properties,” Food Chemistry, Vol. 126, No. 4, 2010, pp. 1759-1770. doi:10.1016/j.foodchem.2010.12.077
- R. F. Tester and J. Karkalas, “Swelling and Gelatinization of Oat Starches,” Cereal Chemistry, Vol. 73, No. 2, 1996, pp. 271-273.
- E. Shimelis, M. Meaza and M. Rakshit, “Physicochemical Properties, Pasting Behaviour and Functional Characteristics of Flour and Starches from Improved Bean (Phaseolus vulgaris L.) Varieties in East Africa,” International Journal of Agricultural Engineering, Vol. 8, 2006, pp. 1- 18.
- A. J. Aina, K. O. Falade, J. O. Akingbala and P. Titus, “Physicochemical Properties of Twenty-One Caribbean Sweetpotato Cultivars,” International Journal of Food Science and Technology, Vol. 44, No. 9, 2009, pp. 1696- 1704. doi:10.1111/j.1365-2621.2009.01941.x
- O. A. Kayode, I. Bamidele, Olu-Owolab, O. Olufunmi, Olayinkaa and S. L. Olayide, “Effect of Heat Moisture Treatment and Annealing on Physicochemical Properties of Red Sorghum Starch,” African Journal of Biotechnology, Vol. 4, No. 9, 2005, pp. 928-933.
- Z. Chen, H. Schols and A. Voragen, “Physicochemical Properties of Starches Obtained from Three Varieties of Chinese Sweetpotatoes,” Journal of Food Science, Vol. 68, No. 2, 2003, pp. 431-437. doi:10.1111/j.1365-2621.2003.tb05690.x
- O. J. Ikegwu and P. E. Okechukwu, “Physicochemical and Pasting Characteristics of Flours and Starch from Achi Brachystegia eurtcoma Seed,” Journal of Food Technology, Vol. 8, No. 2, 2010, pp. 58-66. doi:10.3923/jftech.2010.58.66
- R. M. Sanaa, M. El-Sayed and Abdel-Aal, “Pasting Properties of Starch and Protein in Selected Cereal and of Their Food Products,” Journal of Food Chemistry, Vol. 95, No. 1, 2006, pp. 9-18. doi:0.1016/j.foodchem.2004.12.012
- C. G. Biliaderis, “The Structure and Interaction of Starch with Food Constituents,” Canadian Journal of Physiology Pharmacology, Vol. 69, No. 1, 1991, pp. 60-78. doi:10.1139/y91-011
- W. M. Walter and M. W. Hoover, “The Effect of PreProcessing Storage Conditions on Composition, Microstructure and Acceptance of Sweetpotato Patties,” Journal of Food Science, Vol. 49, No. 5, 1984, p. 1258. doi:10.1111/j.1365-2621.1984.tb14965.x
- C. J. O’Connor, C. J. Fisk, B. G. Smith and L. D. Melton, “Fat Uptake in French Fries as Affected by Different Potato Varieties and Processing,” Journal of Food Science, Vol. 66, No. 6, 2001, pp. 903-908. doi:10.1111/j.1365-2621.2001.tb15194.x