Food and Nutrition Sciences
Vol. 3 No. 3 (2012) , Article ID: 17957 , 6 pages DOI:10.4236/fns.2012.33043
A Simple Approach Assessing the Vegetable Content of Asian Takeout Meals with Nutrition Education Potential
![]()
Curtin University, Perth, Australia.
Email: C.Pollard@curtin.edu.au
Received November 10th, 2011; revised January 16th, 2012; accepted January 23rd, 2012
Keywords: Take-Away Food; Vegetables; Menu Items
ABSTRACT
A demand for convenient eating options has led to an increase in foods eaten away from home, and consumers are looking for healthy options when they eat out. Increasing vegetable consumption is a key public health nutrition priority. Although Asian menu items are considered a healthy option, there is little information about their relative healthfulness. This study aims to pilot a simple method for measuring the vegetable content of popular Asian dishes for use in nutrition education. Thirty vegetable containing take-out dishes from three Asian restaurants (Chinese, Thai and Singaporean) in Perth, Western Australia were photographed and weighted with, and without the vegetables. Standard 75 gram vegetable servings per dish and the average vegetable content between cuisines were compared. The mean vegetables servings per dish was 1.8 (0.25 to 5.5) with no statistical difference between cuisines (p > 0.05). The variety and amount of vegetables in individual dishes varied within each cuisine. Vegetarian dishes had the highest vegetable content and noodle and rice dishes the lowest (0.23 - 0.75 servings/dish). Digital imagery clearly, simply and quickly displayed the vegetable content of Asian dishes. The Asian take-out dishes were low in vegetables. Nutrition educators should encourage Asian food businesses to increase the vegetable content of their menus and advise customers to choose at least one vegetarian dish.
1. Introduction
A demand for convenient eating options has led to an increase in “take-away” food sales, that is, food sold for consumption off the premises [1]. In Australia, purchases from cafes and restaurants showed an annual income growth of 18% per year between 2003 and 2007 [1,2]. The industry contributed equivalent to 0.4% of Australia’s gross domestic product in 2007, of which take-away food represented 6.7% of sales [1].
For many Australians, a significant proportion of their energy intake comes from foods prepared outside the home, from 13% up to 60% for some [3,4]. Dietary guidelines recommend increasing consumption of fruits and vegetables to protect against chronic disease, such as diabetes and cancer, and maintenance of a healthy weight [5-8]. The national Go for 2&5® campaign encourages Australian adults to eat more vegetables [9]. Vegetable intake is less than recommended across all age groups both genders in Australia [10]. Most adults consume well below the recommended five 75 gram standard servings per day [11,12].
Poor diet quality, particularly low vegetable intake, has been associated with a higher consumption of takeaway foods [13-16]. Healthier take-away options, those lower in total and unsaturated fat and/or calories (kilojoules) and salt and higher in vegetables, have been recommended [15]. Increasing the proportion of vegetables on the menu may lead to improvements in diet quality [17]. Asian migration to Australia has dramatically increased the availability of Asian foods in the Australian market since the 1980s [18]. The hospitality sector therefore is an emerging priority target audience for initiatives promoting vegetable intake.
Australian hospitality industry data suggest that about 40% of restaurants are Asian and that young adults, 18 - 24 years, are eating out at ethnic restaurants about five times a month on average [19]. Asian foods are generally considered healthy, wholesome foods and a good sources of vegetables [20,21]. Consumer perception varies about the relative healthfulness of different cuisines Hwang and Lin (2009) found Chinese, Japanese, Korean, and Thai was identified as healthy whereas Jang et al. (2009) found only Japanese, Thai and Vietnamese foods were considered healthy, and health was not a key attribute of Chinese, Indian and Korean foods [21].
The limited information about the nutrient content or ingredients in prepared meals has led to the legislation to display calorie content on New York menus [22]. Recipe criteria have been developed to assist food industry to include adequate amounts of fruit and vegetables when preparing recipes [23]. The purpose of the study was to firstly, measure the vegetable content of popular takeaway Asian dishes and secondly, to use this information to inform the development of nutrition education strategies to encourage the food service industry to provide and promote more healthful food choices to assist the general public to increase their vegetable consumption when eating take-out meals.
2. Methods
2.1. Sampling Popular Dishes
Menus were obtained from three different Asian cuisine restaurants, a Chinese, Thai and a Singaporean restaurant franchise. Ten “popular” best seller dishes were selected based on the restaurant owners identification of the most popular dishes containing vegetables and the author’s opinion as to which dishes were most well known. Similar dishes were selected from each of the restaurants to allow for comparison between the different cuisines, for example, pad Thai was purchased from each restaurant. At least one vegetable-only dish was purchased from each restaurant. Data collection was over two days. The purchased dishes were taken to Curtin University’s School of Public Health Food Laboratory for analysis. As meals were purchased at point of sale, there was no prior notification of the restaurant owner. No digital photographs were taken at or of the restaurant, and informed consent was not required prior to purchasing the meals.
2.2. Digital Photography and Weighing Food
Each dish was photographed in its take-away container, then weighed using calibrated Phillips Precision scales (HR2385) measure to nearest gram. The entire container contents were removed onto a plate and a second photograph was taken to allow for comparison between dishes. The vegetables were then separated out using tongs, and any liquid sauce was squeezed out. Next the vegetables were arranged on a plate beside the other ingredients. The third photograph was taken at this point. The total vegetable content was weighed, recorded and where possible, each individual vegetable type was weighed. The vegetable components were grouped by type on a plate and a fourth photograph was taken. A simple digital camera was used to take all images. A uniform method was used to take the image to assist visual comparison of serving sizes. This involved using the same plate, same distance and angle from the plate and similar lighting conditions.
2.3. Statistical Analysis
The names and weights were recorded and then entered into a Microsoft Excel spreadsheet for and tabulated prior to analysis. Analysis was conducted using the Statistical Package for Social Sciences (SPSS) version 17.0 to determine frequencies and test the vegetable content of the three Asian cuisines for statistically significant differences at p < 0.05. The total vegetable weight from each of the 30 dishes analysed was converted to 75 gram servings to determine how many serves of vegetables were in each dish. The servings were then compared to the recommended servings of vegetables per serving as specified by the Go for 2&5® Nutrition Recipe criteria [23].
3. Results
3.1. Vegetable Content across Dishes Purchased
The average amount of vegetables per dish was not significantly different across cuisines, at 24.3% for Singaporean, 29.1% for Chinese, and 29.6% for Thai. There was no significant difference in the percentage of vegetables per dish per weight at (p > 0.05), see Table 1.
Singaporean dishes had the least total average vegetable content and variety, whilst Thai and Chinese dishes were similar in range and percentage of vegetables by weight.
There was an average of 3.8 types of vegetables across all 30 restaurant dishes, with Thai cuisine providing the greatest variety at 4.9 types, followed by 3.8 types in the Singaporean and 2.6 in the Chinese dishes. Table 2 shows the list of dishes purchased by cuisine.
3.2. Vegetables Variety in Asian Cuisines
The most common vegetable varieties across all cuisines Asian greens, including Bok choy (20 dishes), onion (19
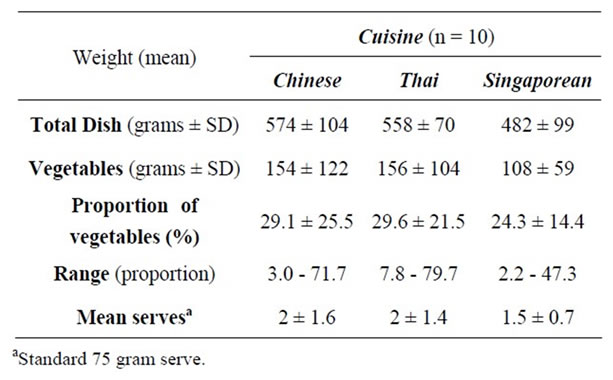
Table 1. The mean vegetable content per dish of takeaway Asian foods, by Chinese, Thai, Singaporean cuisine (n = 30).
dishes), carrot (13 dishes, only in Thai and Chinese) and capsicum (12 dishes). The Chinese fried mixed vegetables had five types of vegetables compared to one in with bok choy only. The Thai and Singaporean vegetable-only dishes provided three and four types respectively. See Table 2.
3.3. Vegetable Content of Individual Dishes
Use As would be expected, the highest proportional weight of vegetables was in the vegetable only dishes. After the weight of sauces and liquids were removed there was an average 351 grams or 71.7% of the dish weight as vegetables. Sauce and other liquids account 100 to 200 grams in these dishes, in some cases accounting for up to half of the dishes total weight. The Thai’ Mixed vegetables’ had the greatest proportion of vegetables at 405 grams (79.7%). The “vegetable only” dishes provided 2 3/4 servings (Thai) to 4 1 servings (Chinese) to 5 1/2 servings (Singaporean) per dish. Basil Chicken (Thai, 40.8%), Chicken cashew (Chinese, 45.9%) and Pork pepper garlic (Singaporean, 32.4%) had the highest proportion of vegetables of the non-vegetarian dishes. The rice and noodle dishes contained the least amount of vegetables per dish, Pad Thai (Thai, 7.8% and Singaporean 2.8%), Nasi Goreng (Chinese, 3% and Thai 13.3%) and Fried rice (Singaporean, 2.2%; Chinese 6.8% and Thai 9.9%).
3.4. Assessment against Recipe Criteria
The Go for 2&5® nutrition criteria encourages eating a variety of vegetables every day by specifying the amount and types of vegetable that should be included in recipes. The main meal criteria requires that an individual serving of the recipe must have at least two types of vegetables
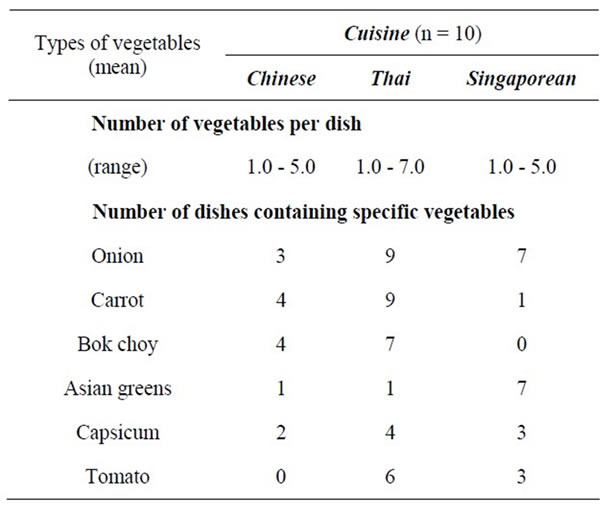
Table 2. Variety of vegetables in Asian dishes by Chinese, Thai, Singaporean cuisine (n = 30).
and that each individual serve of the recipe must have at least one standard serving of vegetables [24]. A standard serving of vegetables is equivalent to 75 grams, or 1/2 cup cooked vegetables or cooked legumes, or one medium potato, or 1 cup salad vegetables. Serve sizes are “as eaten” (i.e. without inedible skin, or liquid medium etc). Assuming that each take-away dish is an individual serving, eight dishes had less than one serving of vegetables and four had less than two types of vegetables. If the take-away serving size was for two people, over half, 16 would not have one serving of vegetables per serve. See Table 3.
3.5. Use of Digital Photography
The images provided a real-life indication of vegetable servings. There was a variation in colour in the dishes with a greater vegetable content having a greater range of colours. For example, there was less colour variation in the rice dish compared to the vegetable only dish. See Figure 1 images demonstrating colour variation between “Fried Rice with Chicken” and “Beef and Spinach”.
4. Discussion
This study analysed the amount and types of vegetables provided in 30 take-away menu dishes in a Chinese, Thai and Singaporean restaurant in Perth Western Australia. There were no significant differences in the average amount of vegetables in popular take-away dishes across selected Asian cuisines, based on weight, percentage and the number of standard servings provided. The varied recipes, serving sizes and ingredients of each cuisine did not influence the average proportion and raw weight of vegetables across the 30 dishes analysed. There were differences in the variety and types of vegetables used in recipes for the various cuisine. It was possible to select dishes with a higher total vegetable content within the cuisines. For example, the “vegetable only” dishes had up to ten times as much vegetables as the noodle or rice based dishes.
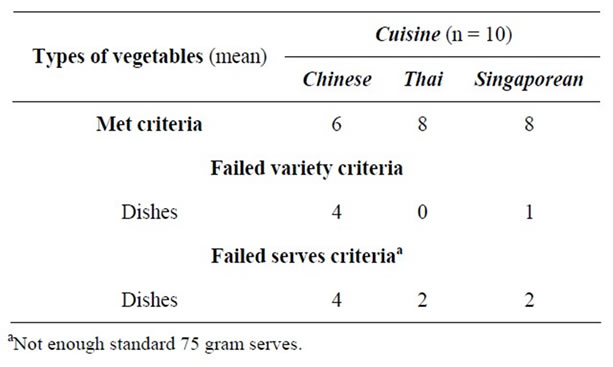
Table 3. Assessment of vegetable variety and content of Asian dishes against the Gofor 2&5® Nutrition Criteria.
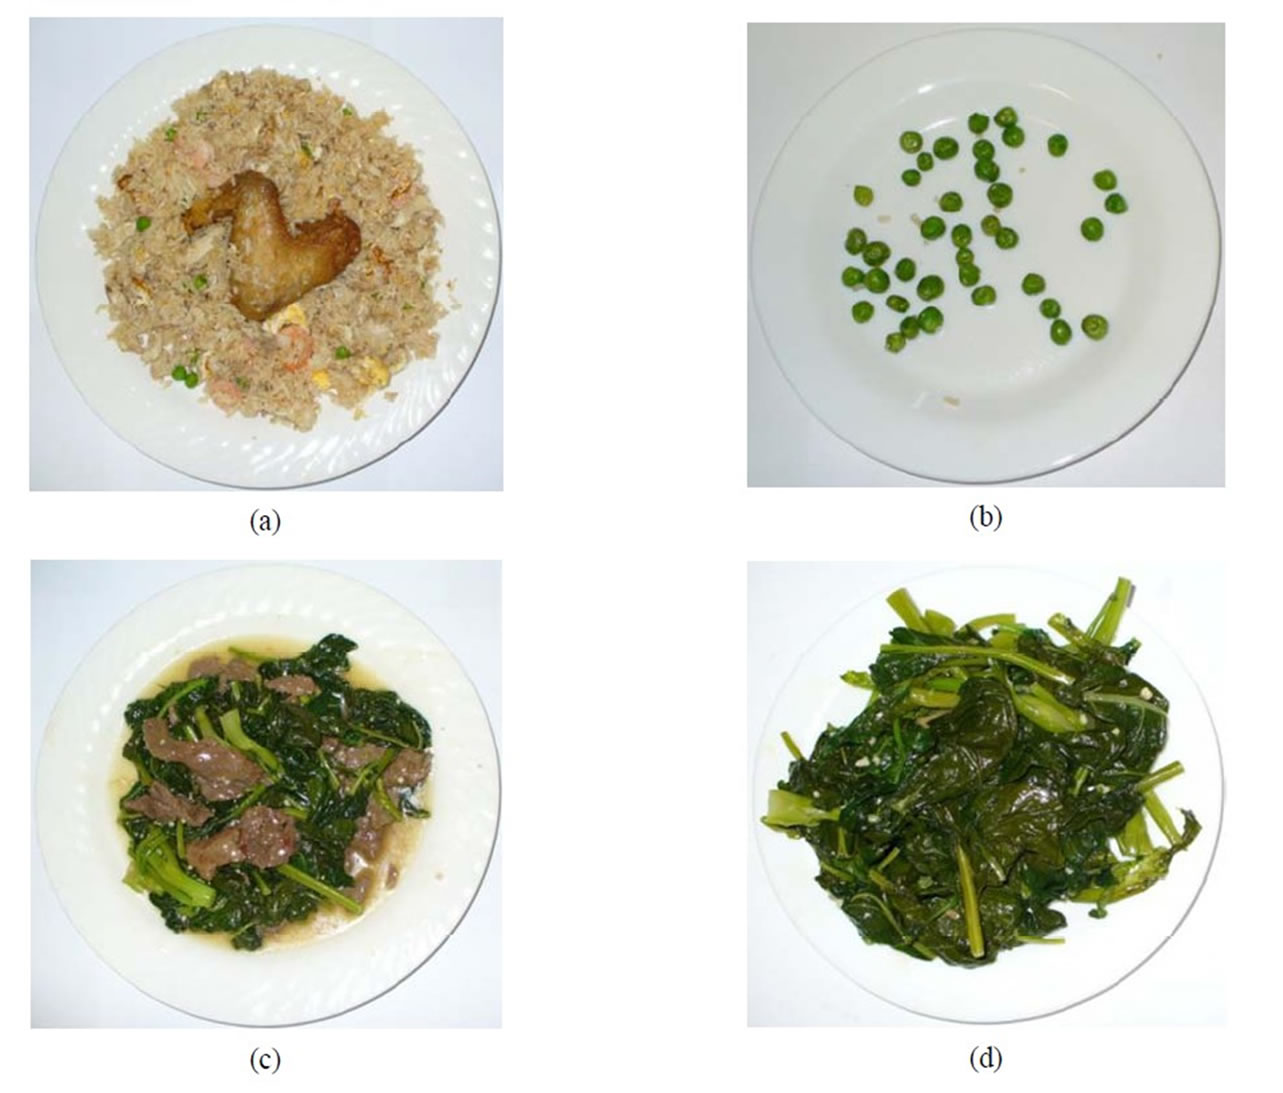
Figure 1. Digital images of vegetable content of two Asian meals, mixed and vegetables only (Fried rice with chicken and beef and spinach). (a) Fried rice with chicken; (b) Fried rice with chicken—vegetables only; (c) Beef and spinach; (d) Beef and spinach vegetables.
4.1. Standard Servings of Vegetables/Dish
Dishes averaged about two standard vegetable servings per dish, if the dish was intended for two people then they would just meet the minimum vegetable criteria, however, there were some dishes that fell well short of the recommended one serving per individual serve of the meal. The lack of a specified number of servings per dish make it is difficult to assess. There was a wide range in the proportional vegetable content between meals, suggesting that there are definitely better choices among Asian foods to encourage vegetables consumption. This study would suggest that consumers should always select at least one “vegetable only” dish from the menu, for example a vegetable stir fry or braised vegetables. More investigation may be needed to determine the nutritional content of the sauces on these dishes, as in some cases they represented half of the dish weight and if they are oil based with seasonings, may be high in fat, salt and kilojoules. Consumers should be reminded of the lack of vegetables in specific rice-based dishes. The food service industry could be encouraged to incorporate extra servings of vegetables into dishes by being asked to meet set nutrition standards such as the Go for 2&5® recipe criteria.
This study presents a ‘real life’ snapshot of the vegetable content across a particular cuisine, in this case the components of Asian take-away dishes purchased in Perth Australia. Apart from a number of cuisine specific signature dishes, there is a significant overlap in common take-away dishes in Australian Asian restaurants regardless of the cuisine, possibly to cater for a wider range of Australian tastes and consumer expectations of popular Asian meals. The commonality of dishes amongst a range of Asian cuisines, for example, fried rice and chicken and vegetable dishes, suggest that no one cuisine has a significantly higher average vegetable content.
4.2. Digital Photography and Nutrition Education
Visual imagery may provide a simple, easy to use education tool for selecting vegetable rich dishes from menus. The photographs clearly demonstrated the relative vegetable content of the dishes, the variety, amount and colour. The United States Fruit and Vegetable campaign has utilised the use of colour as key nutrition message for a number years [25]. The colour imagery and comparison with exemplar recipes meeting set criteria for inclusion of vegetables eg. Healthy Food Fast may be a useful public education tool [26]. Imagery may be useful for nutrition interventions encouraging the take-away industry to increase the vegetable content of their meals and consumers to choose colourful dishes.
4.3. Cuisine Variations Vegetables Types
The largest difference in vegetable content was observed between dishes rather than within cuisines. These findings suggest that recommendations to increase vegetable intake when eating out at Asian restaurants should be based on which type of dish to choose rather than which type of Asian restaurant to eat at. Staple rice and noodle dishes such as fried rice, pad Thai and nasi goreng which were found across a variety of cuisines, were consistently low in both vegetable content and variety.
These findings suggest that contrary to popular belief about the intrinsic healthfulness of Asian cuisine, there is a need to choose carefully from Asian take-away menus to select dishes containing vegetables. Some consumers may be surprised that popular Asian dishes contain as little as 12 grams of vegetables per dish, particularly if their choice of Asian cuisine was health or nutrition motivated. Although not reported in this paper, some of the meals were also often high in fat and salt due to the sauces. Nutrition interventions should work with both the consumer, to identify healthier food choices when they select take-away Asian foods and the restaurateur to increase the vegetable content of typical dishes.
4.4. Limitations and Future Research
Limitations of the study design need to be acknowledged. The sample size was very small and the research undertaken to test the concept, therefore not enabling the results to be generalised to all Asian take-outs. However, the results would suggest that a larger sample size be undertaken with comparison across a number of cuisines including Asian. Small measurement errors may have occurred when weighing the dishes due to the difficulty in extracting all liquid sauce from the vegetables prior to weighing. Separating out individual vegetables may also have resulted in errors due to similarity in appearance of some vegetables to other components of the dish. Analysis of the recipe vegetable servings for comparison against the recommended nutrition criteria may have produced different results if using the 75 gram standard serve instead of weighing lighter vegetables, such as bean sprouts and peas.
Asian meals are often shared amongst a group of people. The conclusions drawn are based on analysis of the entire dish, which may represent more than one individuals serving. If so, the vegetable servings per person would be even lower. Recommendations to the general public include: choose a combination of mixed meat and vegetable dishes as well as selecting a vegetable-only dish to increase vegetable servings; choose plain rice dishes in conjunction with other meals rather than on its own; look for variety and vegetable side dishes containing a number of vegetables.
More research into this area is warranted to provide more accurate information to restaurateurs, food policy makers, and consumers about better healthful take-away food choices. Ideally a larger sample size across a wide range of cuisines. Information about the selection and consumption of Asian take-away foods would enable a wider comparison of the vegetable servings provided in the dishes on the average amount of vegetables consumers are being provided with. Future directions in this area should not only examine the provision of vegetables from take-away dishes, but also take into account the overall fat and kilojoule content, in order to provide consumers a more complete depiction of the overall healthfulness of take-away dishes based. The authors advocate for nutrition labelling on the menu as recent research indicates that consumers make are selection when this is available [27].
5. Conclusions
Providing information concerning the nutritional content of meals served may assist food businesses to identify simple menu changes to provide more healthful food choices [17]. For a relatively small outlay, the cost of purchasing the meals, dietitians can provide tailored feedback to restaurateurs to assist in improving the quality of their menus by adding additional servings of vegetables to popular Asian dishes. Food businesses are motivated by profit margin over niche markets. Communicating the vegetable content of healthier menu options may drive purchasing decision of the health conscious consumer.
In summary, contrary to popular belief, the Asian cuisines sampled were not a good source of vegetables. There were no significant difference between Chinese, Thai and Singaporean cuisines, in the average total vegetable content of dishes, however, there was a wide and consistent variation in the vegetable content within each cuisine. The trends for increasing consumption of take-away foods, particularly Asian take-away point to an urgent need to advise consumers to select the vegetable dense dishes and to encourage he food service industry to increase the vegetable content of Asian meals.
6. Acknowledgements
We thank Curtin University for providing the funding for the purchasing the take-away meals and for assisting with this research. We also acknowledge Katherine Kerr for her digital photography.
REFERENCES
- Australian Bureau of Statistics, “Cafes, Restaurants and Catering Services, Australia, 2006-07,” Australian Bureau of Statistics, Canberra, 2008.
- Australian Government Department of Agriculture Fisheries and Forestry, “FOODmap: A Comparative Analysis of Australian Food Distribution Channels,” Commonwealth of Australia, Canberra, 2006.
- J. Dixon, A. M. Omwega, S. Friel, C. Burns, K. Donati and R. Carlisle, “The Health Equity Dimensions of Urban Food Systems,” Journal of Urban Health, Vol. 84, Suppl. 1, 2007, pp. 118-129. doi:10.1007/s11524-007-9176-4
- C. Burns, M. Jackson, C. Gibbons and R. M, Stoney, “Foods Prepared Outside the Home: Association with Selected Nutrients and Body Mass Index in Adult Australians,” Public Health Nutrition, Vol. 5, No. 3, 2002, pp. 441-448. doi:10.1079/PHN2001316
- National Health and Medical Research Council, “Dietary Guidelines for Older Australians,” Commonwealth of Australia, Canberra, 1999.
- National Health and Medical Research Council, “Dietary Guidelines for Children and Adolescents in Australia incorporating the Infant Feeding Guidelines for Health Workers,” Commonwealth of Australia, Canberra, 2003.
- National Health and Medical Research Council, “Dietary Guidelines for Australian Adults,” Commonwealth of Australia, Canberra, 2003.
- US Department of Health and Human Services, US Department of Agriculture, “Dietary guidelines for Americans 2005,” US Department of Health and Human Services, U.S. Department of Agriculture, 2005.
- C. Pollard, M. Miller and S. Lievers, “The Western Australian Fruit and Vegetable Campaign: Did It work?” Nutrition and Physical Activity Program, Health Department of Western Australia, Perth, 2000.
- Australian Bureau of Statistics, “National Nutrition Survey Foods Eaten Australia 1995,” Commonwealth of Australia, Canberra, 1999.
- A. Smith, E. Kellett and Y. Schmerlaib, “The Australian Guide to Healthy Eating: Background Information for Nutrition Educators,” Commonwealth Department of Health & Family Services, Commonwealth of Australia, 1998.
- Australian Bureau of Statistics, “National Health Survey: Summary of Results,” Australian Bureau of Statistics, Canberra 4364.0, 2006.
- N. I. Larson, D. R. Neumark-Sztainer, M. T. Story, M. M. Wall, L. J. Harnack and M. E. Eisenberg, “Fast Food Intake: Longitudinal Trends during the Transition to Young Adulthood and Correlates of Intake,” Journal of Adolescent Health, Vol. 43, No. 1, 2008, pp. 79-86. doi:10.1016/j.jadohealth.2007.12.005
- S. Paeratakul, D. P. Ferdinand, C. M. Champagne, D. H. Ryan and G. A. Bray, “Fast-Food Consumption among US Adults and Children: Dietary and Nutrient Intake Profile,” Journal of the American Dietetic Association, Vol. 103, No. 10, 2003, pp. 1332-1338. doi:10.1016/S0002-8223(03)01086-1
- K. Miru, K. Giskes and G. Turrell, “Socioeconomic Differences in Takeaway Food Consumption and Their Contribution to Inequalities in Dietary Intakes,” Journal of Epidemiology and Community Health, Vol. 63, No. 10, 2009, pp. 820-826.
- K. Smith, S. McNaughton, S. Gall, L. Blizzard, T. Dwyer and A. Venn, “Takeaway Food Consumption and Its Associations with Diet Quality and Abdominal Obesity: A Cross-Sectional Study of Young Adults,” International Journal of Behavioral Nutrition and Physical Activity, Vol. 6, 2009, p. 29. doi:10.1186/1479-5868-6-29
- K. Glanz, K. Resnicow, J. Seymour, K. Hoy, H. Stewart, M. Lyons and J. Goldberg, “How Major Restaurant Chains Plan Their Menus: The Role of Profit, Demand, and Health,” American Journal of Preventive Medicine, Vol. 32, No. 5, 2007, pp. 383-388. doi:10.1016/j.amepre.2007.01.003
- M. L. Wahlqvist, “Asian Migration to Australia: Food and Health Consequences,” Asia Pacific Journal of Clinical Nutrition, Vol. 11, Suppl. 3, 2002, pp. S562-568. doi:10.1046/j.1440-6047.11.supp3.13.x
- Rodale Institute, “Asian Foods All the Rage in Australia,” 2007.
- J. Hwang and T.-N. Lin, “Effects of Food Neophobia, Familiarity, and Nutrition Information on Consumer Acceptance of Asian Menu Items,” Journal of Hospitality Marketing & Management, Vol. 19, No. 2, 2010, pp. 171-187.
- S. Jang, A. Ha and C. Silkes, “Perceived Attributes of Asian Foods: From the Perspective of the American Customers,” International Journal of Hospitality Management, Vol. 28, No. 1, 2009, pp. 63-70. doi:10.1016/j.ijhm.2008.03.007
- T. Dumanovsky, C. A. Nonas, C. Y. Huang, L. D. Silver and M. T. Bassett, “What People Buy from Fast-Food Restaurants: Caloric Content and Menu Item Selection, New York City 2007,” Obesity, Vol. 17, No. 7, 2009, pp. 1369-1374.
- C. Pollard, C. Nicholson, C. Pulker and C. Binns, “Translating Government Policy into Recipes for Success! Nutrition Criteria Promoting Fruit and Vegetables,” Journal of Nutrition Education and Behaviour, Vol. 41, No. 3, 2009, pp. 218-226. doi:10.1016/j.jneb.2008.02.002
- Department of Health in Western Australia, “Go for 2&5® Nutrition Criteria,” Department of Health in Western Australia, 2005.
- Produce for Better Health Foundation, “5 A Day—The Color Way,” 2004. http://www.fruitsandveggiesmorematters.org/
- Department of Health in Western Australia, “Healthy Food Fast,” Department of Health, Perth, 2002.
- C. A. Roberto, “Evaluating the Impact of Menu Labeling on Food Choices and Intake,” American Journal of Public Health, Vol. 100, No. 2, 2010, pp. 312-318. doi:10.2105/AJPH.2009.160226