Food and Nutrition Sciences
Vol. 2 No. 7 (2011) , Article ID: 7230 , 6 pages DOI:10.4236/fns.2011.27096
Motivations Underlying the Snack Choices of Japanese Junior High School Students: A Study Based on Cluster Analysis
![]()
Graduate School of Humanities and Sciences, Ochanomizu University, Tokyo, Japan.
Email: akamatsu.rie@ocha.ac.jp
Received June 20th, 2011; revised July 11th, 2011; accepted July 20th, 2011.
Keywords: Snack Choice, Junior High School Students, Cluster Analysis, Japanese
ABSTRACT
The aims of the present study were to group junior high school students according to factors influencing their snack choice and identify differences between the characteristics and snack choice behaviors of the groups. An anonymous self-report questionnaire was administered to 1936 students (13 - 15 years old) in eight junior high schools in Tokyo, Japan. The students responded to the Snack Choice Questionnaire (SCQ) as well as questions concerning snacking behaviors, lifestyles, and demographics. Cluster analysis was applied to sort the sample according to SCQ scores. Each cluster’s characteristics were examined by gender using the χ2 test or the Kruskal-Wallis test with a Bonferroni adjustment. Participants were divided into four groups: high in all factors, low in all factors, low value in health, and value in health. The “value in health” group was composed of more girls than boys and the “low in all factors” group had fewer girls than boys. Those in the “high in all factors” and “low value in health” groups indicated that they consumed more snacks. Moreover, gender differences were revealed. By assessing the SCQ prior to providing nutrition education, we can obtain valuable information to make nutrition education planning.
1. Introduction
Various factors influence food choice, and these factors differ among individuals [1]. For instance, some people prioritize health, whereas others prioritize price. These motivational factors influence people’s eating habits, which reflect their attitude toward food [2]. By examining the motivational factors underlying food choice, we can predict eating behaviors and make dietary suggestions based on people’s preferences when they need to change their eating behaviors.
The subjects in previous studies concerning motivations underlying food choice were mostly university students [1-3]. However, the motivations underlying food choice change during adole-scence, and behavioral patterns acquired within this period are likely to influence people’s long-term behaviors and health [4-6]. Because of this, it is important to know the motivations underlying food choice during adolescence.
Fast food and snacks are popular types of food that children choose and buy on their own. Previous research has reported various motivations for adolescents’ preference for fast food and snacks [7-9]. Two important motivations underlying adolescents’ fast-food and snack choices are “health and weight” concerns (e.g., fat, nutrients, and calories) and “preference and budget” (e.g., taste, hunger, and availability). Those individuals who place a high priority on health and weight purchase more low-fat snacks as compared with those who do not emphasize these factors. This group mainly consists of women [7,8]. On the other hand, men place a higher priority on preference and budget [7].
Recent studies have identified motivations related to advertisements and fashion in addition to the previous two motives underlying snack choice. Motivations such as “inclination to try a new snack”, “attractive packaging”, and “friends’ preferences” influence the decision to purchase other types of snacks over low-fat ones [9]. The Snack Choice Questionnaire (SCQ) was developed to assess the motivations underlying snack choice and is composed of the sub-scales “fashion and sales promotion”, “health and weight control”, and “convenience and taste” [10]. Research found that junior high school students who scored high on the “fashion and sales promotion” or the “convenience and taste” subscale purchased and consumed more snacks and watched more television [10]. The opposite pattern was found for junior high school students who scored high on the “health and weight control” subscale. However, the three sub-scales were not combined when analyzing the results. Had the subscales been combined, a different pattern of results may have emerged.
The purpose of the current study was to determine how a sample of junior high school students clusters according to the factors influencing their snack choice (e.g., health, budget, and fashion). The current study also aims to identify differences in the characteristics and snack choice behaviors among the clustered groups.
2. Methods
2.1. Study Design and Participants
An anonymous self-report questionnaire was administered to 1936 students (13 - 15 years old) in eight junior high schools in May, 2005 in Tokyo, Japan. The questionnaires were sent to each school. The survey was conducted under the supervision of teachers in their classrooms in accordance with guidelines outlined in the survey manuals. Teachers explained the purpose of the study to the students and that the survey had no bearing on their classes or school records. Students could refuse to participate in the survey. A statement on the survey assured students that all responses would remain anonymous; completion of the survey confirmed their consent to participate. Each school collected the completed questionnaires and returned them to the resear-chers via mail. The study was approved by the Ethics Committee of Ochanomizu University.
2.2. Measures
The questionnaire was composed of four parts: 1) Questions from the Snack Choice Questionnaire (SCQ) to measure the motivations underlying snack choice [10], 2) Questions on snacking behavi-ors, 3) Questions addressing self-efficacy in avoiding the temptation to eat too many snacks, and 4) Questions on demographics (gender, grade, height, and weight).
The validity and reliability of the SCQ, which consists of 22 items, was established in previous research [10]. The SCQ has three subscales: “fashion and sales promotion (e.g., appears in a commercial, is what my friends eat” (nine items), “health and weight control (e.g., is low in calories, is low in fat)” (six items), and “convenience and taste (e.g., is cheap, can be bought in shops close to my house)” (seven items). The participants were asked to rate the relevance of each item to their snack choice on a four-point Likert scale ranging from 1 (not important at all) to 4 (very important).
The participants also indicated the frequency with which they consumed snacks or purchased the snacks themselves. The participants selected one of four options (“almost never,” “rarely,” “sometimes,” and “often”). Furthermore, participants were asked about their selfefficacy in eight situations where they were tempted to overeat snacks (e.g., when watching television or when siblings or friends are eating snacks) [11]. Responses were ranked on a four-point Likert scale.
2.3. Statistical Analysis
Descriptive statistics were used to summarize the demographic data. The average score on each subscale of the SCQ was calculated after assessing the reliability of the items. Then, cluster analysis was applied to sort the sample into groups according to the SCQ subscale scores. The charac-teristics of each clustered group were examined separately by gender using the χ2 test. Because the scores for self-efficacy displayed an asymmetrical distribution (p < 0.001 based on the result of the Shapiro– Wilk test), the Kruskal-Wallis test with a Bonferroni adjustment were used for statistical analyses [12]. The responses related to the frequency of consuming or purchasing snacks were combined into two categories, “almost never/rarely” and “sometimes/often”. Statistical analyses were carried out using SPSS version 17.0 (SPSS, Inc., Chicago, IL, 2008) for Windows. Significance was set at the 0.05 level.
3. Results
3.1. Characteristics of the Participants
A total of 1936 questionnaires were distributed to students, and 1796 questionnaires were retur-ned (93% response rate). The number of respondents from each grade was as follows: 588 first-year students (13 years old) (32.7%), 570 second-year students (14 years old) (31.7%), and 638 third-year students (15 years old) (35.5%). Of the respondents, 921 (51.3%) were boys. The average body mass index (BMI) was 19.3 (SD = 2.9) kg/m2 (boys: 19.5 (SD = 3.1) kg/m2, girls: 19.0 (SD = 2.6) kg/m2).
3.2. Clusters of the SCQ
The Cronbach α for each subscale was as follows: 0.88 for “fashion and sales promotion,” 0.88 for “health and weight control,” and 0.81 for “convenience and taste.” The average score and standard deviation for each subscale were 2.1 (SD = 0.7), 2.6 (SD = 0.8), and 2.8 (SD = 0.7), respectively.
Participants were divided into four groups based on the cluster analysis: 1) High motivation in all factors (“high in all factors”) (n = 328, 20.3%); 2) Low motivation in all factors (“low in all factors”) (n = 253, 15.6%); 3) Low value in health and weight control (“low value in health”) (n = 491, 30.3%); and 4) High value in health and weight control (“value in health”) (n = 547, 33.8%) (Figure 1).
3.3. Demographic Variables of Each Clustered Group
Table 1 displays the number of students with respect to gender and grade in each clustered group. There were more girls than boys in the “value in health” group and fewer girls than boys in the “low in all factors” group (χ2(3) = 76.3, p < 0.001). Furthermore, there were more first-year students in the “value in health” group and more third-year students in the “high in all factors” group (χ2(3) = 17.9, p = 0.007).
A statistically significant difference in BMI (kg/m2) was observed only in boys (boys: χ2(3) = 23.4, p < 0.001; girls: χ2(3) = 2.8, p = 0.426). For boys, the BMI in the “value in health” group (20.1, SD = 3.4) was higher than that in the “low value in health” group (18.8, SD = 2.4) (p < 0.001) (boys: “high in all factors” group = 19.5, SD = 3.0, “low in all factors” group = 19.5, SD = 3.4; girls: “high in all factors” group = 19.2, SD = 2.7, “low in all factors” group = 19.0, SD = 3.1, “value in health” group = 19.1, SD = 2.7, “low value in health” group = 18.7, SD = 2.5).
3.4. Snacking Behavior in Each Clustered Group
The number of respondents who selected each response for snack consumption frequency was as follows: boys: “often” = 169 (20.7%), “sometimes” = 338 (41.4%), “rarely” = 235 (28.8%), “almost never” = 74 (9.1%); girls: “often” = 237 (30.0%), “sometimes” = 352 (44.6%), “rarely” = 173 (21.9%), “almost never” = 28 (3.5%). The number of respondents who indicated the frequency of purchasing snacks was as follows: boys: “often” = 90 (11.0%), “sometimes” = 218 (26.7%), “rarely” = 299 (36.6%), “almost never” = 210 (25.7); girls: “often” = 46 (5.8%), “sometimes” = 197 (24.9%), “rarely” = 328 (41.5%), and “almost never” = 219 (27.7%). For both boys and girls, “sometimes” and “rarely” were the most common responses for the consumption and purchase of
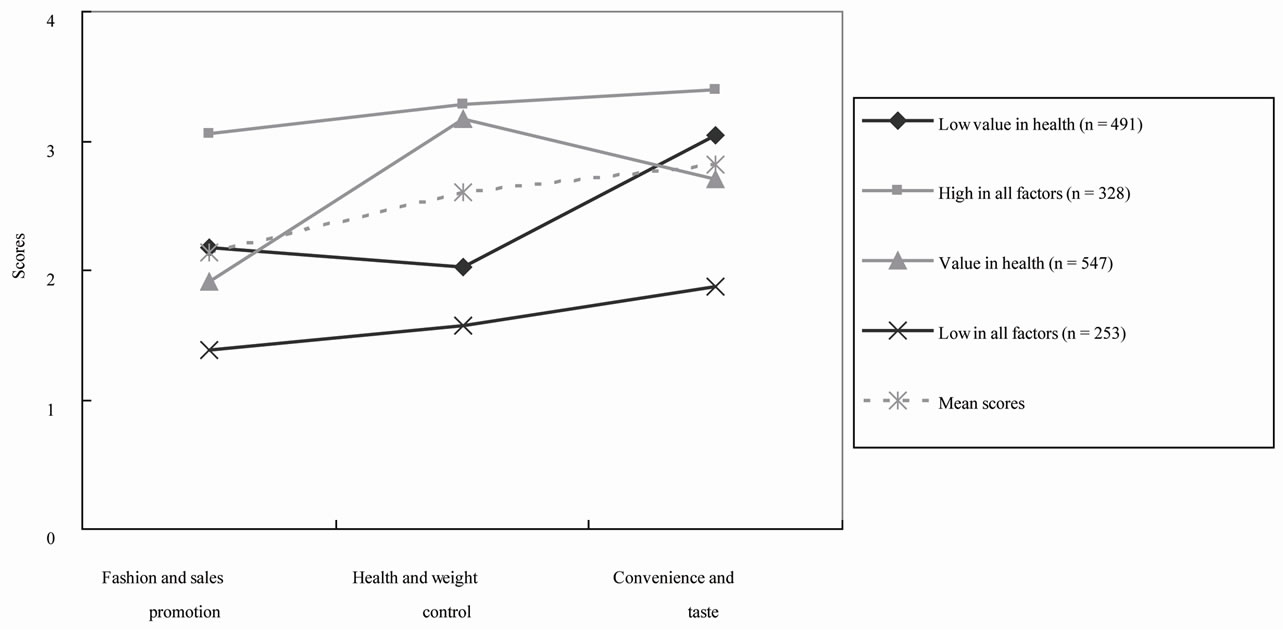
Figure 1. The scores of the four clustered groups of the SCQ.
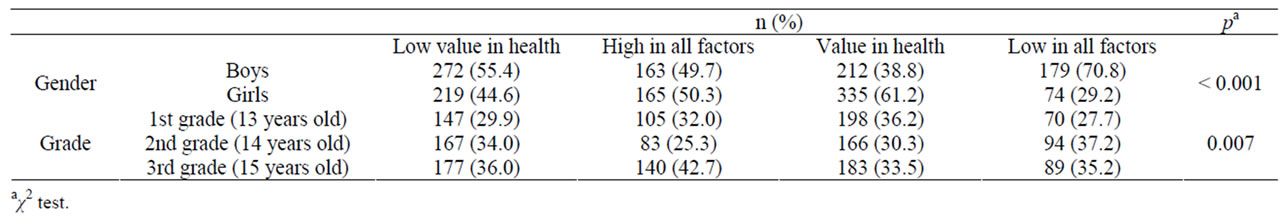
Table 1. Number of students according to gender age and age in each clustered group.
snacks, respectively.
As shown in Table 2, snacking behaviors differed among the clustered groups. Both boys and girls in the “low value in health” and “high in all factors” groups reported consuming more snacks (“often/sometimes”) than did those in the other clustered groups (boys: χ2(3) = 33.6, p < 0.001; girls: χ2(3) = 28.0, p < 0.001). Similar results were observed in the responses for the purchase of snacks, but the tendency was weaker than that for the consumption of snacks (boys: χ2(3) = 8.7, p = 0.034; girls: χ2(3) = 5.8, p = 0.122).
The self-efficacy scores for avoiding the temptation to overeat snacks differed by clusters for both boys and girls (boys: χ2(3) = 31.5, p < 0.001; girls: χ2(3) = 62.4, p < 0.001) (Figure 2). For boys, the self-efficacy scores in the “high value in health” group were higher than those in the “low value in health” and “high in all factors” groups (p < 0.001 and p < 0.01, respectively). For girls, the self-efficacy scores in the “high value in health” and “low in all factors” groups were higher than those in the “low value in health” and “high in all factors” groups (p < 0.001 for all).
4. Discussions
This study illustrated that cluster analysis can be used to identify groups of students with unique patterns regarding motivations underlying snack choice. Four groups were identified, and demogra-phics as well as snacking behaviors were found to differ among the clustered groups. Moreover, gender differences were observed.
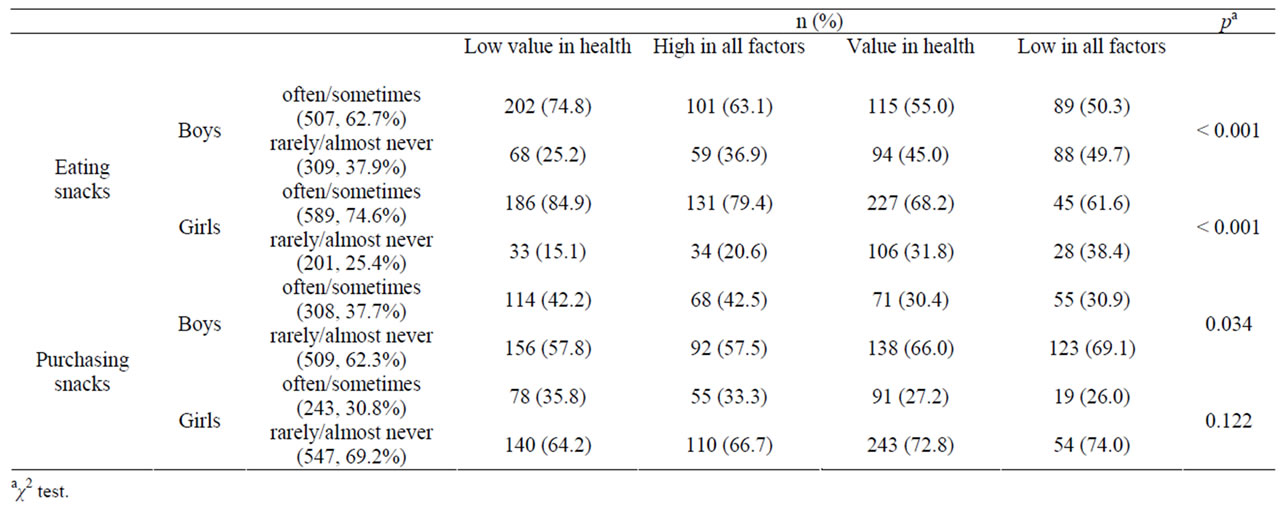
Table 2. Snacking behaviors according to gender in each clustered group.
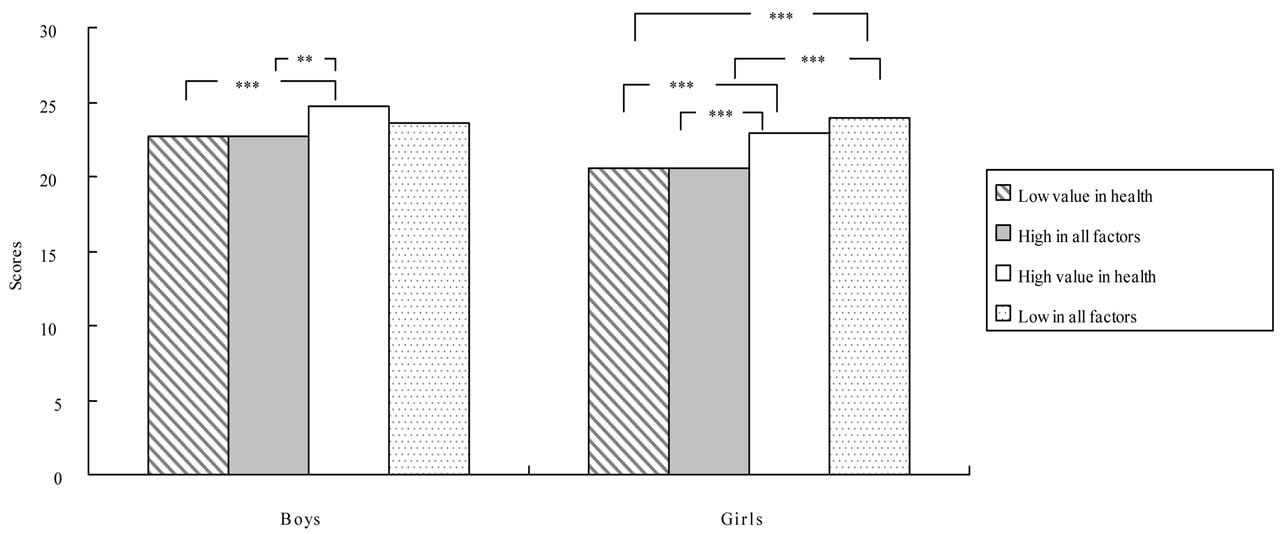
Figure 2. The scores of self-efficacy to avoid overeating snacks in each clustered group. Kruskal-Wallis test (boys: χ2(3) = 31.5, p < 0.001; girls: χ2(3) = 62.4, p < 0.001) with the Bonferroni adjustment, **p < 0.01, ***p < 0.001.
4.1. The Characteristics of the Clusters of the SCQ
The four groups identified from the cluster analysis were high motivation in all factors (“high in all factors”), low motivation in all factors (“low in all factors”), low value in health and weight control (“low value in health”), and high value in health and weight control (“value in health”). The results for the “value in health” and “low value in health” groups were as expected. The former type consumed and purchased snacks less often and possessed higher self-efficacy scores than the latter. These results are consistent with those of previous studies in which higher healthy attitudes predict healthy behaviors [1,2].
On the hand, this study provided new insight given the results of the “high in all factors” and “low in all factors” types. The snacking behaviors of the “high in all factors” type were similar to the “low value in health” type, but not the “value in health” type, despite the prioritization of health. These results imply that eating attitudes are better assessed by the combination of the sub-scales rather than by one sub-scale. The snacking behaviors of the “low in all factors” type looked similar to the “value in health” type at first glance, but the results of the snack foods they purchased were different for girls. The snacking behaviors of the “low in all factors” type were more similar to the “low value in health” and “high in all factors” types in that they preferred chips or corn snacks. However, we do not have enough data to analyze characteristics difference between “low in all factors” and “value in health” any further. Additional research is needed.
4.2. Gender Difference of the SCQ
The gender difference observed in this study is another important finding. Gender differences in eating attitude have been reported in previous studies [13-15], but few dealt with early teens. The results of this study indicate that more girls were in the “value in health” type and more boys in the “low in all factors” type. It is likely that this difference exists because girls are more conscious of their bodies than boys even in their early teens.
4.3. Limitations
Limitations of the study should be noted. Because the survey was targeted at school children, the questionnaire items were limited. The questionnaire did not contain items addressing the relation-ship between the motivations underlying snack choice and behaviors, for example, dieting status, family influence, and socioeconomic factors. The participants were recruited from only one city, thus restricting the possibility of generalizing the findings to a wider population. Furthermore, self-report surveys may result in recall error or be subject to socially desirable responses.
5. Conclusions
This study successfully applied cluster analysis to examine the motivations underlying snack choice and identified the unique characteristics of the resulting clustered groups. The findings may be useful in providing nutrition education according to the students’ preferences.
Administering the Snack Choice Questionnaire (SCQ) data prior to providing nutrition education may help us obtain information about participants’ unique snacking behaviors. The participants who scored high in all the subscales or scored low in the “health and weight control subscale” may consume more snacks and have lower self-efficacy with respect to avoiding the excessive consumption of snacks. Perhaps these participants should be educated on ways to improve self-efficacy.
On the other hand, the participants who scored low on all the subscales or scored high on the “health and weight control” subscale may consume fewer snacks and have higher self-efficacy for avoiding the excessive consumption of snacks. However, a different approach would be required for these two groups. Those who scored low on all the subscales could be indifferent toward food and eating. If this is the case, they may need to develop an interest in food and enjoyment of eating. Those who scored high on the “health and weight control” subscale may need to maintain their healthy behaviors. However, girls are likely to have a poor body image and engage in needless weight-loss programs. Therefore, girls should be provided with appropriate knowledge to develop an appropriate attitude for a healthy lifestyle.
6. Acknowledgements
The author is grateful for the assistance of Hiromi Izuchi and Kumiko Horikawa for their assistance in data processing.
REFERENCES
- A. Steptoe, T. M. Pollard and J. Wardle, “Development of a Measure of the Motives Underlying the Selection of Food: The Food Choice Questionnaire,” Appetite, Vol. 25, No. 3, 1995, pp. 267-284.
- Y. H. Sun, “Health Concern, Food Choice Motives, and Attitudes toward Healthy Eating: The Mediating Role of Food Choice Motives,” Appetite, Vol. 51, No. 1, 2008, pp. 42-49.
- G. Ares and A. Gámbaro, “Influence of Gender, Age and Motives Underlying Food Choice on Perceived Healthiness and Willingness to Try Functional Foods,” Appetite, Vol. 49, No. 1, 2007, pp. 148-158.
- N. I. Larson, D. R. Neumark-Sztainer, L. J. Harnack, M. M. Wal, M. T. Story and M. E. Eisenberg, “Fruit and Vegetable Intake Correlates during the Transition to Young Adulthood,” American Journal of Preventive Medicine, Vol. 35, No. 1, 2008, pp. 33-37. doi:10.1016/j.amepre.2008.03.019
- N. I. Larson, D. R. Neumark-Sztainer, M. T. Story, M. M. Wall, L. J. Harnack and M. E. Eisenberg, “Fast Food Intake: Longitudinal Trends during the Transition to Young Adulthood and Correlates of Intake,” Journal of Adolescent Health, Vol. 43, No. 1, 2008, pp. 79-86. doi:10.1016/j.jadohealth.2007.12.005
- L. Y. Wang, D. Chyen, S. Lee and R. Lowry, “The Association between Body Mass Index in Adolescence and Obesity in Adulthood,” Journal of Adolescent Health, Vol. 42, No. 5, 2008, pp. 512-518. doi:10.1016/j.jadohealth.2007.10.010
- T. M. Horacek and N. M. Betts, “Students Cluster into 4 Groups According to the Factors Influencing Their Dietary Intake,” Journal of the American Dietetic Association, Vol. 98, No. 12, 1998, pp. 1264-1467. doi:10.1016/S0002-8223(98)00333-2
- D. Neumark-Sztainer, M. Story, C. Perry and M. A. Casey, “Factors Influencing Food Choices of Adolescents: Finding from Focus-Group Discussions with Adolescents,” Journal of the American Dietetic Association, Vol. 99, No. 8, 1999, pp. 929-937. doi:10.1016/S0002-8223(99)00117-0
- S. A. French, M. Story, P. Hannan, K. K. Breitlow, R. W. Jeffery, J. S. Baxte and M. P. Snyder, “Cognitive and Demographic Correlates of Low-Fat Vending Snack Choices among Adolescents and Adults,” Journal of the American Dietetic Association, Vol. 99, No. 4, 1999, pp. 471-475. doi:10.1016/S0002-8223(99)00117-0
- R. Akamatsu, “A Measure of the Motives Underlying Snack Selection among Japanese Junior High School Students: The Snack Choice Questionnaire (SCQ),” Japanese Journal of Public Health, Vol. 54, No. 2, 2007, pp. 89-97.
- H. Izuchi and R. Akamatsu, “The Psychosocial Predictors of Excessive Eating of Snacks among Japanese Junior High School Students Using the Theory of Planned Behavior,” Japanese Journal of Health Education and Promotion, Vol. 15, No. 2, 2007, pp. 89-99.
- D. G. Altman, S. M. Gore, M. J. Gardner and S. J. Pocock, “Statistical Guidelines for Contributors to Medical Journals,” In: D. G. Altman, D. Machin, T. N. Bryant and M. J. Gardner, Eds., Statistics with Confidence, 2nd Edition, BMJ Books, Bristol, 2000, pp. 171-190.
- A. J. Hill, “Motivation for Eating Behaviour in Adolescent girLs: The Body Beautiful,” The Proceedings of the Nutrition Society, Vol. 65, No. 2, 2006, pp. 376-384. doi:10.1079/PNS2006513
- J. Wardle, A. M. Haase, A. Steptoe, M. Nillapun, K. Jonwutiwes and F. Bellisle, “Gender Differences in Food choice: The Contribution of Health Beliefs and Dieting,” Annals Behavior Medicine, Vol. 27, No. 2, 2004, pp. 107- 116. doi:10.1207/s15324796abm2702_5
- J. Westenhoefer, “Age and Gender Dependent Profile of Food Choice,” Forum of Nutrition, Vol. 57, 2005, pp. 44- 51. doi:10.1159/000083753