International Journal of Medical Physics, Clinical Engineering and Radiation Oncology
Vol.04 No.04(2015), Article ID:60958,11 pages
10.4236/ijmpcero.2015.44033
The Measurement Accuracy of Ball Bearing Center in Portal Images Using an Intensity-Weighted Centroid Method
Mutian Zhang1, Joseph Driewer1, Yichi Zhang2, Sumin Zhou1, Xiaofeng Zhu1
1Department of Radiation Oncology, University of Nebraska Medical Center, Omaha, USA
2California Institute of Technology, Pasadena, USA

Copyright © 2015 by authors and Scientific Research Publishing Inc.
This work is licensed under the Creative Commons Attribution International License (CC BY).


Received 14 September 2015; accepted 6 November 2015; published 9 November 2015

ABSTRACT
Medical linac based imaging modalities such as portal imaging can be utilized for highly accurate measurements. An intensity-weighted centroid method for determining object center is proposed that can detect the position of small object at subpixel accuracy. The principles and algorithms of the intensity-weighted centroid method are presented. Analytical results are derived for position- al accuracy of a rod and a sphere in digital images, and the theoretical accuracy limits are calcu- lated. The method was experimentally examined using phantoms with embedded ball bearings (BBs). Images of the phantoms were taken by the MV portal imager of a medical linac. The image pixel size was 0.26 mm when projected at the linac isocenter plane. The BB coordinates were calculated by applying the intensity-weighted centroid method after removing the background. The reproducibility of BB position detection was measured with 3 monitor unit (MU) exposures at various dose rates. A stationary BB, of 0.25 image contrast, showed position reproducibility in the range of 0.004 - 0.013 mm. When the method was used to measure the displacement of a moving BB, the difference between the measured and expected BB position had a standard deviation of 0.006 mm. The effect of image noise on the BB detection accuracy was measured using a phantom with multiple BBs. The overall detection accuracy, represented by standard deviation, steadily im- proved from 0.13 mm at 0.03 MU to 0.008 mm at 5.0 MU, and showed an inverse correlation with contrast-to-noise ratio. We demonstrated that intensity-weighted centroid method can achieve subpixel accuracy in position detection. With a linac based imaging system, precise mechanical measurement with accuracy of microns could be achieved.
Keywords:
Subpixel Detection, Intensity-Weighted Centroid, Portal Image, Medical Linac, Ball Bearing

1. Introduction
New radiotherapy delivery modalities, especially stereotactic radiosurgery, increasingly demand better mechanical accuracy of medical linear accelerators (linacs) and imaging devices [1] . The Winston-Lutz test, introduced in 1988 [2] , has become the de facto standard for high-precision mechanical measurements. In fact, phantoms with built-in ball bearings (BBs) are now commonly used in radiology and radiation oncology for quality assurance and mechanical calibration [3] - [9] . During these procedures, the phantoms are imaged using the portal imager (MV therapy beam) or kV imager attached to the linac gantry (e.g., On-Board Imager). The BB center position in the image is then measured and analyzed, either with manual techniques or on-board or third party software. Clearly, the ultimate results of the quality assurance and calibration done in this way depend upon the accuracy with which the BB position is measured on the images. The purpose of this study was to determine both the theoretical and practical accuracy with which a given linac imaging system can detect the position of BBs in a phantom.
An imaging system generates digital images of known pixel size. In general, the image of a BB is brighter or darker than the surrounding lower-density materials depending on how the image is displayed. There are different approaches to determine the location of the BB center [4] [10] [11] . For example, well-defined radiation fields can be detected by applying threshold methods to image histograms. Dong et al. [12] applied threshold detection as a first step in computing the center of mass of a reference radiation field applied to tungsten ball phantoms.
In this study, we propose using an intensity-weighted centroid of a BB to represent its center on the image. This approach will allow us to determine the theoretical limit of a perfect imaging system. The central principles of this approach were proposed a few years ago and applied to an animal study published in 2008 [13] . These principles are further elaborated in this manuscript, supported by experimental imaging data that demonstrate the practical limit in clinically relevant scenarios.
Subpixel detection accuracy has been demonstrated by other investigators. Du et al. [14] reported an approach based on a Hough transform algorithm applied to prior knowledge of field shapes. They reported that the method could detect the centers of circular fields with an absolute error of 0.037 ± 0.019 pixels. While the Hough transform technique has advantages, such as insensitivity to image noise and image discontinuities, an intensity-weighted centroid method is still desirable in many respects. The centroid method requires no prior knowledge of shape and can be readily implemented.
In this technical note, we will show that: (1) The measurement accuracy of a BB center is subpixel or a small fraction of the pixel size, and this accuracy can be derived analytically for ideal situations; and (2) In clinically realistic situations, the localization accuracy can be measured through multiple images of the same phantom containing two or more BBs. This study was motivated by the aforementioned application studies where high-accuracy measurements are demanded. For instance, if the measurements require submillimeter accuracy, the “ruler” (measuring device) should have a resolution on the order of 0.1 mm or lower in order to achieve a reliable result. When the combination of portal imager and BB is used, the accuracy requirement translates into subpixel level. Since image quality could influence measurement accuracy, we also studied the effects of reduced image quality on the intensity-weighted centroid approach. In this way we derive the practical limit of measurement accuracy of current technologies used in radiation oncology clinics.
2. Materials and Methods
2.1. Intensity-Weighted Centroid in Digital Image
In the physical space, an object may be located by its centroid
 (1)
(1)
This definition is readily applied to images where the function
 expresses the intensity of a 3-di- mensional image.
In an ideal noiseless, zero-background image, voxel size is infinitesimal and the image of an object is congruent regardless of its position and orientation. Thus the centroid of the object image can be accurately calculated with Equation (1). In reality, voxels of a digital image have finite dimensions and the image intensity is a stepwise function of spatial coordinates. To simplify the mathematical expressions to follow, let a voxel be a unit cube with coordinates
 at the center. Because the image is now digitized, the x-coordinate, for example, of the centroid of the imaged object can be calculated with the following equation:
 (2)
(2)
It follows that the x-coordinate is independent of the image intensity distribution on y-z plane, therefore the 3- dimensional (hereafter 3-D, and similarly 2-D and 1-D) problem is reduced to 1-D problem. Similar arguments apply to the y and z coordinates. By Equation (1), in an ideal 1-D image the actual centroid of an object is
 (3)
(3)
Once the image is digitized, from Equation (2) the measured centroid of the object is
 (4)
(4)
When utilized in a 2-D image, which is the scenario to be investigated in this project, Equation (2) reduces to the following form
 (2’)
(2’)
Example analytical solutions for the detection accuracy of simple-geometry objects are given in the Results.
2.2. Acquisition of Test Images
The intensity-weighted centroid method was tested using BB phantoms on a True Beam STx linac system (Varian Medical Systems, Palo Alto, CA). High resolution single exposure images were used throughout the measurements. The imaging panel has 0.39 mm pixel size and the default source to image distance (SID) was 150 cm. When projected to the linac isocenter plane, the pixel size is 0.26 mm, which will be regarded as the default pixel size thereafter.
Three types of measurements were performed with the MV portal imager. Firstly, to test the reproducibility of the BB position measurement, a BrainLab ball bearing phantom (i.e., the phantom pointer, BrainLab AG, Feldkirchen, Germany) was placed at the linac isocenter position. The phantom has a single BB of 5-mm diameter that is normally used for the Winston-Lutz test. The linac gantry was rotated to 90˚, because we assumed that at this gantry angle the linac and imager system is more prone to mechanical instability such as vibrations. The linac system and the BB phantom remained untouched during the imaging study. Three (3) monitor units (MUs) were delivered for each image, with the linac jaws set at 10 cm × 10 cm. The images were taken at various dose rates, from 5 to 600 MU/min, in an attempt to reflect the low-frequency mechanical instability. A series of 20 images were taken at each dose rate.
Secondly, to verify the measured BB displacement versus known values, MV images were taken for the phantom pointer when it was translated by predefined distances. The imaging protocol and machine settings were identical to the above step. The BB was moved by a micrometer upwards by 0.01 mm each step for a total distance over two pixels. A series of images were taken for the BB after each step in order to examine the resolution of BB center measurement in clinically realistic operations of a given linac system.
Lastly, to evaluate the BB position accuracy versus image noise, MV images were taken for an IsoCal phantom (Varian Medical Systems). The IsoCal phantom is equipped for imager geometric calibration [9] . The phantom has 16 BBs of 4-mm diameter embedded in a hollow cylinder. It was positioned with laser alignment at the linac isocenter. During the imaging process, the gantry, collimator, and table angles remained at zero, and the table was shifted in the horizontal plane to 20 random positions. A 20 cm × 20 cm field was used to take MV images of the phantom. At each position, eight images were taken with 0.03, 0.05, 0.1, 0.3, 0.5, 1.0, 3.0, and 5.0 MUs. The purpose of this step was to measure the detection accuracy of the BBs in a linac MV imaging system and to study the effects of image noise on the accuracy of centroid computation. The theory behind this method is elaborated in the Appendix. An ionization chamber was used to verify the linearity of imaging MUs.
2.3. Image Processing and Data Analysis
The images derived as described in the above section were processed using MatLab (The Math Works, Inc.). ImageJ (http://imagej.nih.gov/ij/) was used to manually verify part of the results. Image processing took the following essential steps, as shown in Figure 1. Noise was first removed via a 2-D adaptive Wiener estimation method [15] . For exceptionally noisy images a larger rectangle and subsequent median filtering were used. Morphological reconstruction was used to find a preliminary estimate of the background. Removing this background gave a preliminary image of the BBs. This image was then used to construct a mask covering the BBs using Otsu’s method [16] to determine an appropriate grayscale threshold. Artifacts were removed from this mask by removing connected components with low intensity areas and those connected to the image border. This mask was then used to remove the BBs from the noise-removed image. The background was estimated again by morphologically opening the masked image and removed from the original image. The mask was then used to remove the remainder of the image, resulting in a “net image” of the BB (Figure 2). The coordinates of the BB were computed using a MatLab intensity-weighted centroid function.
Image contrast was quantified by taking the average of nine central pixels of the BB image and comparing to nearby background readings. The reported contrast-to-noise ratio (CNR) was calculated with a randomly selected image from each series. A reference noise level was obtained by a rectangular region of interest near the BB projection.
In order to evaluate the absolute BB position accuracy, we propose using the standard deviation of the measured distance between two BBs [13] . As shown in the Appendix section A.1, the relationship between the standard deviation of the measured BB distance and that of the individual coordinates is

Figure 1. Flowchart of the image processing algorithm.
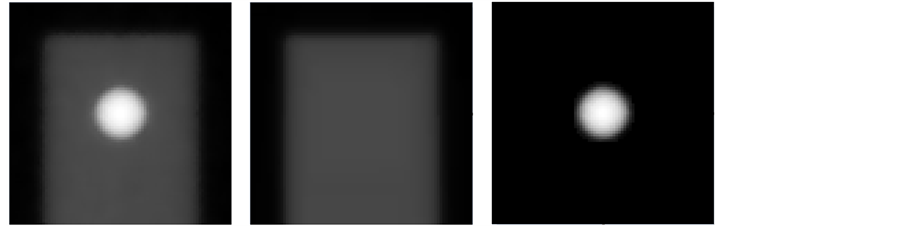
Figure 2. Sample images showing image processing results. Left: 5 mm spherical ball bearing pointer (BrainLab); middle: reconstructed background; right: BB image with background removed. The original image was obtained with 3 MU.
 (5)
(5)
To satisfy the conditions of Equation (5), the BBs must be located on a plane parallel to the imager, so that the BB projections maintain a theoretically constant distance in the images. Two such BBs were chosen on the IsoCal phantom.
3. Results
3.1. Analytical Solutions for the Detection Accuracy
In this section we will firstly derive the detection accuracy of a linear rod that aligns with an array of pixels, thus the rod is considered a 1-D object. We assume an ideal situation where the background intensity is zero and the image noise can be ignored. We use
 to denote the center of the ith pixel. For convenience and simplicity, the pixel size is set to a unit length.
Suppose that the intensity function
 of a rod is uniform along its long axis. Assume also that in an image the rod covers n (>1) pixels, stretching from
 to
to
 (note that when pixel size is 1,
 ), where parameters a and b are within (−1/2, 1/2) in the unit of pixel size. It is easy to see that the actual centroid of the object is
 (6)
(6)
From Equation (4), the centroid measured from the digitized image is
 (7)
(7)
The error in rod centroid measurement is then
 (8)
(8)
It can be derived from Equation (8) that, the theoretical upper limit of measurement error for a uniform-in- tensity object is
 pixels. As a matter of fact, Du et al. [14] presented the special case where a short 1-D object occupies 2 pixels, showing that the object center is still detected with subpixel accuracy.
Having derived the localization accuracy for a 1-D rod under ideal conditions, i.e., on an image without noise, distortion, and beam divergence, we will tackle the more difficult case of the theoretical detection accuracy of a uniform sphere (such as a BB) in a 2-D image. To simplify the formula, we use an approximation of linear at-
tenuation, so that the intensity function of the sphere’s image has the form of
 over the range that
the BB extends, after an integration with respect to y. Assume that the BB has a diameter of n pixels, and the reference position is when it extends from the center of pixel
 to the center of pixel
 . A 1-D formula is derived in the Appendix from Equations (3) and (4) for the situation when there is a displacement of δ within (−1/2, 1/2) along the pixel array. The reader may review the derivation in the Appendix section A.2. Here, we
directly present the results as follows: the actual center of the sphere is , and the image intensity-weighted centroid of the sphere is
 . Thus the error in sphere center measurement is
 (9)
(9)
This error is measured in the unit of pixel size. As predicted by the above formula, the theoretical error of the BB center measured using the intensity-weighted centroid reaches a maximum when
 pixels. The maximum error of BB center is
 and numerically calculated for five different diameters. The results are listed in Table 1.
The BBs used in quality assurance usually have diameters of a few millimeters, extending roughly 10 to 20 pixels in a typical portal image. Thus, given the assumptions we made above, the BB positions in a phantom can be determined with a high precision using the intensity-weighted centroid method.
3.2. BB Position Reproducibility
Clearly, reproducibility also plays a role in determining the measurement accuracy of the method expounded in this manuscript. To systematically examine BB position reproducibility, a series of images were taken by varying exposure time. The results are presented in Table 2.
Initially, it was assumed that longer exposures would have the tendency to average out possible mechanical vibrations in the measurement system, whereas a shorter exposure would be representative, or at least could be assumed to contain, such errors. The imaging system was demonstrated to be quite stable however, for all exposure times studied, and in the worst case yielded an uncertainty smaller than 0.02 mm. The uncertainties seem to be inversely correlated with the CNR. That different dose rates result in various CNRs might be caused by nonlinear and different detector responses. However, this needs further research and is beyond the scope of the present study.
3.3. Verification of BB Displacement
Figure 3 shows the measured BB displacement as a function of expected displacement given by the micrometer, with a standard deviation of 0.006 mm for the discrepancies. The linearity of Figure 3 (R2 = 0.999) indicates that the intensity-based centroid measurement of BB center is highly accurate for fine submillimeter displacements. Combined with the reproducibility demonstrated in the above section, these results are encouraging as the lower limit of detectability approaches 0.01 mm for the clinical imaging system utilized in this study. This is an improvement to the Varian center detection function built in to the clinical imaging applications that yields a resolution of 0.1 mm. Furthermore, the system tracks the actual displacement well over a range of 2 pixels.

Table 1. The theoretical maximum error in ball bearing center measurement using intensity-weighted centroid method on digital images. The unit is pixel size.
Table 2. BB position reproducibility. Images were acquired with 3 MU each at varying dose rates. Vertical and longitudical coordinates are denoted with x and y. CNR is contrast-to-noise ratio.

Figure 3. Verification of BB displacement. MV images were taken for the phantom pointer when it was translated by known distance in 0.01 mm steps. BB center measurements (cross) compared well with its expected positions (straight line). The Standard deviation is of the discrepancy between the measured and expected displacement.
3.4. BB Position Accuracy versus Noise
The imaging monitor units were verified for nominal values of 0.03, 0.05, 0.1, 0.3, 0.5, 1.0, 3.0, and 5.0 MUs. Five ionization chamber readings were taken for each MU value, and the average and standard deviation were calculated for each data point. The results are plotted in Figure 4. Linear regression reveals a correlation coefficient of 0.999.
Important to the intensity-based method articulated in this manuscript is an understanding of how image noise could influence the measurement of BB position. We systematically varied the MU per image in order to study the impact on measured position. As Table 3 shows, increasing the image noise (decreasing CNR) does negatively affect the resultant measure of BB position accuracy (Figure 5). In the table, d stands for the distance between two selected BB projections;
 is regarded as the overall accuracy of BB centroid measurement (see the Appendix); and
 stands for the accuracy of the individual coordinates. Even at 0.03 MU, however, the lowest MU deliverable, the error is still around 0.1 mm, well within clinically meaningful tolerances.
4. Discussion
The intensity-weighted centroid method described in this manuscript can achieve subpixel accuracy in detecting the position of an object in digital image. The methodology is straightforward to understand and implement. When applied to a commercial linac-based imaging system, a system with non-uniform background, noise, non-parallel X-rays, scatters, and possible mechanical instabilities, such as the one used in this study, positional measurements can be as precise as a few microns. This represents an improvement over the resolution, 0.1 mm, of the current vendor’s detection of circular objects and creates an opportunity to utilize this method for linac mechanical accuracy measurements [17] .
One advantage of this approach is that the methodology is not restricted by marker shape. Although the experiments in this study were carried out with phantoms containing spherical BBs, which have the most convenient shape and are commonly found in the clinic, this need not be the case. There might be situations in which a cuboid or other special marker shape is appropriate for imaging and detection. The centroid method could accommodate such cases without modification whereas the recently reported Hough-transform algorithm would require prior knowledge of imaged shape. Additionally, the accuracy of Hough-transform could be affected by the size of the available pixels. However, the Hough-transform approach was robust against image noise and artifacts. While this could be one downside of the intensity-weighted centroid method, our results indicate that the method performs very well with systematically varying image noise. Even when contrast-to-noise ratio decreased by a factor of 10, the uncertainty in the measured BB position still remained within clinical tolerance. At clinically utilized MUs for portal imaging, usually on the order of 2 - 3 MU/image, the detection uncertainty was much less and on the order of tens of microns.
Furthermore, it does not appear that mechanical instabilities in the imaging system influence measurement

Figure 4. The linearity of imaging monitor units. The trend line is the best fit of the data. Standard deviation is plotted for the corresponding data point (circle).

Figure 5. Accuracy of BB centroid measured as a function of CNR.
Table 3. BB position accuracy versus image noise, as seen by varying levels of MU per image.
reproducibility. Comparing short and long exposure times, from 0.3 sec to 36 sec, although the uncertainty in the measurement changes by a factor of 2, in the worst case it is still on the order of tens of microns.
5. Conclusion
We have proposed an intensity-based centroid method to detect the position of an object in a digital image. When applied with a clinical, linac-based imaging system, the methodology produces an accuracy on the order of a few microns. This scheme is straightforward to implement, has high reproducibility, and is robust to image noise as measured by severely reduced imaging MUs. This level of subpixel accuracy exceeds that required for most clinical utilization.
Cite this paper
MutianZhang,JosephDriewer,YichiZhang,SuminZhou,XiaofengZhu, (2015) The Measurement Accuracy of Ball Bearing Center in Portal Images Using an Intensity-Weighted Centroid Method. International Journal of Medical Physics, Clinical Engineering and Radiation Oncology,04,273-283. doi: 10.4236/ijmpcero.2015.44033
References
- 1. Klein, E.E., Hanley, J., Bayouth, J., Yin, F.F., Simon, W., Dresser, S., et al. (2009) Task Group 142 Report: Quality Assurance of Medical Accelerators. Medical Physics, 36, 4197-4212.
http://dx.doi.org/10.1118/1.3190392 - 2. Lutz, W., Winston, K.R. and Maleki, N. (1988) A System for Stereotactic Radiosurgery with a Linear Accelerator. International Journal of Radiation Oncology*Biology*Physics, 14, 373-381.
http://dx.doi.org/10.1016/0360-3016(88)90446-4 - 3. Sykes, J.R., Lindsay, R., Dean, C.J., Brettle, D.S., Magee, D.R. and Thwaites, D.I. (2008) Measurement of Cone Beam CT Coincidence with Megavoltage Isocentre and Image Sharpness Using the QUASAR Penta-Guide Phantom. Physics in Medicine and Biology, 53, 5275-5293.
http://dx.doi.org/10.1088/0031-9155/53/19/002 - 4. Du, W., Yang, J., Luo, D. and Martel, M. (2010) A Simple Method to Quantify the Coincidence between Portal Image Graticules and Radiation Field Centers or Radiation Isocenter. Medical Physics, 37, 2256-2263.
http://dx.doi.org/10.1118/1.3397452 - 5. Du, W., Yang, J.N., Chang, E.L., Luo, D., McAleer, M.F., Shiu, A. and Martel, M.K. (2010) A Quality Assurance Procedure to Evaluate Cone-Beam CT Image Center Congruence with the Radiation Isocenter of a Linear Accelerator. Journal of Applied Clinical Medical Physics, 11, 15-26.
- 6. Grimm, J., Grimm, S.L., Das, I.J., Zhu, Y., Yeo, I., Xue, J., et al. (2011) A Quality Assurance Method with Submillimeter Accuracy for Sterotactic Linear Accelerators. Journal of Applied Clinical Medical Physics, 12, 182-198.
- 7. Du, W. and Gao, S. (2011) Measuring the Wobble of Radiation Field Centers during Gantry Rotation and Collimator Movement on a Linear Accelerator. Medical Physics, 38, 4575-4578.
http://dx.doi.org/10.1118/1.3609098 - 8. Nyflot, M.J., Cao, N., Meyer, J. and Ford, E.C. (2014) Improved Accuracy for Noncoplanar Radiotherapy: An EPID-Based Method for Submillimeter Alignment of Linear Accelerator Table Rotation with MV Isocenter. Journal of Applied Clinical Medical Physics, 15, 151-159.
- 9. Gao, S., Du, W., Balter, P., Munro, P. and Jeung, A. (2014) Evaluation of IsoCal Geometric Calibration System for Varian Linacs Equipped with On-Board Imager and Electronic Portal Imaging Device Imaging Systems. Journal of Applied Clinical Medical Physics, 15, 164-181.
- 10. Schreibmann, E., Elder, E. and Fox, T. (2009) Automated Quality Assurance for Image-Guided Radiation Therapy. Journal of Applied Clinical Medical Physics, 10, 71-79.
http://dx.doi.org/10.1120/jacmp.v10i1.2919 - 11. Winey, B., Sharp, G. and Bussière, M. (2011) A Fast Double Template Convolution Isocenter Evaluation Algorithm with Subpixel Accuracy. Medical Physics, 38, 223-227.
http://dx.doi.org/10.1118/1.3524227 - 12. Dong, L., Shiu, A., Tung, S. and Boyer, A. (1997) Verification of Radiosurgery Target Point Alignment with an Electronic Portal Imaging Device (EPID). Medical Physics, 24, 263-267.
http://dx.doi.org/10.1118/1.598070 - 13. Zhang, M., Huang, M., Le, C., Zanzonico, P.B., Claus, F., Kolbert, K.S., et al. (2008) Accuracy and Reproducibility of Tumor Positioning during Prolonged and Multi-Modality Animal Imaging Studies. Physics in Medicine and Biology, 53, 5867-5882.
http://dx.doi.org/10.1088/0031-9155/53/20/021 - 14. Du, W. and Yang J. (2009) A Robust Hough Transform Algorithm for Determining the Radiation Centers of Circular and Rectangular Fields with Subpixel Accuracy. Physics in Medicine and Biology, 54, 555-567.
http://dx.doi.org/10.1088/0031-9155/54/3/006 - 15. Sindelar, C.V. and Grigorieff, N. (2011) An Adaptation of the Wiener Filter Suitable for Analyzing Images of Isolated Single Particles. Journal of Structural Biology, 176, 60-74.
http://dx.doi.org/10.1016/j.jsb.2011.06.010 - 16. Otsu, N. (1979) A Threshold Selection Method from Gray-Level Histograms. IEEE Transactions on Systems, Man, and Cybernetics, 9, 62-66.
http://dx.doi.org/10.1109/TSMC.1979.4310076 - 17. Zhang, M., Zhou S. and Qu T. (2015) What Do We Mean When We Talk about the Linac Isocenter? International Journal of Medical Physics, Clinical Engineering and Radiation Oncology, 4, 233-242.
http://dx.doi.org/10.4236/ijmpcero.2015.43028
Appendix
A.1. Detection Accuracy Measured with Serial Images
A new principle is applied in the present study to evaluate the centroid detection precision of an object, which is observing the distance between two such objects measured from consecutive images. These images should be taken for objects of fixed distance at varying locations otherwise without moving, the measurement result would merely be the imaging reproducibility. For generalization, the following derivation is for 3-D images. Under the assumption that two objects are placed apart by distance d, and in image number m their real centroid coordi-
nates are
 and
and , respectively, the measured object distance is
 (A1)
(A1)
Equation (A1) allows for relative motion among images because the coordinate offsets are cancelled by the subtraction. When the errors in centroid coordinates are taken into account, the measured distance has an error relative to its real value. This error in distance can be derived through Taylor expansion:
 (A2)
(A2)
where
 and so on represent the measurement errors in the corresponding coordinates. The standard deviation of object distance measured from the image series (consisting of n images) is
 (A3)
(A3)
Note that for random errors the cross products of ,
,
 , and
, and
 yield zero in the above summation. The standard deviation of any measured coordinate is assumed to be identical to one another, i.e.,
 (A4)
(A4)
It is derived from Equation (A3) that
 (5)
(5)
For 2-D images, the z-coordinate is dropped from the above equation. It has to be emphasized that, in order to satisfy the conditions of Equation (5), the objects being imaged by a 2-D imager must have projections of theoretically constant distance in the image series. In 3-D images, though, this is no longer a concern.
A.2. Derivation of Equation (9)
The derivation of Equation (9) is accomplished by inserting appropriate expressions for a BB into Equation (4)

In order to derive an analytical solution of BB positional accuracy in a 2-D digital image, we have to assume an ideal situation in that the radiation beam is parallel and without scatter, the image is noise free, and the background is zero. The attenuation of the BB is approximated to be linear, thus the image intensity is proportional to
the chord length. In a given direction, say x, the integrated image intensity has the form of , where
R is the radius and
 is the center of the BB. Irrelevant constants such as π are omitted. For brevity, the BB is assumed to have a diameter of n pixels, and its edges extend from somewhere in pixel
 to
to , thus
 . The first pixel is arbitrarily assigned a coordinate of
 , therefore the pixels have coordinates of
 for
for . The reference position of the defined BB center is the center of pixel
 if n is an even number, or the boundary between pixels
 and
and
 if n is an odd number. If the BB
center deviates from the reference position by δ that is within half a pixel, then the x-coordinate of the BB center is
 (A5)
(A5)
In the digitized image, the terms in Equation (4) are calculated as follows:
 (A6)
(A6)
The term
 is zero for
 ; and for a pixel between
 and
and , it is
 (A7)
(A7)
For pixel , it is
 (A8)
(A8)
Summation of the terms expressed by Equations (A7) and (A8) for all the pixels yields
 (A9)
(A9)
With the above results it is easy to derive that
 (A10)
(A10)
thus the measurement error in the sphere center is
 (9)
(9)